2684
Characterization of the Microenvironment of the Intervertebral Disc in Patients with Chronic Low Back Pain by Z-spectral imaging1Radiology, Tongji Hospital, Tongji Medical College,HUST, Wuhan, China, Wuhan, China, 2Radiology, 1.Radiology Dept., 2. Bioengineering Dept., College of Medicine, University of Illinois at Chicago, Chicago, IL, United States, Chicago, IL, United States
Synopsis
To assess the microenvironment changes of intervertebral disc degeneration, ZSI data were collected from the lumbar spine of 26 patients with CLBP and 21 AC and produced maps of NOE, Water, GAG, APT, MTC. By comparing such parameters between the two groups, it was revealed that the microenvironment of the discs in AC group was different from the discs in the CLBP group. And, the microenvironment of the discs in the sore and non-sore subgroup was also different. ZSI is a noninvasive technique that can be used to test the changes of the microenvironment of the intervertebral discs.
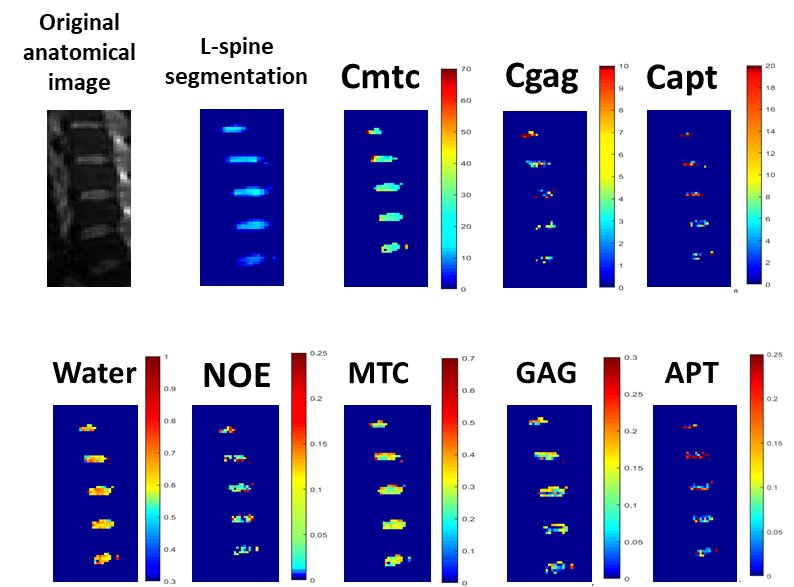
METHODS: ZSI data were collected from the lumbar discs of 26 patients with chronic non-specific low back pain (CLBP) and 21 asymptomatic controls (AC) with a CEST saturation pulse of 2 µT, 400 ms long and EPI readout at a 3T MRI scanner. Data were fitted with multiple Lorentzian curves to quantify the CEST effect from GAG and pH-depended APT, the NOE and MTC effects and the direct saturation of water. Maps of relative concentration were then computed based on the fit amplitudes and average values were computed within ROIs on L1/2, L2/3, L3/4, L4/5 and L5/S1. The conventional MTC, GAG, and APT contrasts were also computed as the asymmetry of the magnetization transfer ratios (MTRasym) at 6 ppm, ±1 ppm and ±3.5 ppm to get the Cmtc, Cgag and Capt values3, 4. All eight parameters (Figure 1)were finally compared between the CLBP and AC groups and between the subgroups of sore (14 patients) and non-sore (Nsore, 12 patients) pain.
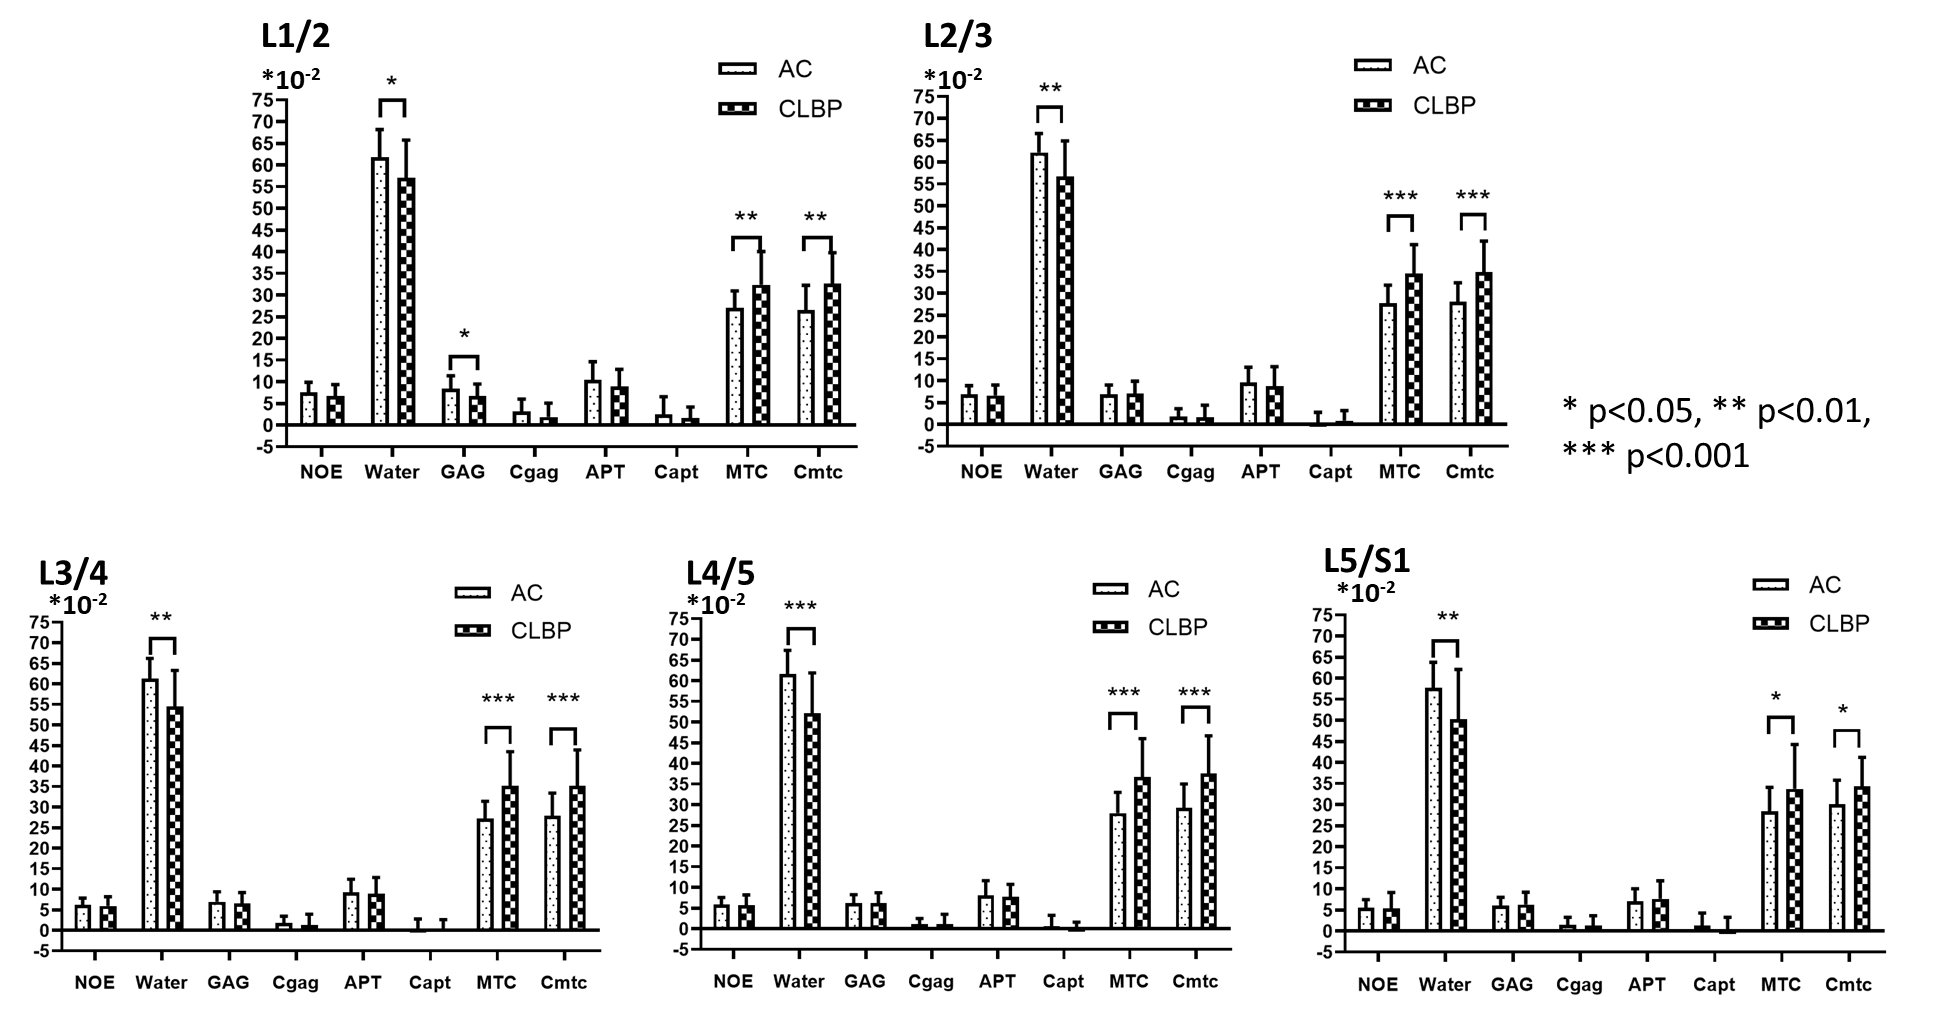
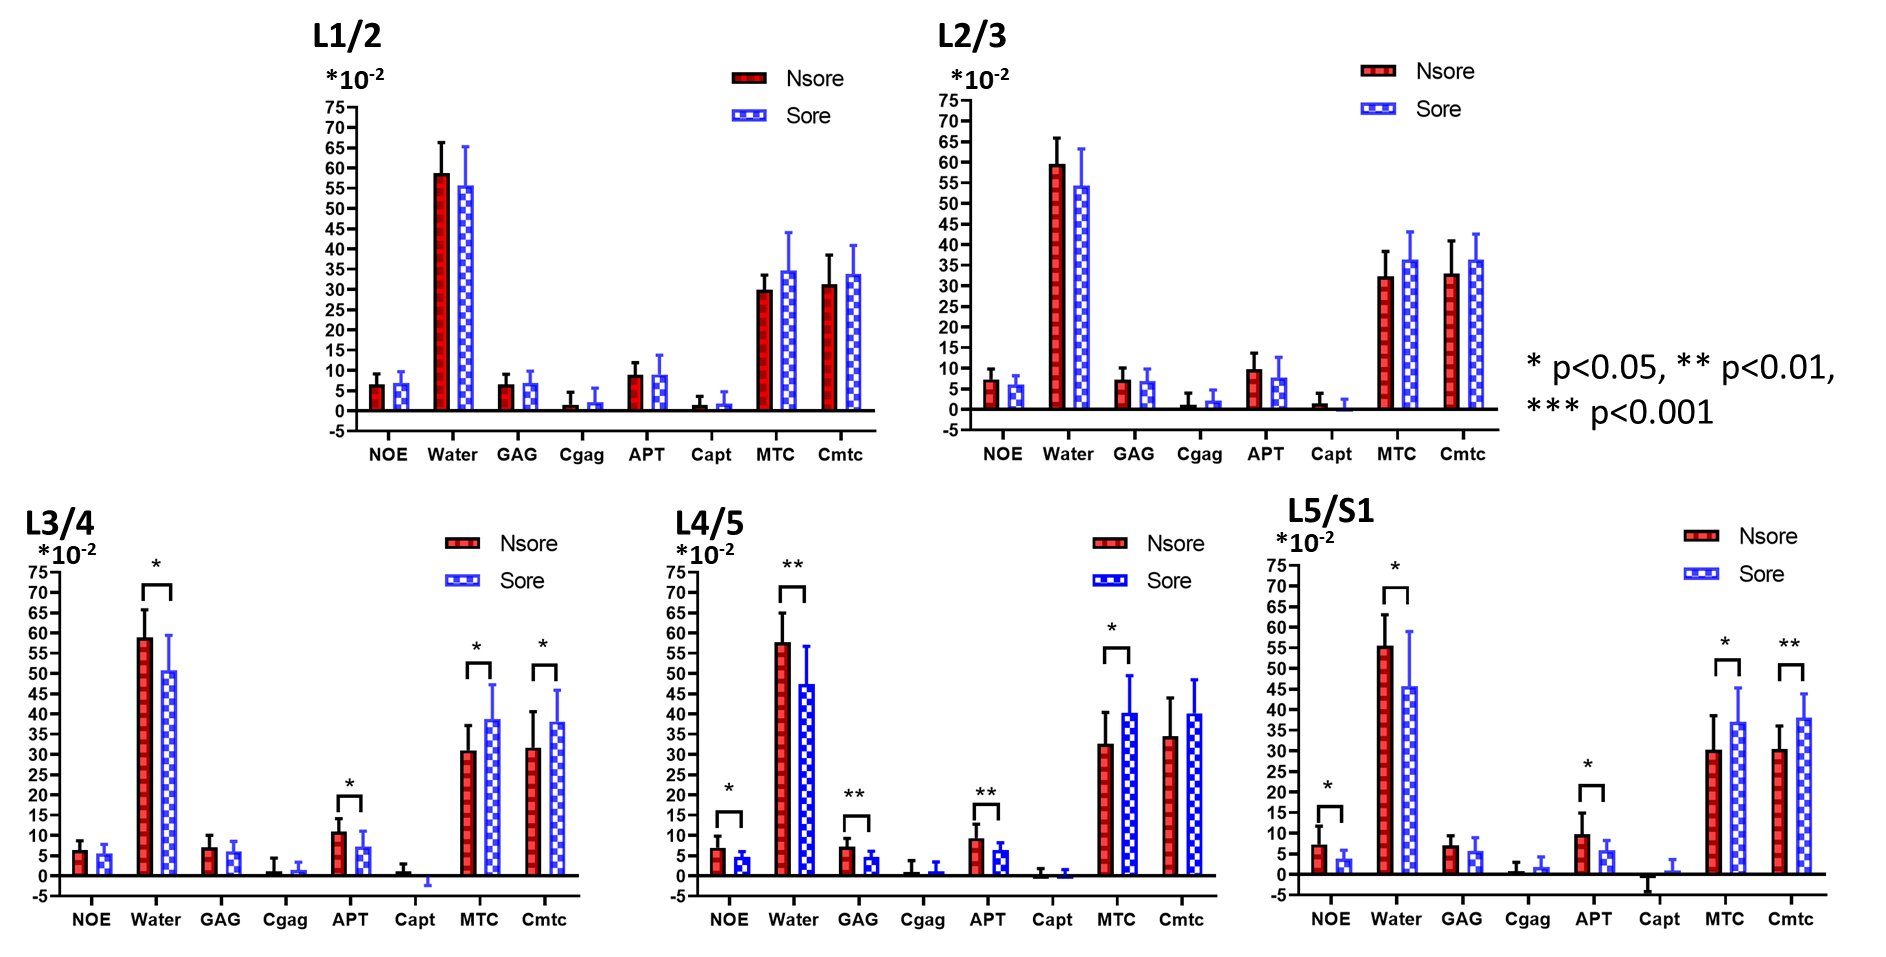
RESULTS: At all five levels, the average water values in the AC group were found significantly higher than the CLBP group, so as the average MTC and Cmtc (P<0.05, Figure 2). There were no differences in the comparisons of all parameters between the sore and Nsore groups in level L1/2 and L2/3. Instead, in level L3/4, L4/5 and L5/S1, the average Water and APT values in the Nsore group were found significantly higher and the average MTC and Cmtc values lower than the sore group (P<0.05, Figure 3).
DISSCUSION: The discs in AC group had more free water and collagen content than the discs in the CLBP group, suggesting that the loss of the free water and collagen content may be related with the back pain. Additional, the discs in the sore subgroup had less free water and collagen content, and lower pH-depended APT effect than the discs in the Nsore subgroup, suggesting that the lower pH may be the important factor of the sore pain of the back.
CONCLUSION: In conclusion, ZSI revealed interesting features of the microenvironmental changes in the intervertebral discs, and can therefore be proposed for further study of disc degeneration and lower back pain, which also can show more significant differences than conventional MTRasym.
Acknowledgements
No acknowledgement found.References
[1]. Vos T, et al., Years lived with disability (YLDs) for 1160 sequelae of 289 diseases and injuries 1990–2010: a systematic analysis for the Global Burden of Disease Study 2010. Lancet, 2012, 380(9859):2163–2196
[2]. Patrick N, et al., Acute and chronic low back pain. Med Clin North Am, 2014, 98(4):777–789
[3]. Zhou, J., et al., Amide proton transfer (APT) contrast for imaging of brain tumors. Magn Reson Med, 2003. 50(6): p. 1120-6.
[4]. Cai K., et al., Magnetic resonance imaging of glutamate. Nat Med,2012. 18(2):302–306.
Figures