2680
A 64-channel receive coil for accelerated diffusion imaging of the upper legs1Department of Biomedical Engineering and Physics, Amsterdam UMC, location AMC, Amsterdam, Netherlands, 2Department of Radiology and Nuclear Medicine, Amsterdam UMC, location AMC, Amsterdam, Netherlands, 3Department of Radiology, Utrecht UMC, Utrecht, Netherlands
Synopsis
In elite sports, hamstring injuries are very common and show high recurrence rates. Diffusion tensor imaging is a promising technique to obtain detailed information like return to play time about the injury. Due to the requirement of long scan times and high signal to noise ratio (SNR), a 64-channel upper leg receive coil was developed and compared to a conventional coil in healthy volunteers. Both coils show similar B0 offset and variance. The upper leg coil showed an SNR increase of more than 45% in the biceps femoris long head muscle. This allows for further acceleration of the sequence.
Introduction
Hamstring injuries are amongst the most common muscle injuries in elite athletes. The failure of current imaging methods like ultrasound and T2-weighted MRI to predict a return to play time1 and the high recurrence rate2 reveal the need for advanced imaging techniques.Diffusion tensor imaging (DTI) is a promising technique and could outperform T2-weighted imaging in the detection of small muscle changes3. However, long scan times and a high signal to noise ratio (SNR) are required to calculate the tensor parameters. To this aim a new upper leg coil was developed and tested.
Methods
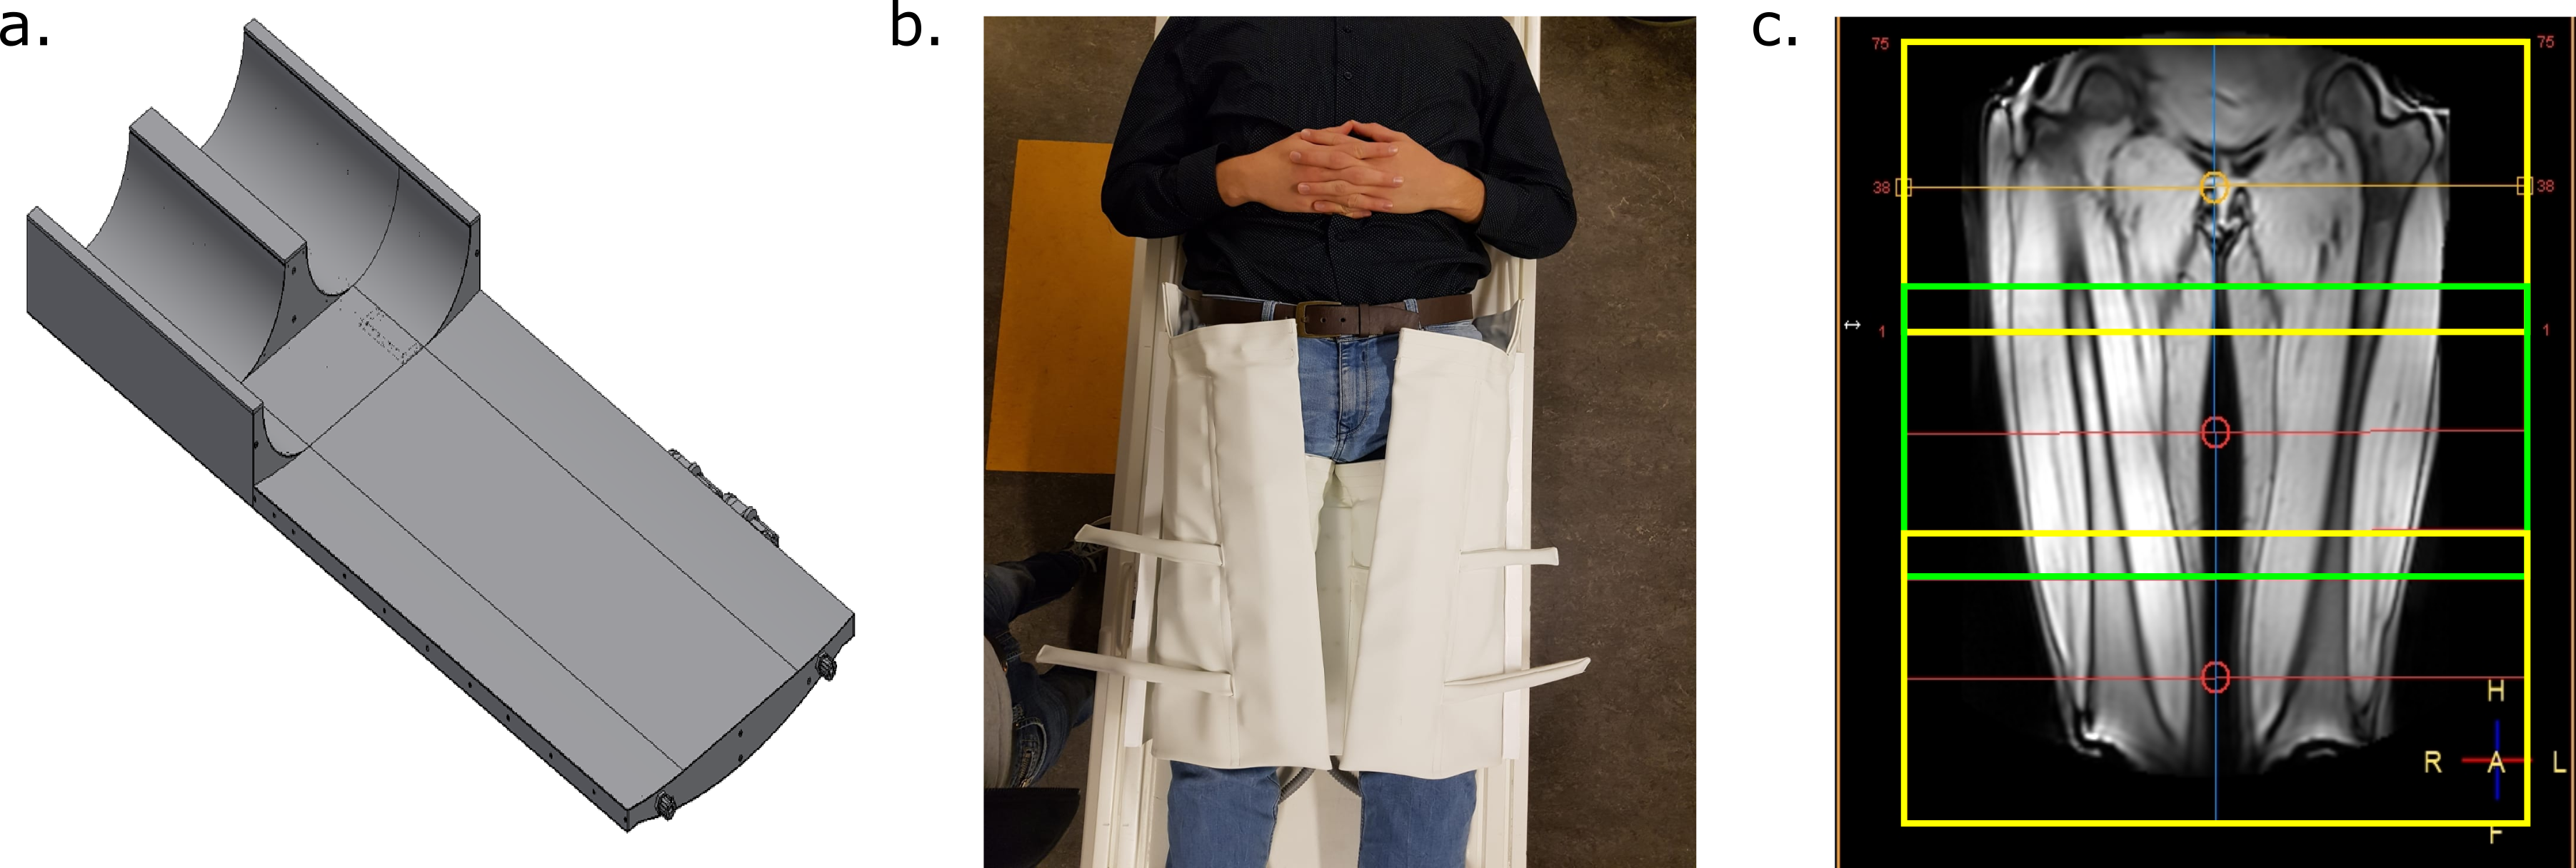
A 64-channel receive coil optimized for the upper legs was designed in cooperation with MR Coils (MR Coils B.V., Zaltbommel, The Netherlands). It consists of six coil element rows per leg and contains flexible elements to best fit the legs (Figure 1 a,b).Eight healthy volunteers (four male, mean age 22.6 years, range 21-24) were scanned at a 3.0 T MRI system (Philips Ingenia, Best, The Netherlands) in two sessions (8.1 days between the sessions, range 0-14), once with the new upper leg coil and once with a conventional coil (16 channel anterior and 10 elements from the posterior coil), which is currently used for muscle injury assessment of the legs.
The B0 homogeneity, noise correlation map and SNR with different acceleration factors (SENSE) were compared between the coils. Imaging of the upper legs from the knee to the hip was performed in three stacks with 30 mm overlap (Figure 1 c) with 31 slices each and with a slice thickness of 6 mm without gap for all sequences.
A four-point Dixon sequence (TE = 2.7 ms, ΔTE = 0.76 ms, TR = 228 ms ) with in-plane resolution 1.5x1.5 mm² and parallel imaging factor 2 (SENSE) was acquired. The B0 map was obtained from the first two echoes. The B0 offset and variation were calculated in the whole legs using a mask to suppress background noise.
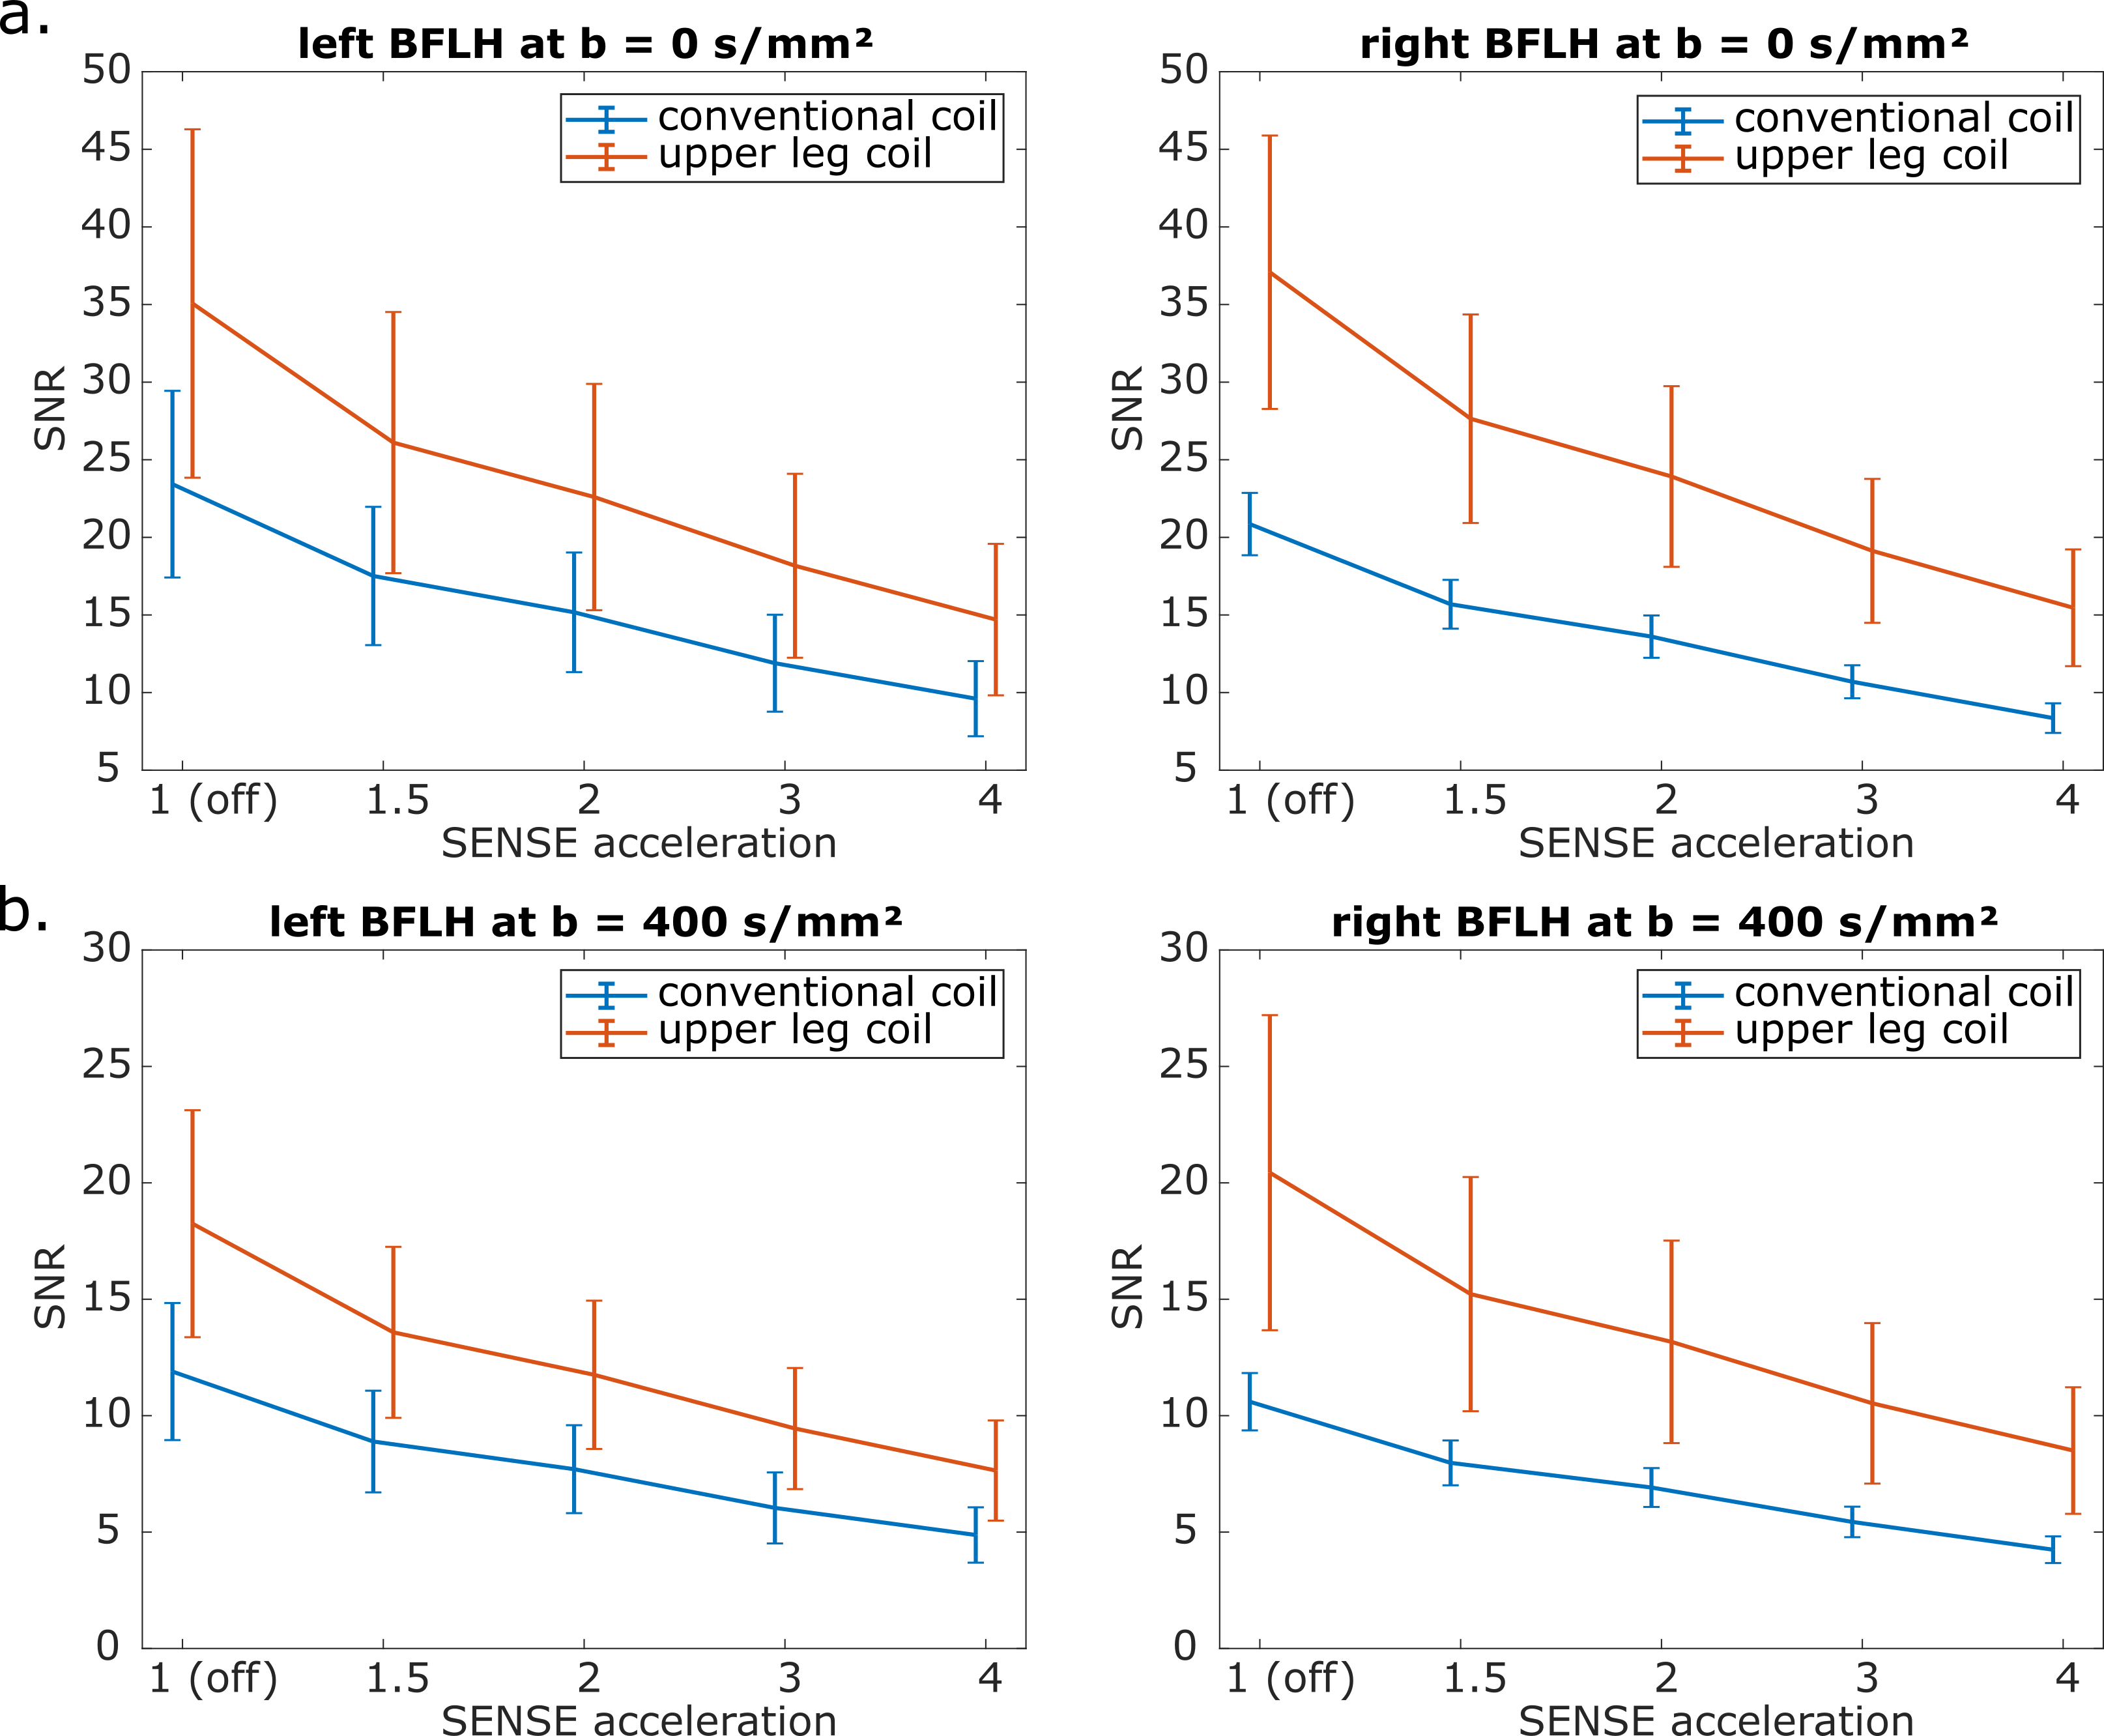
To investigate the SNR with different SENSE acceleration factors a spin echo EPI diffusion sequence (TE = 64 ms, TR = 3000 ms, 3x3 mm² in-plane) with six gradient directions and two b-values (0 and 400 s/mm²) was used with the SENSE values 1 (off), 1.5, 2, 3 and 4. The geometry factor (g-factor) map for each SENSE value was obtained from the scanner. SPAIR and gradient reversal fat suppression were applied. Additionally a noise-only image was acquired without SENSE acceleration by switching the RF power and gradients off.
Regions of interest were drawn in the biceps femoris long head (BFLH) in the out-of-phase Dixon images to assess the SNR in the hamstring. The unaccelerated SNR (SNR0) in the BFLH was calculated using a noise kernel with radius 3 and was corrected for Rician noise4. The SNR with SENSE acceleration was calculated according to5:
$$ SNR = \frac{SNR_0}{g\sqrt{R}} $$
with R the acceleration factor and g the g-factor. The SNR between conventional and upper leg coil (for each leg, b-value, SENSE value) and SNR between the right and left leg (for each coil, b-value, SENSE value) were compared using a paired-sample t-test. A p-value < 0.05 was considered significant.
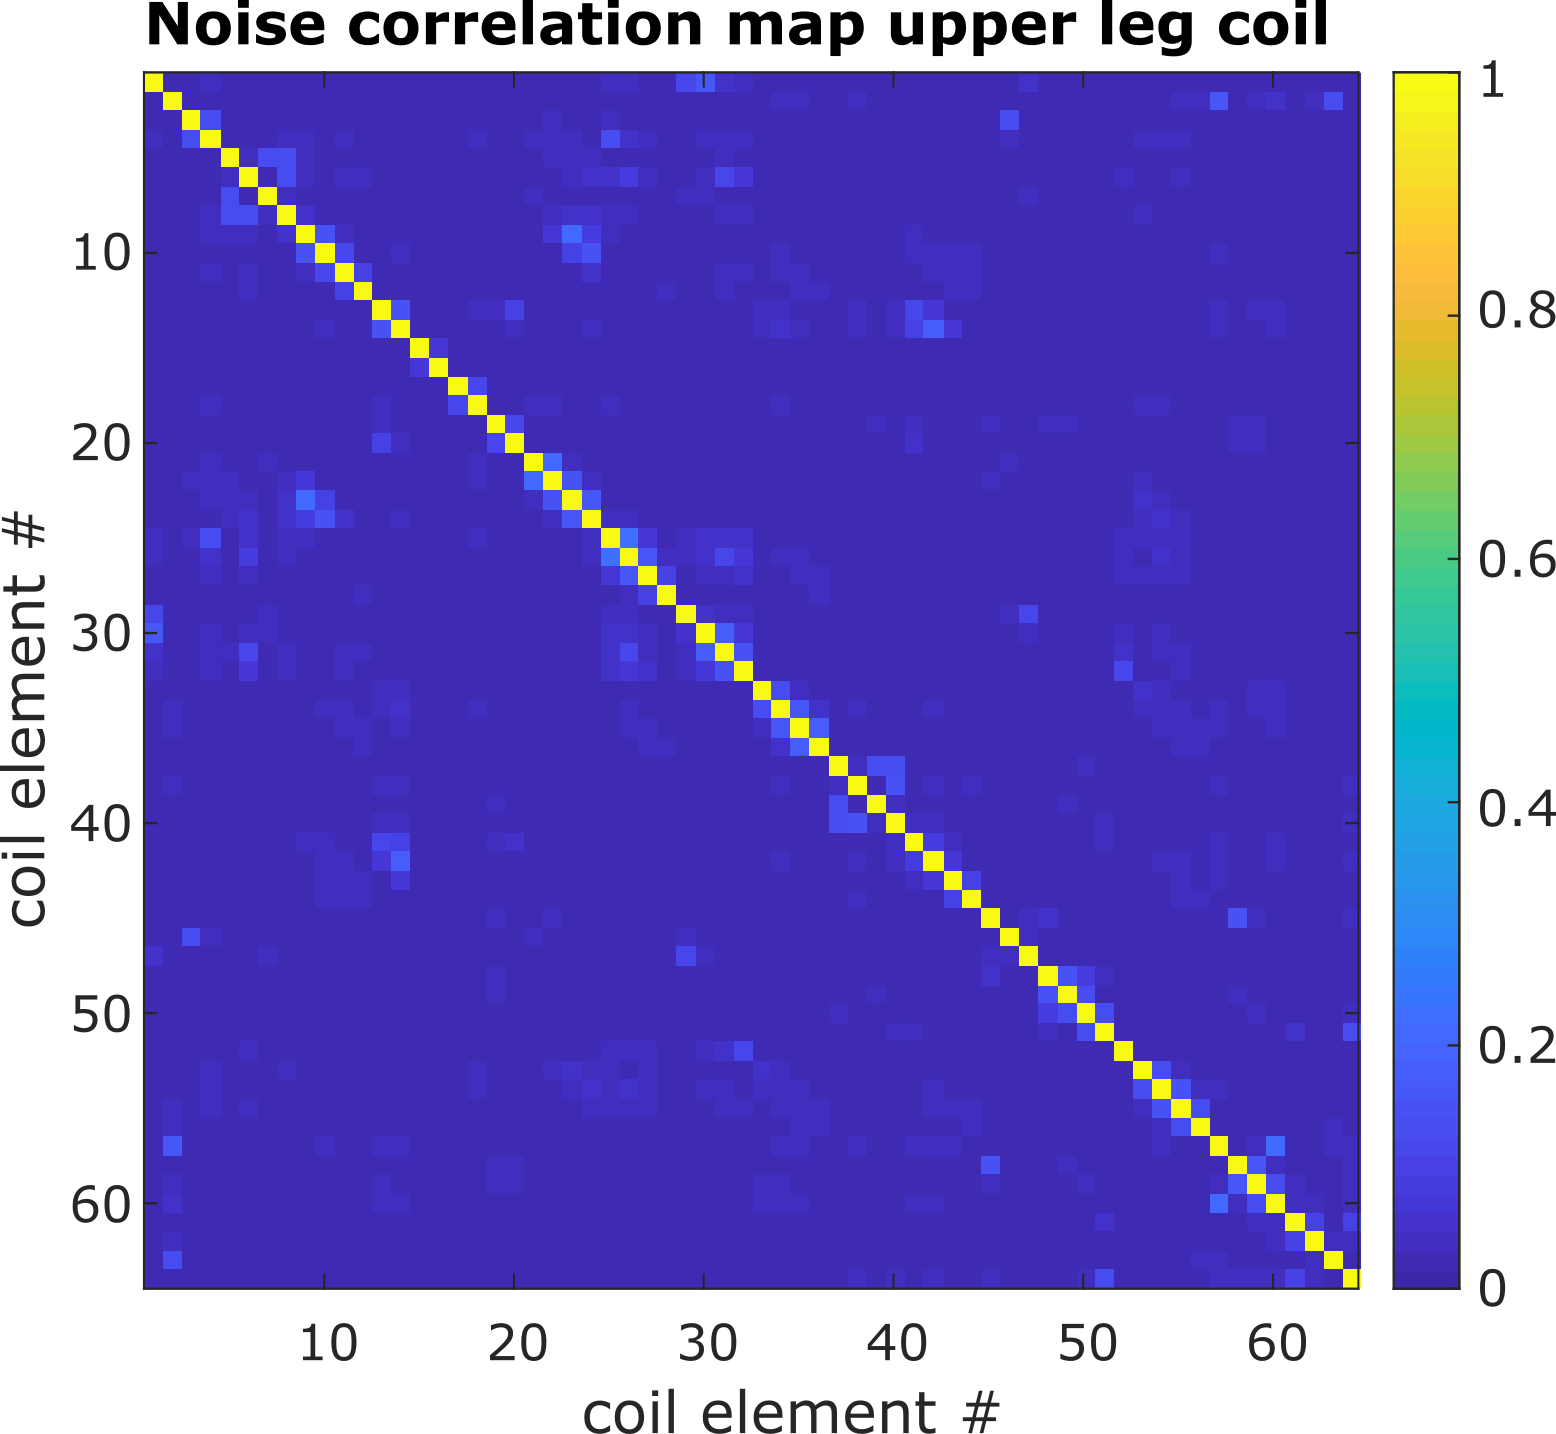
The noise correlation map of the upper leg coil was obtained by single channel reconstruction of the noise-only image.
Results
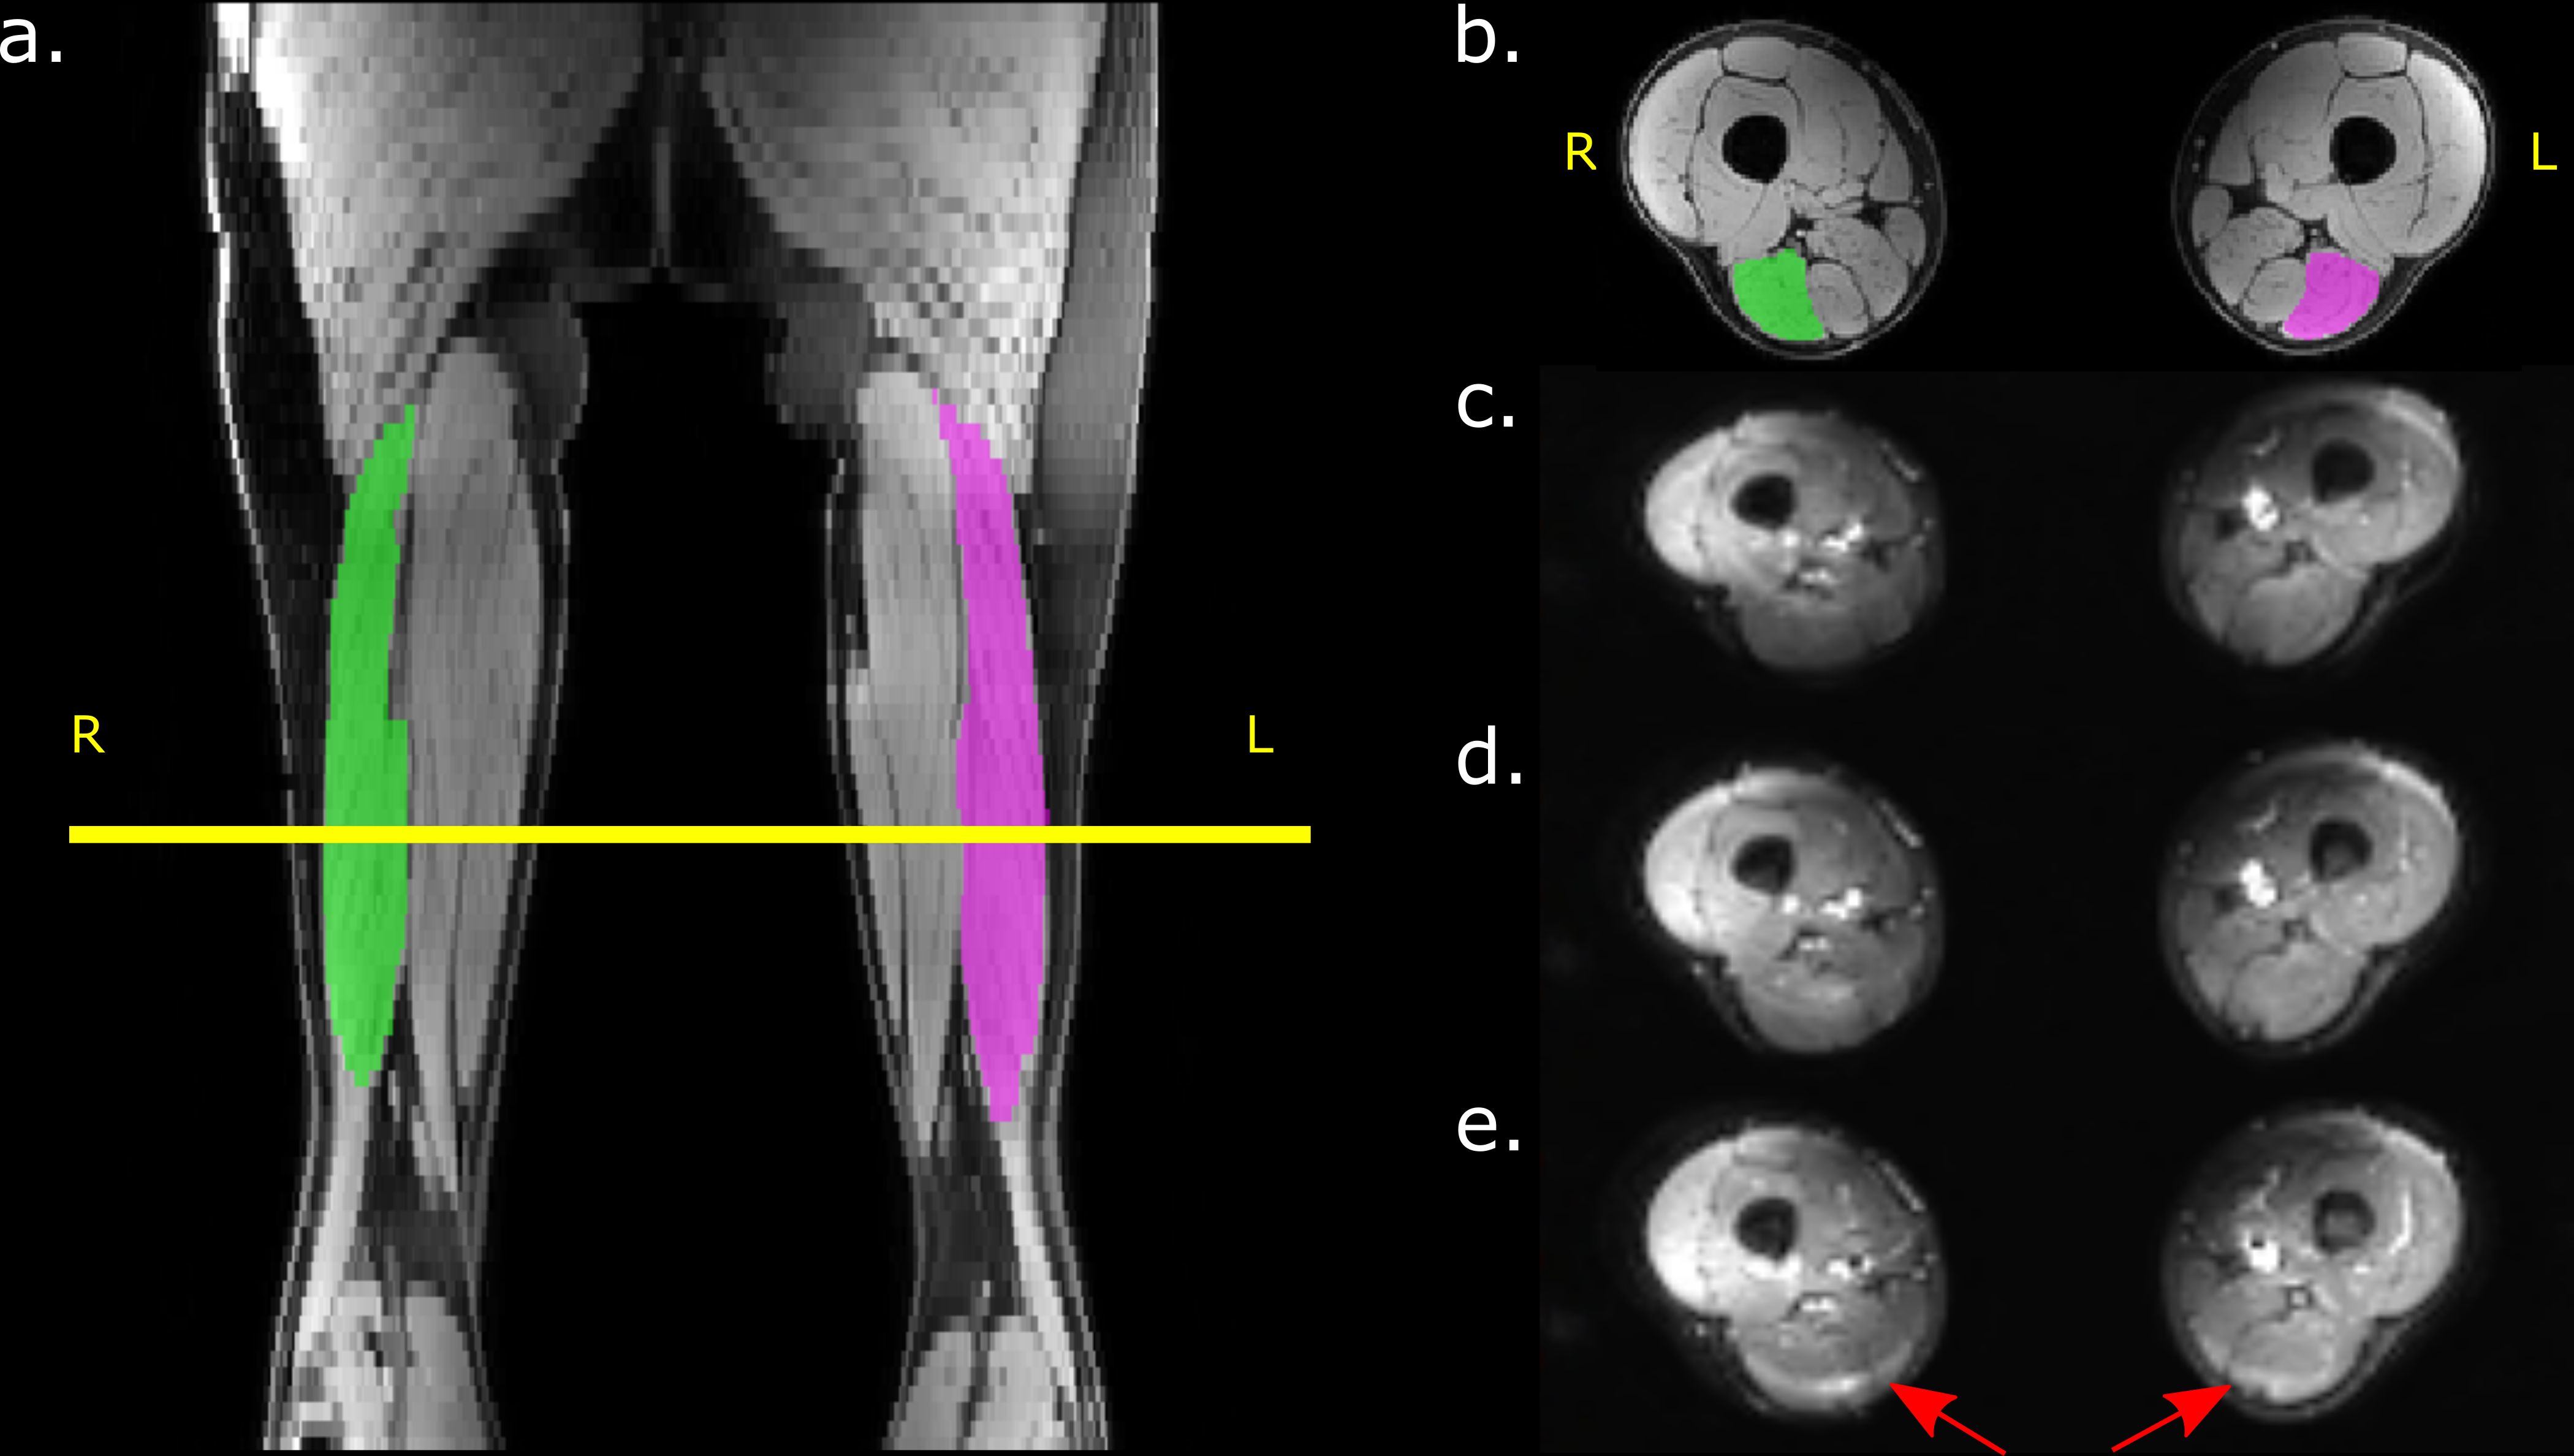
Figure 2 shows example Dixon water and DTI images with overlaid muscle segmentation acquired with the upper leg coil. Visual assessment of the different SENSE acceleration factors still showed high signal intensity and clear anatomical structures. However, with acceleration factor 4 a fat shift artifact arises in the hamstrings (red arrows in (e)).The noise correlation map of the upper leg coil is visualized in Figure 3. The mean correlation between the coil elements is below 5 % and for the conventional coil below 10 %.
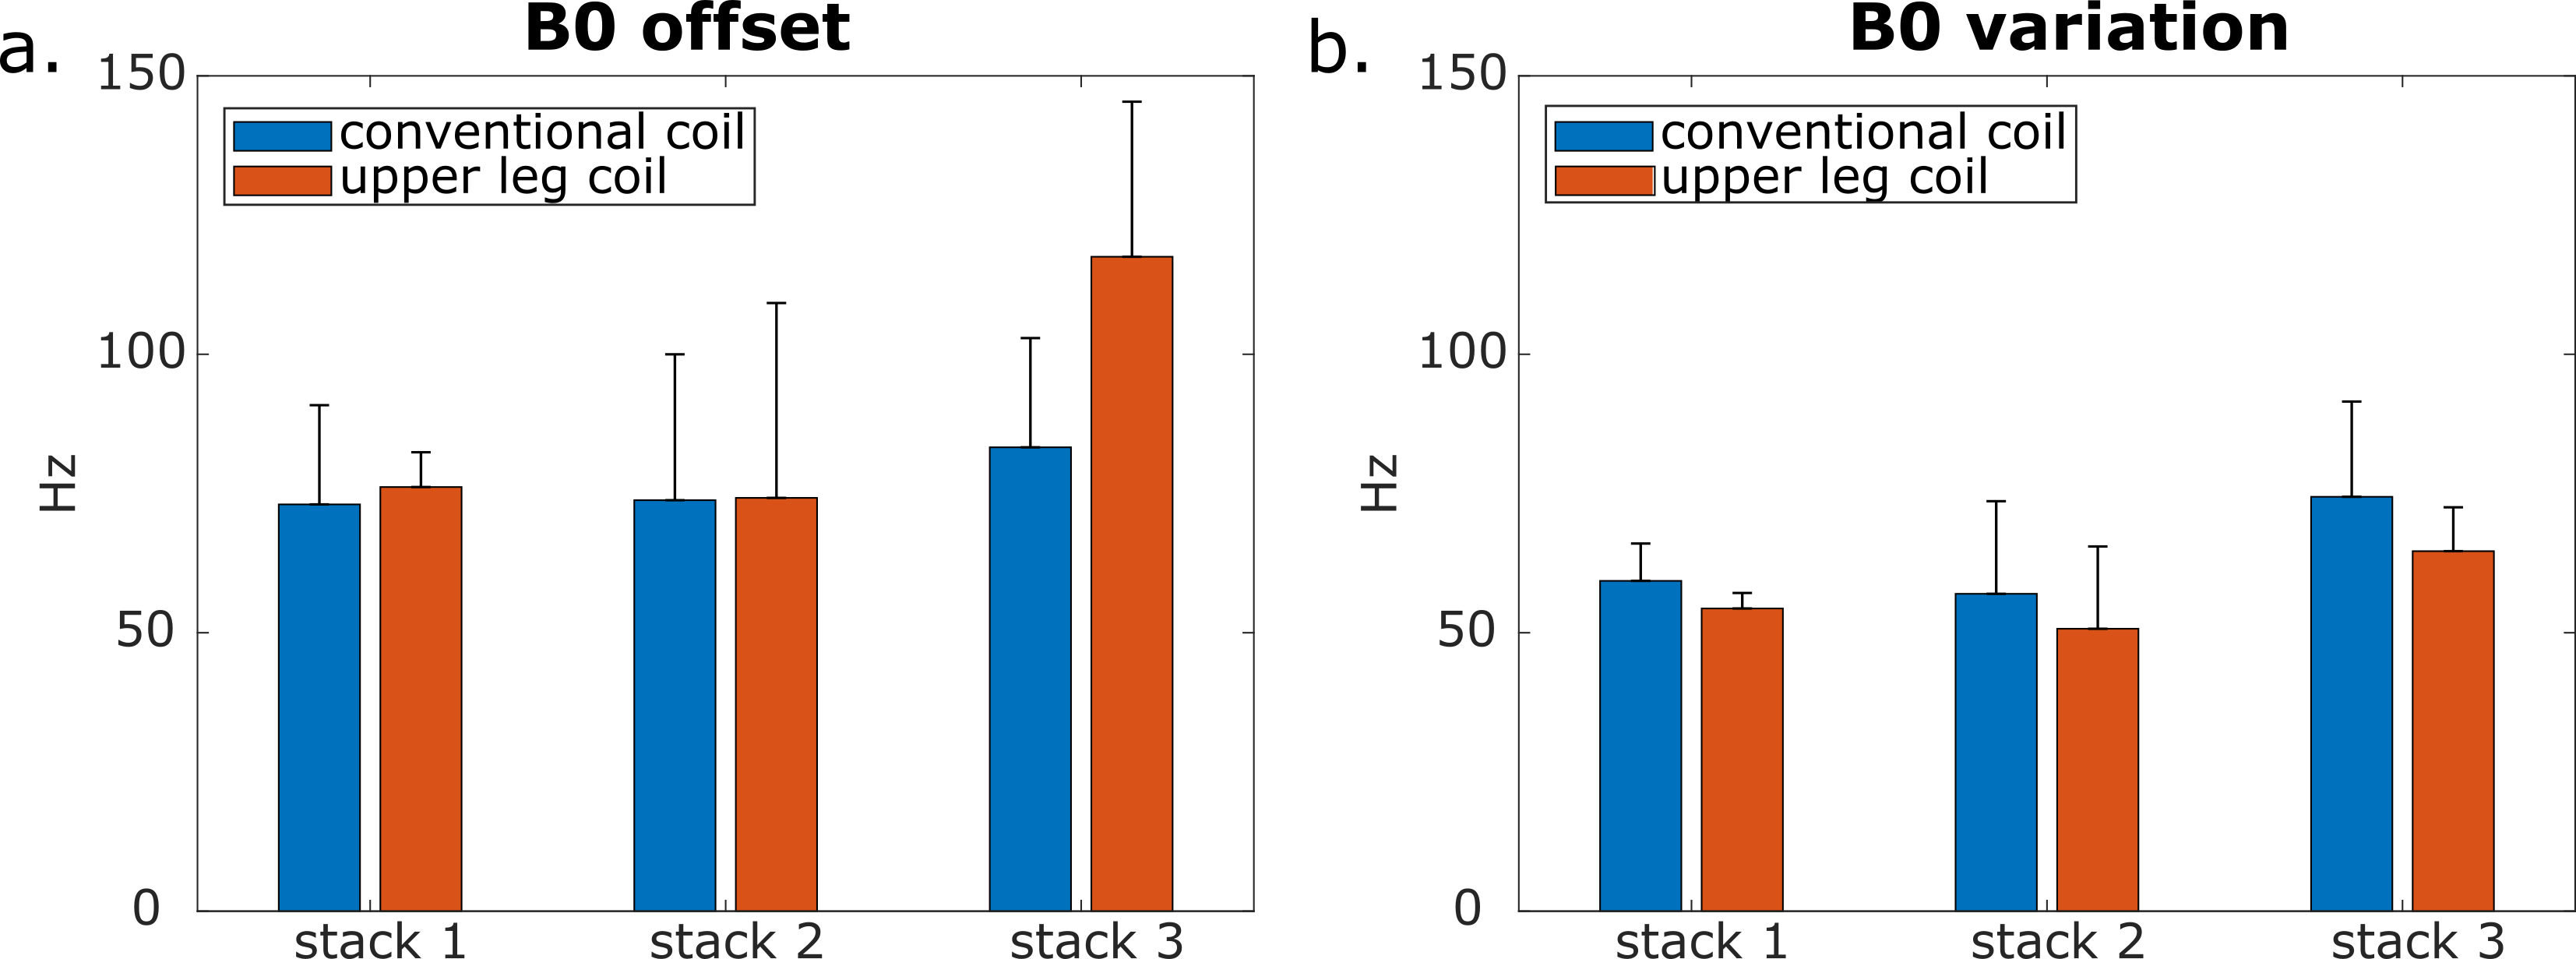
The B0 offset and variation lies between 50 and 100 Hz for both coils (Figure 4). The third stack acquired with the upper leg coil shows a slightly higher offset (117.5 Hz).
The SNR in the BFLH with the upper leg coil is more than 45 % higher than in the conventional coil for all SENSE factors and both b-values (p < 0.01). In both coils, there is no statistical SNR difference in the BFLH between the left and right leg (p > 0.15 for all b- and SENSE-values).
Discussion
The channels from the upper leg coil show only a weak noise correlation. Although the separation of the legs in the new upper leg coil leads to an additional air-tissue-border, the frequency offset and variation lies around 100 Hz for both coils. This is less than 1 ppm deviation from the resonance frequency.The higher SNR in the BFLH detected with the new upper leg coil is promising for accelerated diffusion imaging and advanced diffusion modeling. The occurrence of the fat-shift artifact with SENSE acceleration factor 4 will be addressed in future work.
Conclusion
A 64-channel upper leg coil was designed and compared to a conventional coil. The B0 homogeneity of the two coils is comparable. The upper leg coil outperforms the conventional coil in terms of the SNR, which allows for further acceleration with the upper leg coil.Acknowledgements
No acknowledgement found.References
1. Reurink G, Brilman EG, de Vos RJ, et al. Magnetic Resonance Imaging in Acute Hamstring Injury: Can We Provide a Return to Play Prognosis? Sport Med. 2014;45(1):133-146.
2. Orchard J, Best TM. The management of muscle strain injuries: An early return versus the risk of recurrence. In: Clinical Journal of Sport Medicine. Vol 12. ; 2002:3-5.
3. Froeling M, Oudeman J, Strijkers GJ, et al. Muscle changes detected with diffusion-tensor imaging after long-distance running. Radiology. 2015;274(2):548-562.
4. Gudbjartsson H, Patz S. The Rician distribution of noisy MRI data. Magn Reson Med. 1995;34(6):910-914.
5. Pruessmann KP, Weiger M, Scheidegger MB, Boesiger P. SENSE: sensitivity encoding for fast MRI. Magn Reson Med. 1999;42(5):952-962.
Figures