2679
Differentiating ALTs/DDLs from benign lipomas using high-resolution 1H MR Spectroscopy
Santosh K Bharti1, Brett A. Shannon2, Raj Kumar Sharma1, Adam Levin2, Carol Morris2, Laura Fayad2,3, and Zaver M. Bhujwalla1,4,5
1Div. of Cancer Imaging Research, The Russell H. Morgan Dept of Radiology and Radiological Science, The Johns Hopkins University School of Medicine,, Baltimore, MD, United States, 2Department of Orthopaedic Surgery, The Johns Hopkins University School of Medicine, Baltimore, MD, United States, 3Musculoskeletal Radiology, The Russell H. Morgan Department of Radiology and Radiological Science, The Johns Hopkins University School of Medicine, Baltimore, MD, United States, 4Sidney Kimmel Comprehensive Cancer Center, The Johns Hopkins University School of Medicine, Baltimore, MD, United States, 53Radiation Oncology and Molecular Radiation Sciences, The Johns Hopkins University School of Medicine, Baltimore, MD, United States
1Div. of Cancer Imaging Research, The Russell H. Morgan Dept of Radiology and Radiological Science, The Johns Hopkins University School of Medicine,, Baltimore, MD, United States, 2Department of Orthopaedic Surgery, The Johns Hopkins University School of Medicine, Baltimore, MD, United States, 3Musculoskeletal Radiology, The Russell H. Morgan Department of Radiology and Radiological Science, The Johns Hopkins University School of Medicine, Baltimore, MD, United States, 4Sidney Kimmel Comprehensive Cancer Center, The Johns Hopkins University School of Medicine, Baltimore, MD, United States, 53Radiation Oncology and Molecular Radiation Sciences, The Johns Hopkins University School of Medicine, Baltimore, MD, United States
Synopsis
Adipocytic tumors present a spectrum of neoplastic disease including benign lipomas, atypical lipomatous tumors (ALTs), and malignant liposarcomas DDLs. Distinguishing high-grade liposarcomas (DDLs-dedifferentiated liposarcomas) and premalignant ALTs from benign lipomas can be a diagnostic challenge with implications for surgical and clinical management. Our study demonstrate that high-resolution 1H magnetic resonance spectroscopy (MRS) may be used as an additional method for classification and differential diagnosis of ALTs from benign lipomas. Metabolic analysis clearly reflects the metabolic changes associated with malignant progression.
Introduction
Adipocytic tumors present a spectrum of neoplastic disease including benign lipomas, atypical lipomatous tumors (ALTs), and malignant liposarcomas. Liposarcomas are the most common soft tissue sarcoma, accounting for approximately 20% of all adult soft tissue sarcomas [1]. Some liposarcomas are suspected to arise through dedifferentiation of ALTs, a process that is not well understood. Distinguishing high-grade liposarcomas (DDLs) and premalignant ALTs from benign lipomas can be a diagnostic challenge with implications for surgical and clinical management. The rate of misdiagnosis is approximately 30–40% following radiological detection [2], and 7–17% on histological evaluation [3]. A major objective of the present work is to develop metabolic determinants for adipocytic tumor classification and to identify metabolic targets. Our data demonstrate that high-resolution 1H magnetic resonance spectroscopy (MRS) may be used as an additional method for classification and differential diagnosis of DDLs, ALTs and benign lipomas.Methods
De-identified human surgical samples were collected from the Department of Orthopaedic Surgery, The Johns Hopkins University School of Medicine Baltimore, MD. Tissue specimens from benign lipoma (n=10), ALTs (n=8), dedifferentiated liposarcoma (n=5) and adjacent non-involved fat (n=8, normal fat) were examined using 1H MRS. Tissue samples were snap frozen and stored at -80°C until 1H MRS analysis. Dual phase solvent extraction was performed on approximately 300 mg of tumor tissue. The water phase was separated, freeze-dried, and reconstituted in 600ul D2O PBS for MRS analysis. All MR spectra were acquired on an Avance III 750 MHz (17.6T) Bruker NMR spectrometerResults & Discussion
Representative spectra obtained from 1H MRS of water phase tumor samples are shown in Figures 1. The metabolic heatmap (Figure 2) clearly identified the different metabolic patterns of ALTs and DDLs compared to normal fat and benign lipoma. These results provide new insights into the metabolic differences between benign, premalignant and malignant tissue that may be exploited for differential diagnosis and for metabolism based therapeutic strategies. Computational modeling of pattern recognition based cluster analysis on large training data set may provide a useful companion diagnostic tool for differentiating ALTs/DDLs from benign lipomas. A significant increase in lactate levels was observed in ALTs/DDLs compared to lipomas and normal fat. Lactate, glucose and formate were found significantly high in DDLs as compared to ALTs, lipomas and normal fat as well. Although lactate is a non-specific biomarker, it has been used to grade tumors subtypes in several cancers [4, 5]. Glutamine, aspartate, taurine, were significantly higher in ATLs/DDLs as compared to normal fat. We are currently analyzing additional samples from lipomas, ALTs, and dedifferentiated liposarcomas (DDls) to expand this study. Our preliminary data support investigating the use of 1H MRS of liposarcomas for differentiation between subtypes, and to understand malignant progression.Acknowledgements
This work was supported by NIH R35CA209960.References
1.Dei Tos AP: Liposarcomas: diagnostic pitfalls and new insights. Histopathology 2014, 64(1):38-52. 2.Brisson M, Kashima T et al: MRI characteristics of lipoma and atypical lipomatous tumor/well-differentiated liposarcoma: retrospective comparison with histology and MDM2 gene amplification. Skeletal Radiology 2013, 42(5):635-647. 3.Hasegawa T, Yamamoto S et al: Validity and reproducibility of histologic diagnosis and grading for adult soft-tissue sarcomas. Human Pathology 2002, 33(1):111-115. 4.Astrakas LG, Zurakowski D et al: Noninvasive Magnetic Resonance Spectroscopic Imaging Biomarkers to Predict the Clinical Grade of Pediatric Brain Tumors. Clinical Cancer Research 2004, 10(24):8220-8228. 5.Walenta S, Wetterling M et al: High Lactate Levels Predict Likelihood of Metastases, Tumor Recurrence, and Restricted Patient Survival in Human Cervical Cancers. Cancer Research 2000, 60(4):916-921.Figures
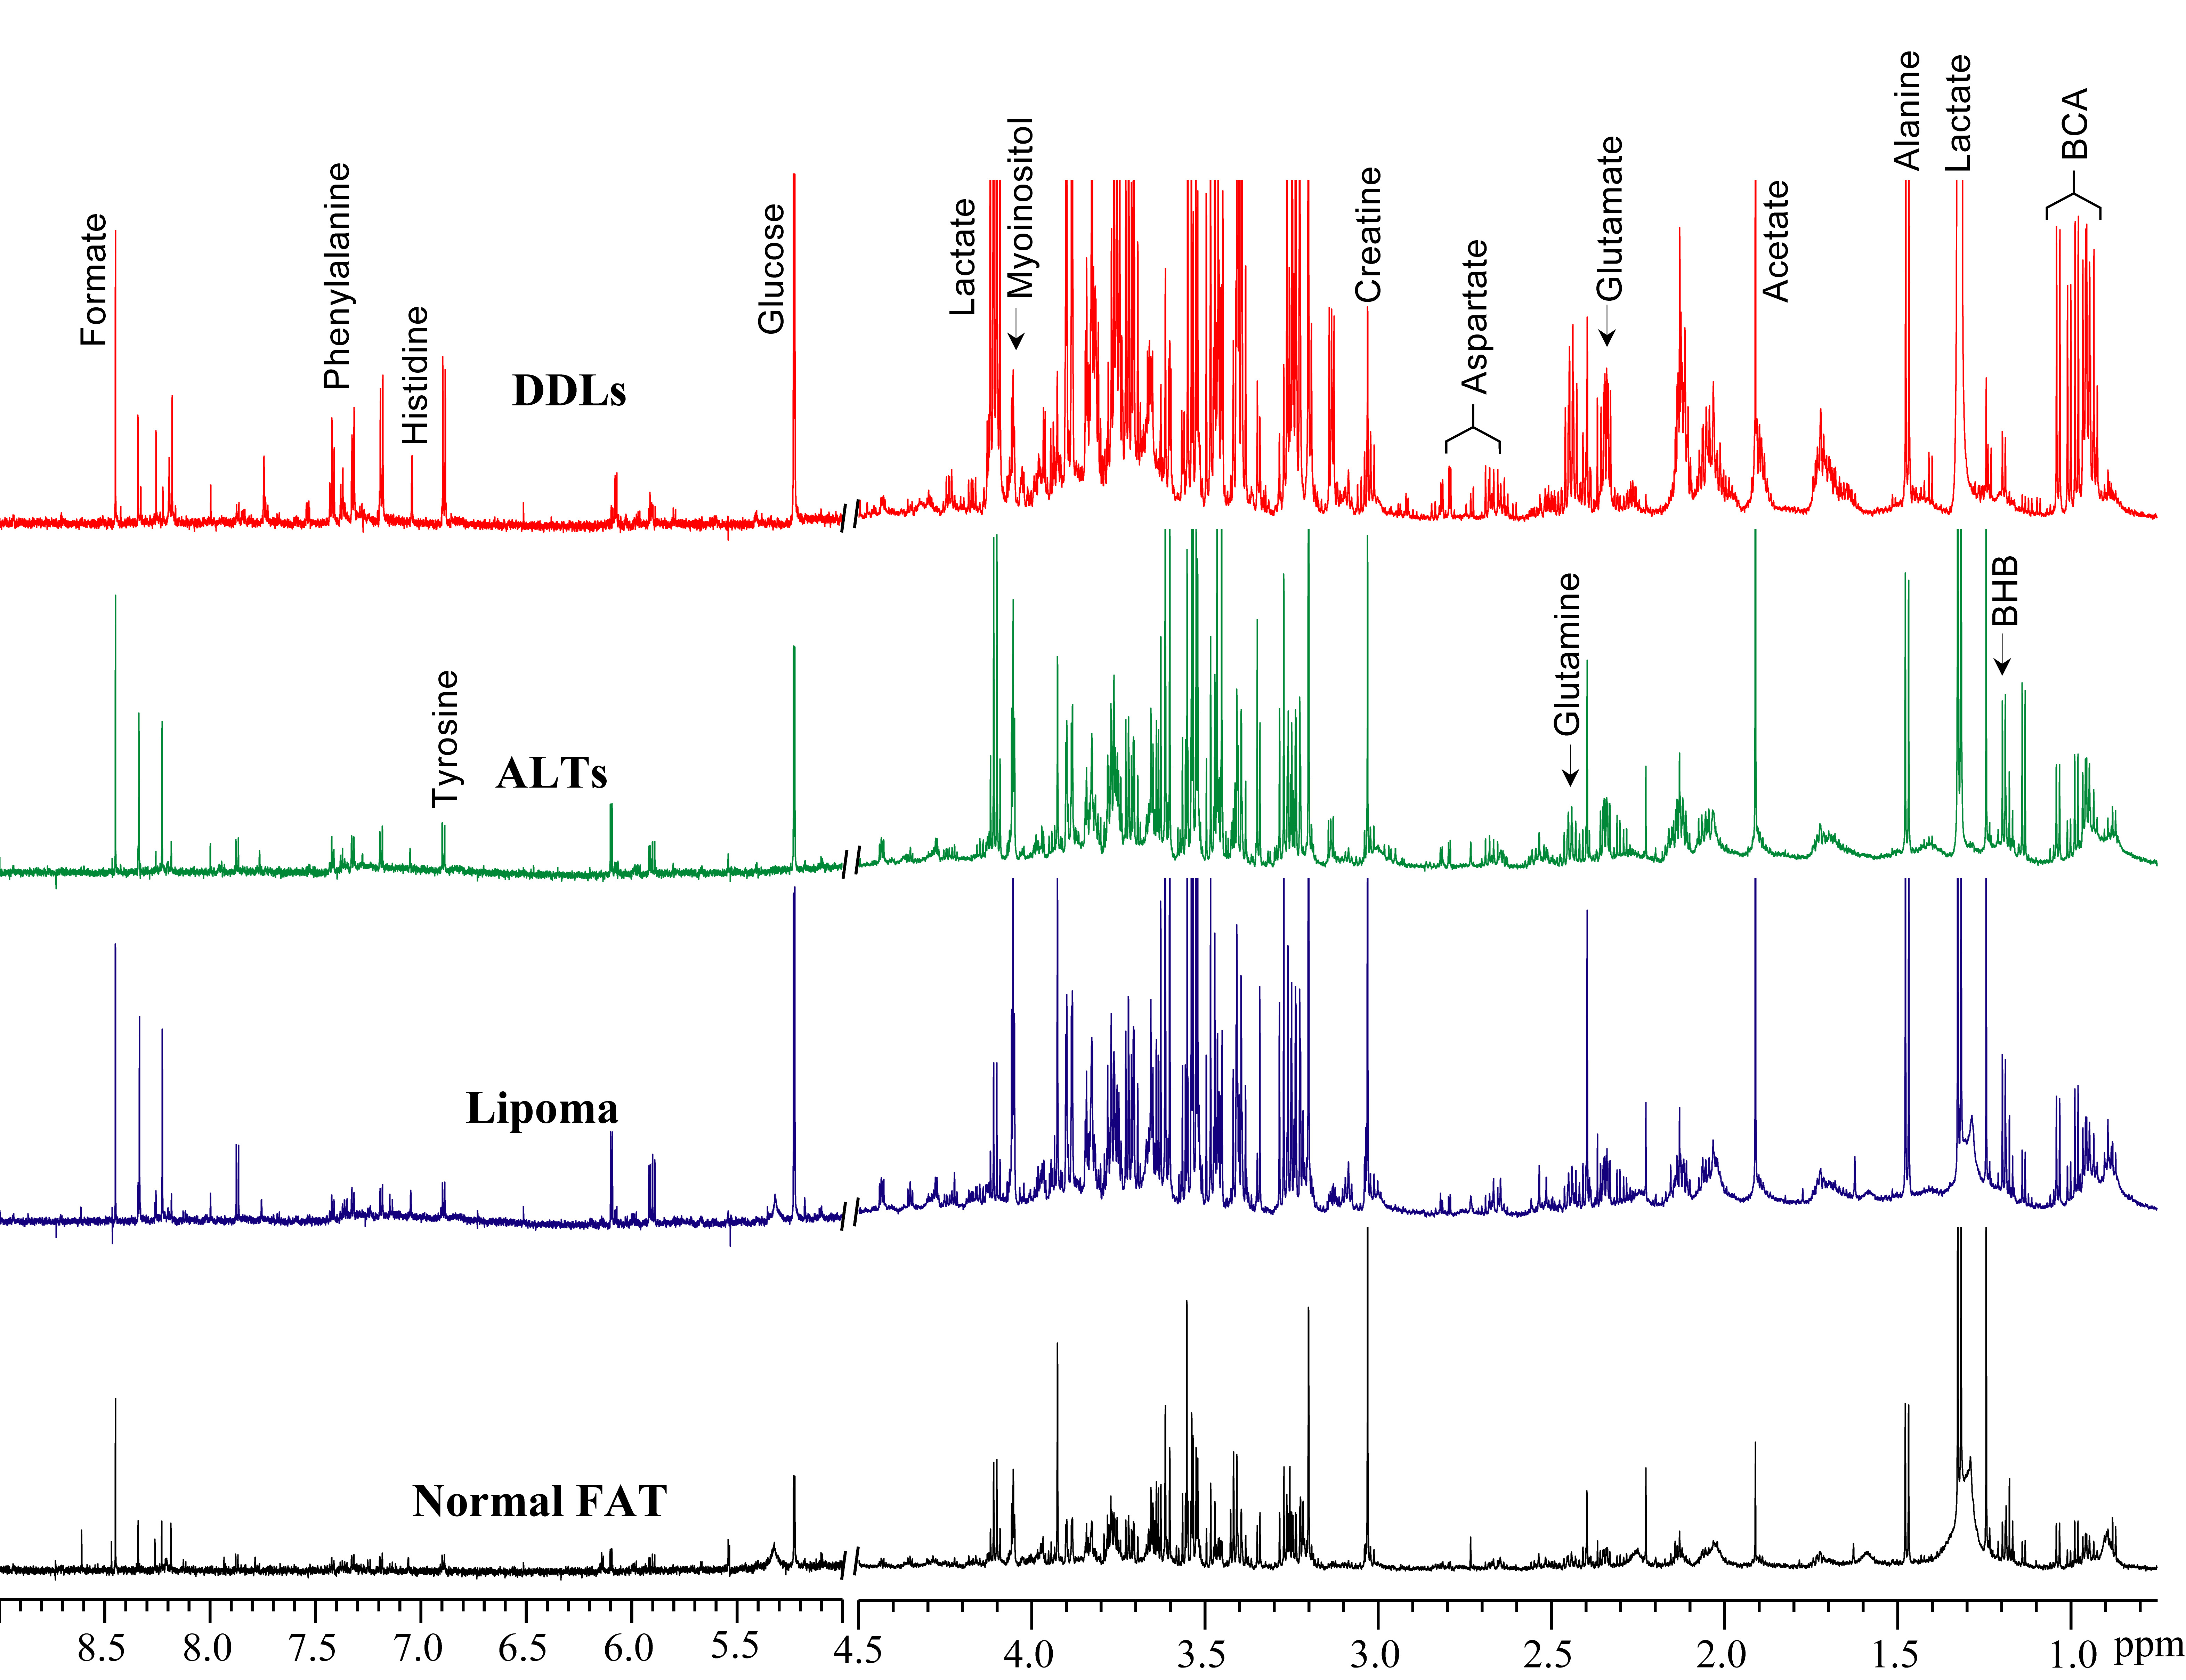
Figure 1: Representative
1H MRS obtained from water soluble extract from Normal FAT (Black),
benign Lipoma (Blue), premalignant atypical
lipomatous tumors (ALTs, Green) and dedifferentiated malignant liposarcomas (DDLs,
Red).
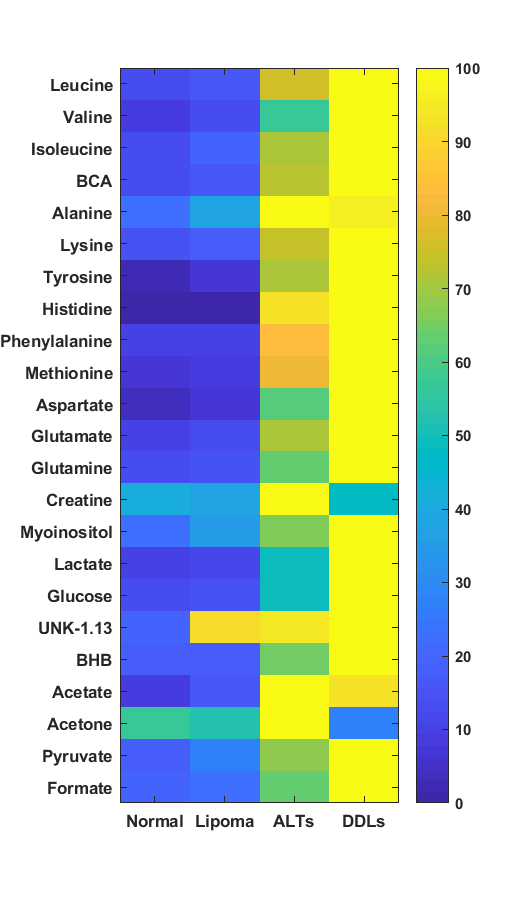
Figure 2: Metabolic
heat maps representing the average of metabolites in adjacent non-involved fat
(n=8, normal fat), benign lipoma (n=10), premalignant lipoma ALTs (n=8), dedifferentiated
liposarcoma (n=5). Heatmap clearly represent the metabolic changes associated
with malignant progression.