2678
A Comparison study between IVIM-DWI and DCE-MRI derived parameters in rabbit VX2 bone tumor model
Tian Yang1, Changjun Liu1, Xiang Feng2, Mengxiao Liu3, Fu He1, Xiaoli Li1, Ruizhi Zhou1, and Wenjian Xu1
1Department of Radiology, the Affiliated Hospital of Qingdao University, Qingdao, China, 2MR Scientific Marketing, Siemens Healthcare, Beijing, China, 3MR Scientific Marketing, Siemens Healthcare, Shanghai, China
1Department of Radiology, the Affiliated Hospital of Qingdao University, Qingdao, China, 2MR Scientific Marketing, Siemens Healthcare, Beijing, China, 3MR Scientific Marketing, Siemens Healthcare, Shanghai, China
Synopsis
The aim of this study was to evaluate the diagnostic efficiency of the parameters of DCE-MRI and IVIM-DWI between solid area of tumor and normal bone marrow in the model of rabbit VX2 bone tumor. The results showed that DCE-DWI and IVIM-DWI were equally important in the differential diagnosis in the solid area of tumor and normal bone marrow.
Introduction
In recent years, functional evaluation of micro-hemodynamic information of tumor tissue and the proliferation of tumor cells at the molecular level becomes a research hotspot of MR imaging in tumor 1-4. Dynamic contrast-enhanced magnetic resonance imaging (DCE-MRI) quantitatively evaluates the changes of blood perfusion and permeability, and improves the diagnosis rate of malignant bone tumors 3,5. By separating the blood perfusion and water molecule diffusion of the tissue, IVIM-DWI can be used to describe the characteristics of the tissue with the bi-exponential model, which provides a new perspective for the diagnosis of malignant bone tumors 5. The purpose of this study was to investigate and compare the diagnostic efficiency between IVIM-DWI and DCE-MRI in VX2 malignant bone tumors using a rabbit model.Material and Methods
All animal operations were carried out with the approval of the animal ethics committee of our hospital. 25 rabbits were included in this experiment. VX2 tumor cells were transplanted into the tibia of healthy rabbits to establish the model of VX2 malignant bone tumor. After two weeks, all rabbits underwent MRI scans at a 3T scanner (MAGNETOM Prisma, Siemens Healthcare, Erlangen, Germany) with a customized 8-channel rabbit coil. Conventional MRI sequences were used for morphology depiction, included a sagittal T1W TSE (TR = 737ms, TE = 22ms), TIRM for fat suppression (TR = 3200ms, TE = 44ms, TI = 230 ms), T2W TSE (TR = 3000ms, TE = 96ms), all with the identical parameters of FOV = 160 mm × 160 mm, matrix 320 × 320, slice thickness = 3mm, slice gap = 1mm, 4 averages for sufficient SNR. The scanning range was covered from the right distal femur to the ankle level. The sagittal Flash sequence was scanned with the parameters of TR = 3000 ms, TE = 66 ms, 4 averages, FOV = 160 mm × 160 mm, matrix size = 320 × 320, slice thickness = 3 mm. Prior to DCE scanning, a GRE sequence with three flip angles (FA) of 8 °, 10 °, and 12 °, was scanned. In DCE, Gd-DTPA (Bayer Healthcare, Schering, Germany) and saline were injected with the flow rate of 0.5ml/s. A total of 50 phases was scanned, and the acquisition time was 3 min 35 sec. IVIM-DWI sequence was performed with the following parameters of slice thickness = 3mm, slice gap = 1mm, TR = 3000 ms, TE = 50 ms, FOV = 170 mm×170 mm, 12 b values applied with 0, 20, 40, 60, 80, 100, 150, 200, 400, 600, 800, 1000 sec/mm2, 4 averages.For quantitative image analysis, the measurement indices include: (1) Quantitative parameters of IVIM-DWI: apparent diffusion coefficient (ADC), slow diffusion coefficient (D), fast diffusion coefficient (D*) and perfusion fraction ( f ); (2) Quantitative parameters of DCE-MRI: Ktrans, Kep and Ve. The Extended Tofts Model was used to fit the time concentration signal curve. The maps of Ktrans, Kep, Ve were obtained on the vendor’s post-processing workstation. The average values were obtained after three times of measurement. ROIs were manually drawn using the following criteria: taking T2WI as the morphological reference of tumor, at the same time, drawing the ROIs at the fused image of DWI at b = 800 sec/mm2; in the sagittal plane of tumor tissue, covering the maximum of tumor tissue, minimizing the surrounding normal tissue and avoiding the necrotic area. ROIs for the normal bone marrow on the T2WI image were also drawn with similar size. The ROIs of IVIM-DWI sequence and DCE-MRI sequence should be consistent as much as possible.
Statistical analysis was performed using SPSS (version 21.0, IBM Corp., Armonk, NY, USA). The t-test for two independent samples was used to analyze the difference between two groups of parameters; AUC of ROC curve was used to evaluate the diagnostic accuracy of DCE-MRI and IVIM-DWI parameters for distinguishing tumor tissue from normal bone marrow tissue; Pearson correlation was used to analyze the correlation of DCE and IVIM derived parameters. P<0.05 was considered to indicate a statistically significant difference.
Result
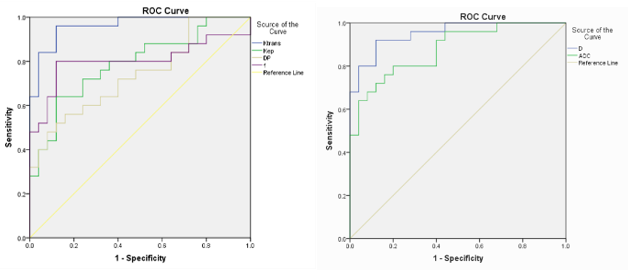
Ktrans, Kep, D * and f values in solid area of tumor were significantly higher than those in normal bone marrow( 0.35±0.10 vs 0.20±0.08, P<0.01; 1.53±0.76 vs 0.78±0.10, P<0.01; 74.37±21.94 vs 55.74±14.91, P<0.01; 64.57±27.73 vs 40.44±9.25, P<0.01, respectively) , and D and ADC values were significantly lower than those in normal bone marrow ( 673.98±9.79 vs 879.21±110.34, P<0.01; 728.83±84.92 vs 902.36±226.60, P<0.01, respectively) . There were no statistical differences in Ve values. Ktrans and D values were superior to other parameters in the differential diagnosis in solid area of tumor and normal bone marrow, with the highest AUC values of 0.957 and 0.952 (cutoff values were = 0.2467, 738.3833), respectively (Fig.1). There was a moderate positive correlation between Ktrans and DP (r = 0.496, P < 0.05). D values were positively correlated with ADC values (r = 0.888, P < 0.01). Figures 2 shows image examples from one VX2 malignant bone tumor model rabbit.Discussion and Conclusion
Our study shows that DCE-DWI and IVIM-DWI are equally important in the differential diagnosis in solid area of tumor and normal bone marrow, suggests the combination of the two can improve the accuracy of diagnosis.Acknowledgements
First and foremost, I would like to show my deepest gratitude to my supervisor, Dr. Wenjian Xu, a respectable, responsible and resourceful scholar, who has provided me with valuable guidance in every stage of the writing of this thesis. Without his enlightening instruction, impressive kindness and patience, I could not have completed my thesis. His keen and vigorous academic observation enlightens me not only in this thesis but also in my future study. I shall extend my thanks to Mr. Xu for all his kindness and help. I would also like to thank all my teachers who have helped me to develop the fundamental and essential academic competence. My sincere appreciation also goes to the teachers and students from the Affiliated Hospital of Qingdao University, who participated this study with great cooperation. Last but not least, I' d like to thank all my friends, especially my two lovely roommates, for their encouragement and support.References
[1] Natsuhiko S, Kazuhiro S, Katsutoshi S, et al. Intravoxel incoherent motion MRI as a biomarker of sorafenib treatment for advanced hepatocellular carcinoma: a pilot study. Cancer Imaging. 2016 ; 16(1) :1 . [2] Wu L , Li J , Fu C , et al. Chemotherapy response of pancreatic cancer by diffusion-weighted imaging (DWI) and intravoxel incoherent motion DWI (IVIM-DWI) in an orthotopic mouse model. Magnetic Resonance Materials in Physics, Biology and Medicine. 2019. [3] Meng X X , Zhang Y Q , Liao H Q , et al. Dynamic contrast-enhanced MRI for the assessment of spinal tumor vascularity: correlation with angiography[J]. European Spine Journal. 2016, 25(12):3952-3961. [4] Marco A, Melvin D’Anastasi, Veronika H, et al. Improved detection of a tumorous involvement of the mesorectal fascia and locoregional lymph nodes in locally advanced rectal cancer using DCE-MRI. International Journal of Colorectal Disease. 2018; 33(7) :901-909. [5] Camille Bourillon, Alain Rahmouni, Chieh Lin, et al. Intravoxel incoherent Motion Diffusion-weighted imaging of Multiple Myeloma lesions: Correlation with Whole-Body Dynamic Contrast Agent–enhanced MR Imaging. Radiology. 2015: 141728Figures
Figure
1: The receiver operating characteristic (ROC) curve analyses were calculated
to characterize each parameter in terms of its value in
the differential
diagnosis of in solid area of tumor and normal bone marrow.
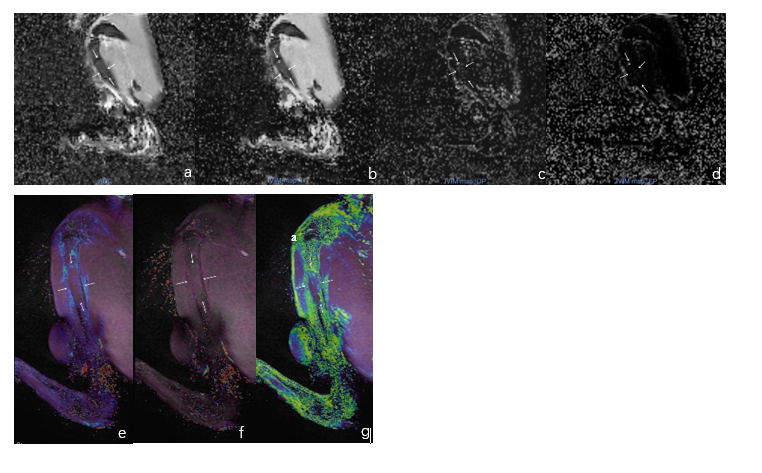
Figure 2 : Images of VX2 malignant bone tumor
model rabbit. (a-d) are IVIM-DWI post processing images, including ADC map(a) ,
D map(b) , D* map(c) , and f map(d) . (e-g) are DCE-MRI post processing images,
including Ktrans map(e) , Kep map(f) , and Ve map(g) .