2675
Short-term repeatability of magnetic resonance fingerprinting for T1 and T2 measurements of metastatic bone lesions in prostate cancer patients
Matthew R Orton1, Mihaela Rata2, Nina Tunariu2, Andra Curcean2, Julie Hughes2, Erica Scurr2, James D'arcy1, Matthew D Blackledge1, and Dow-Mu Koh2
1Division of Radiotherapy and Imaging, Institute of Cancer Research, Sutton, United Kingdom, 2Department of Radiology, Royal Marsden NHS Foundation Trust, Sutton, United Kingdom
1Division of Radiotherapy and Imaging, Institute of Cancer Research, Sutton, United Kingdom, 2Department of Radiology, Royal Marsden NHS Foundation Trust, Sutton, United Kingdom
Synopsis
Accurate characterisation of bone metastases and their response to treatment remains an unmet need in oncology. Magnetic resonance fingerprinting (MRF) is an imaging technique that yields inherently co-registered quantitative images from a single acquisition, so this work aims to evaluate measurement repeatability of MRF when measuring T1 and T2 relaxation times in metastatic bone disease. We found good measurement repeatability of 6% for lesion mean T1 and 23% for lesion mean T2.
Background
Magnetic resonance fingerprinting (MRF) is an imaging technique that yields inherently co-registered quantitative images from a single acquisition1. Evaluations of its application in a number of soft-tissue oncology settings are ongoing, but there is also potential in using this technology to better characterise metastatic bone disease, since accurate characterisation of bone disease and its response to treatment remains an unmet need in oncology. In quantitative imaging, whilst absolute accuracy remains the gold-standard performance criterion, measurement repeatability is also of major interest when assessing the utility of such measures in clinical practice.Aim
To evaluate the repeatability of MRF-derived T1 and T2 relaxation times in metastatic bone disease in patients with primary prostate cancer.Methods
All imaging was performed on a 1.5T MAGNETOM Aera (Siemens Healthineers, Erlangen, Germany) according to an ethics and research board approved protocol. In an ongoing study, nine prostate cancer patients (mean age 69.8 years, range 58-83 years) were imaged using a prototype MRF-FISP sequence2 with Gadgetron reconstruction3 which yields maps of T1 and T2 relaxation times, and the proton density M0. To aid lesion localisation, diffusion-weighted images (DWI) and T1-weighted Dixon images were also acquired using the sequences described in Table 1. MRF acquisitions were performed twice, between which the patients were removed from the scanning table and allowed to relax before being returned to the table. Care was taken to match the patient and pelvic coil positioning for the second scan as closely as possible to the first scan. Five contiguous 5mm thick slices were positioned over the pelvis to include lesions that appeared hyper-intense on high b-values images and hypo-intense on the post-processed relative fat-fraction Dixon images. Volumetric regions of interest (ROIs) were drawn for multiple lesions per patient on the MRF M0 image, using the DWI and relative fat-fraction Dixon images as a visual guide. ROIs drawn on the first MRF scan were copied to the second scan and manually adjusted to accommodate any changes in pose and position. Contours were drawn using Horos (Horosproject.org), saved as DICOM-RT structure sets using a pyOsiriX plugin4, and image statistics were obtained using MATLAB (R2019a The MathWorks, Inc.). The following lesion statistics were computed from the voxel values in each lesion: mean, median, standard deviation, first quartile (Q1), third quartile (Q3) skewness and kurtosis. Repeatability was visually assessed with Bland-Altman plots, and statistically measured using the repeatability coefficient (r), and intra-class correlation (ICC). In addition, the cohort mean across all lesions of each statistic was recorded, from which a relative repeatability coefficient can be derived using r% = r/(cohort mean)×100%. The between-lesion (sB) and within-lesion (sW) standard deviations were recorded separately, from which ICC = sB2/(sB2+sW2).Results
The median number of lesions studied per patient was 2 (range 1-7), and the median lesion volume was 1106 ml (range 171 – 11,976 ml). The smallest lesion was visibly impacted by partial volume effects, and so was excluded from the repeatability analysis, giving a total of 26 lesions. Figure 1 shows a single slice from an example patient with three lesions. Repeatability statistics for all lesion statistics are detailed in Table 2. The following discussion focusses on r% and ICC as these are dimensionless quantities, but for completeness, all relevant statistics are included in Table 2. The Bland-Altman plots for the mean lesion statistics are shown in Figure 2. Also included in these plots are points corresponding to the mean voxel value per patient, i.e. averaged across all lesions per patient.Discussion
The relative repeatability (r%) of T1 mean is 6.22%, T2 mean is 22.8% and M0 mean is 18.0%, implying that proportional changes less than these values can be attributed to measurement error, while excess changes are likely to be treatment related. The corresponding ICCs are 0.95, 0.88 and 0.87, and taken with r%, these statistics indicate that T1 mean statistics are more repeatable than both T2 and M05. A similar MRF repeatability study in brain6 also reported better repeatability for T1 than T2 (3.4% and 8.0%), although the proportional increase in T2 r% compared to T1 r% observed here is larger than that reported in the brain. For T2 and M0, the lesion statistics std, Q1 and Q3 maintain similar r% and ICC to the mean, although for skewness and kurtosis the repeatability tends to be degraded. For T1, r% for lesion standard deviation is around three times larger than for the lesion mean, implying that assessment of T1 heterogeneity is more prone to measurement variations than mean T1. The Bland-Altman plots indicate that the repeat measures differences and cohort variations are well behaved, and both sources of variation are smaller when the mean value per patient is considered.Conclusions
Repeatability of T1, T2 and M0 measurements in metastatic prostate cancer bone disease are in line with, but somewhat larger than those previously reported in phantom5 and brain studies6. Further work is ongoing to assess the magnitude of treatment related changes in T1 and T2 that occur in bone metastases compared with the repeatability limits reported here.Acknowledgements
The MRF sequence used in this work was provided by Prof Vikas Gulani (University of Michigan) and Prof Mark Griswold (Case Western Reserve University), with additional support from Dr Yun Jiang. We acknowledge NHS funding to the NIHR Biomedical Research Centre and the Clinical Research Facility. This study represents independent research part funded by the National Institute for Health Research (NIHR) Biomedical Research Centre at the Royal Marsden NHS Foundation Trust and the Institute of Cancer Research. The views expressed are those of the author(s) and not necessarily those of the NHS, the NIHR or the Department of Health.References
- Ma D, et al., Magnetic resonance fingerprinting. Nature. 2013 14;495(7440):187–192.
- Jiang Y, et al. MR Fingerprinting Using Fast Imaging with Steady State Precession (FISP) with Spiral Readout, Magn. Reson. Med. 2015;74(6):1621-1631.
- Lo W-C, et al. MR Fingerprinting using a Gadgetron-based reconstruction, Proc. ISMRM 2018, #3525.
- Blackledge MD, et al., Rapid development of image analysis research tools: Bridging the gap between researcher and clinician with pyOsiriX. Comput Biol Med. 2016;69:203-12.
- Jiang Y, et al., Repeatability of magnetic resonance fingerprinting T1 and T2 estimates assessed using the ISMRM/NIST MRI system phantom. Magn Reson Med. 2017 78(4):1452-1457.
- Körzdörfer G, et al., Reproducibility and Repeatability of MR Fingerprinting Relaxometry in the Human Brain. Radiology. 2019 Aug;292(2):429-437.
Figures
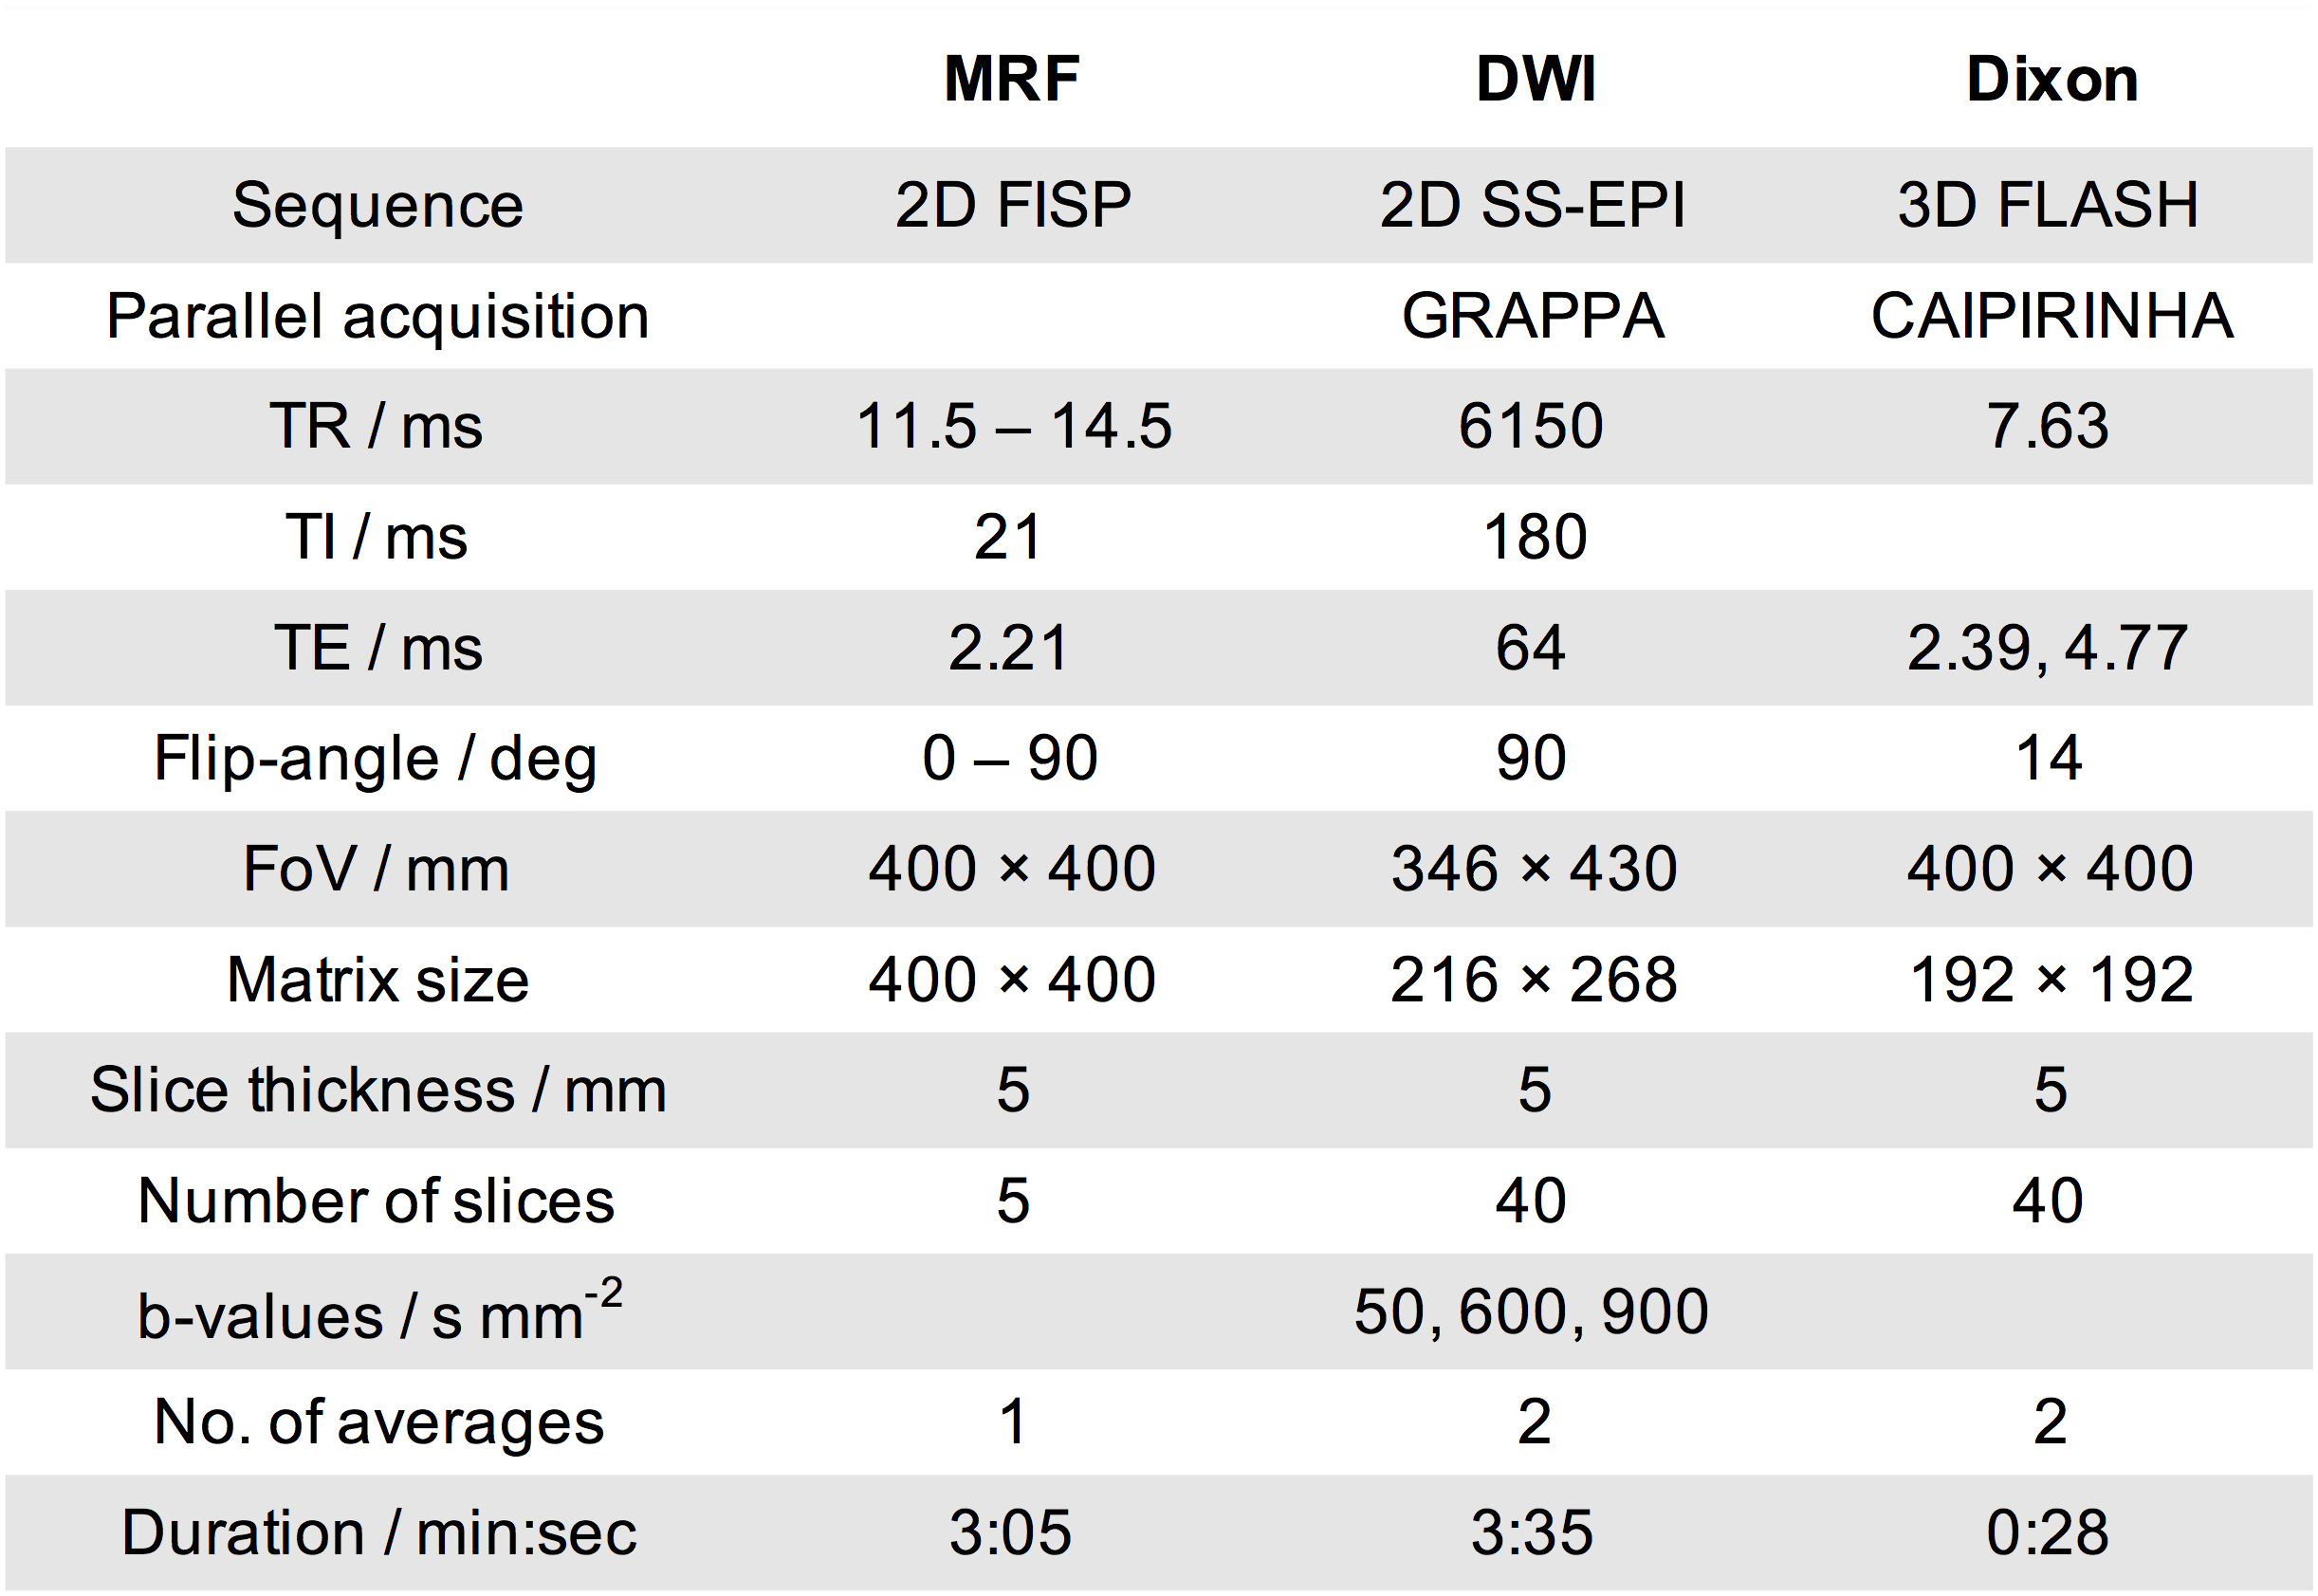
Table 1:
Details of the sequences used in this study.
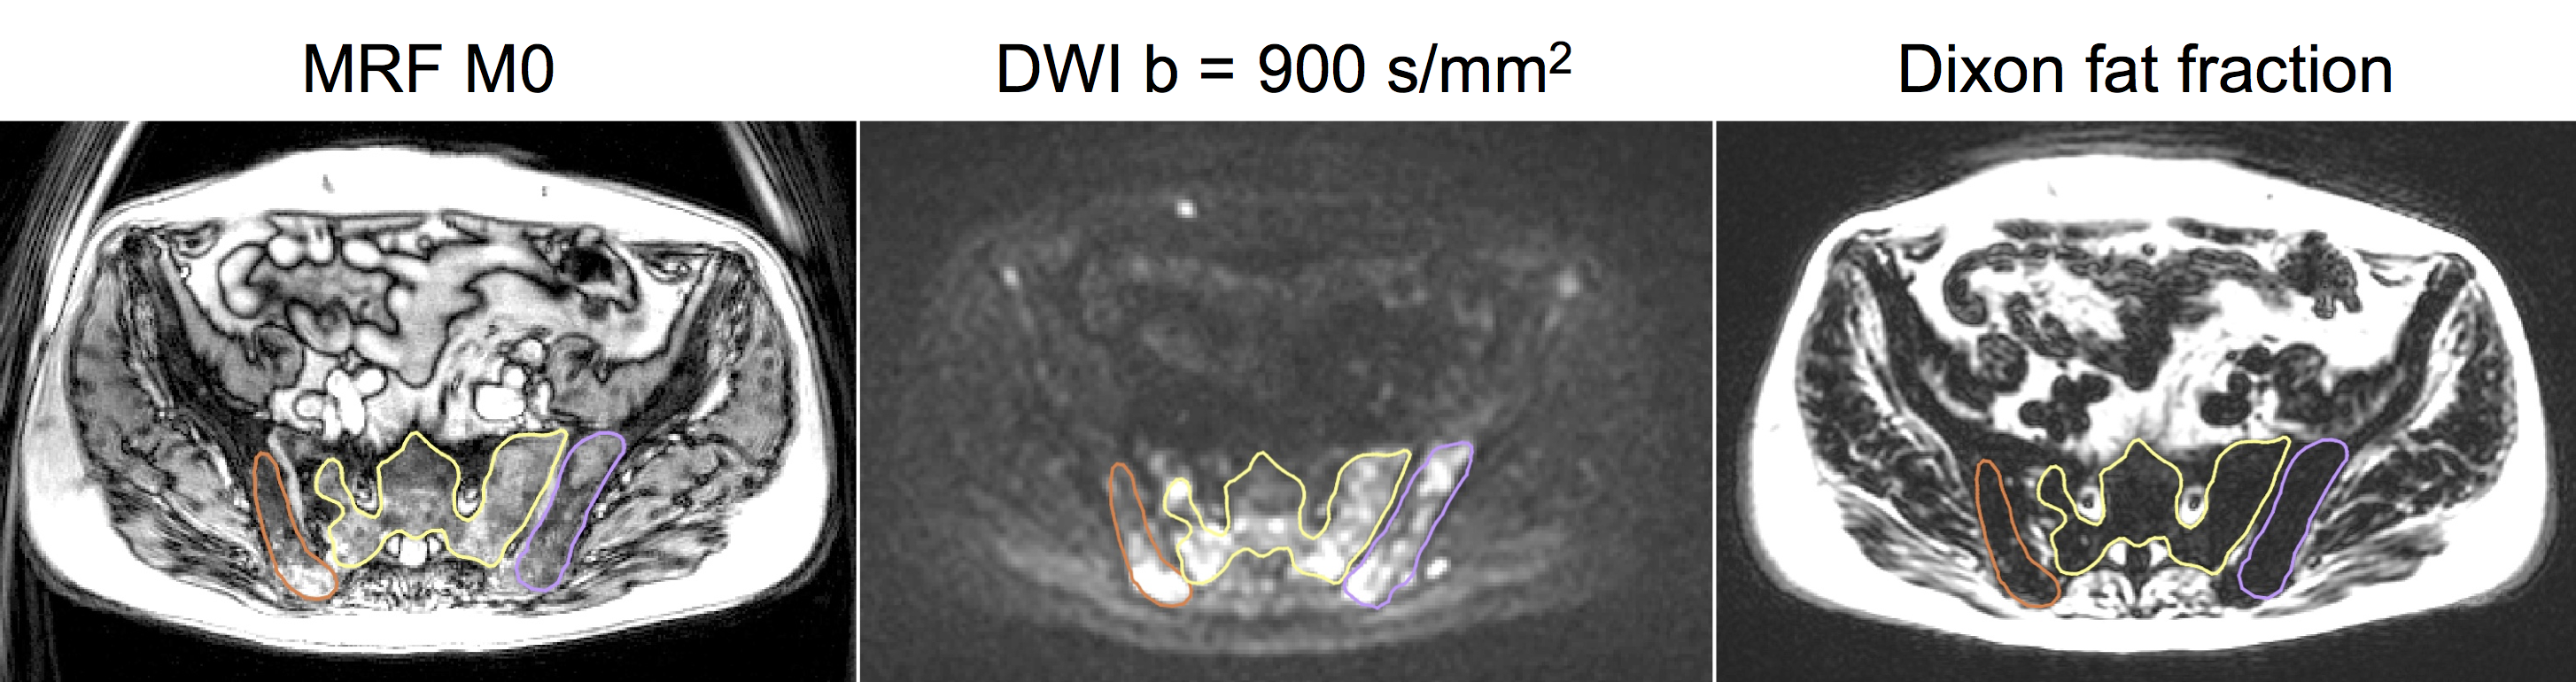
Figure 1:
Example images with three lesions contoured.
Contours are drawn on the MRF M0 image and were transferred to the DWI
and Dixon fat fraction image for visual reference.
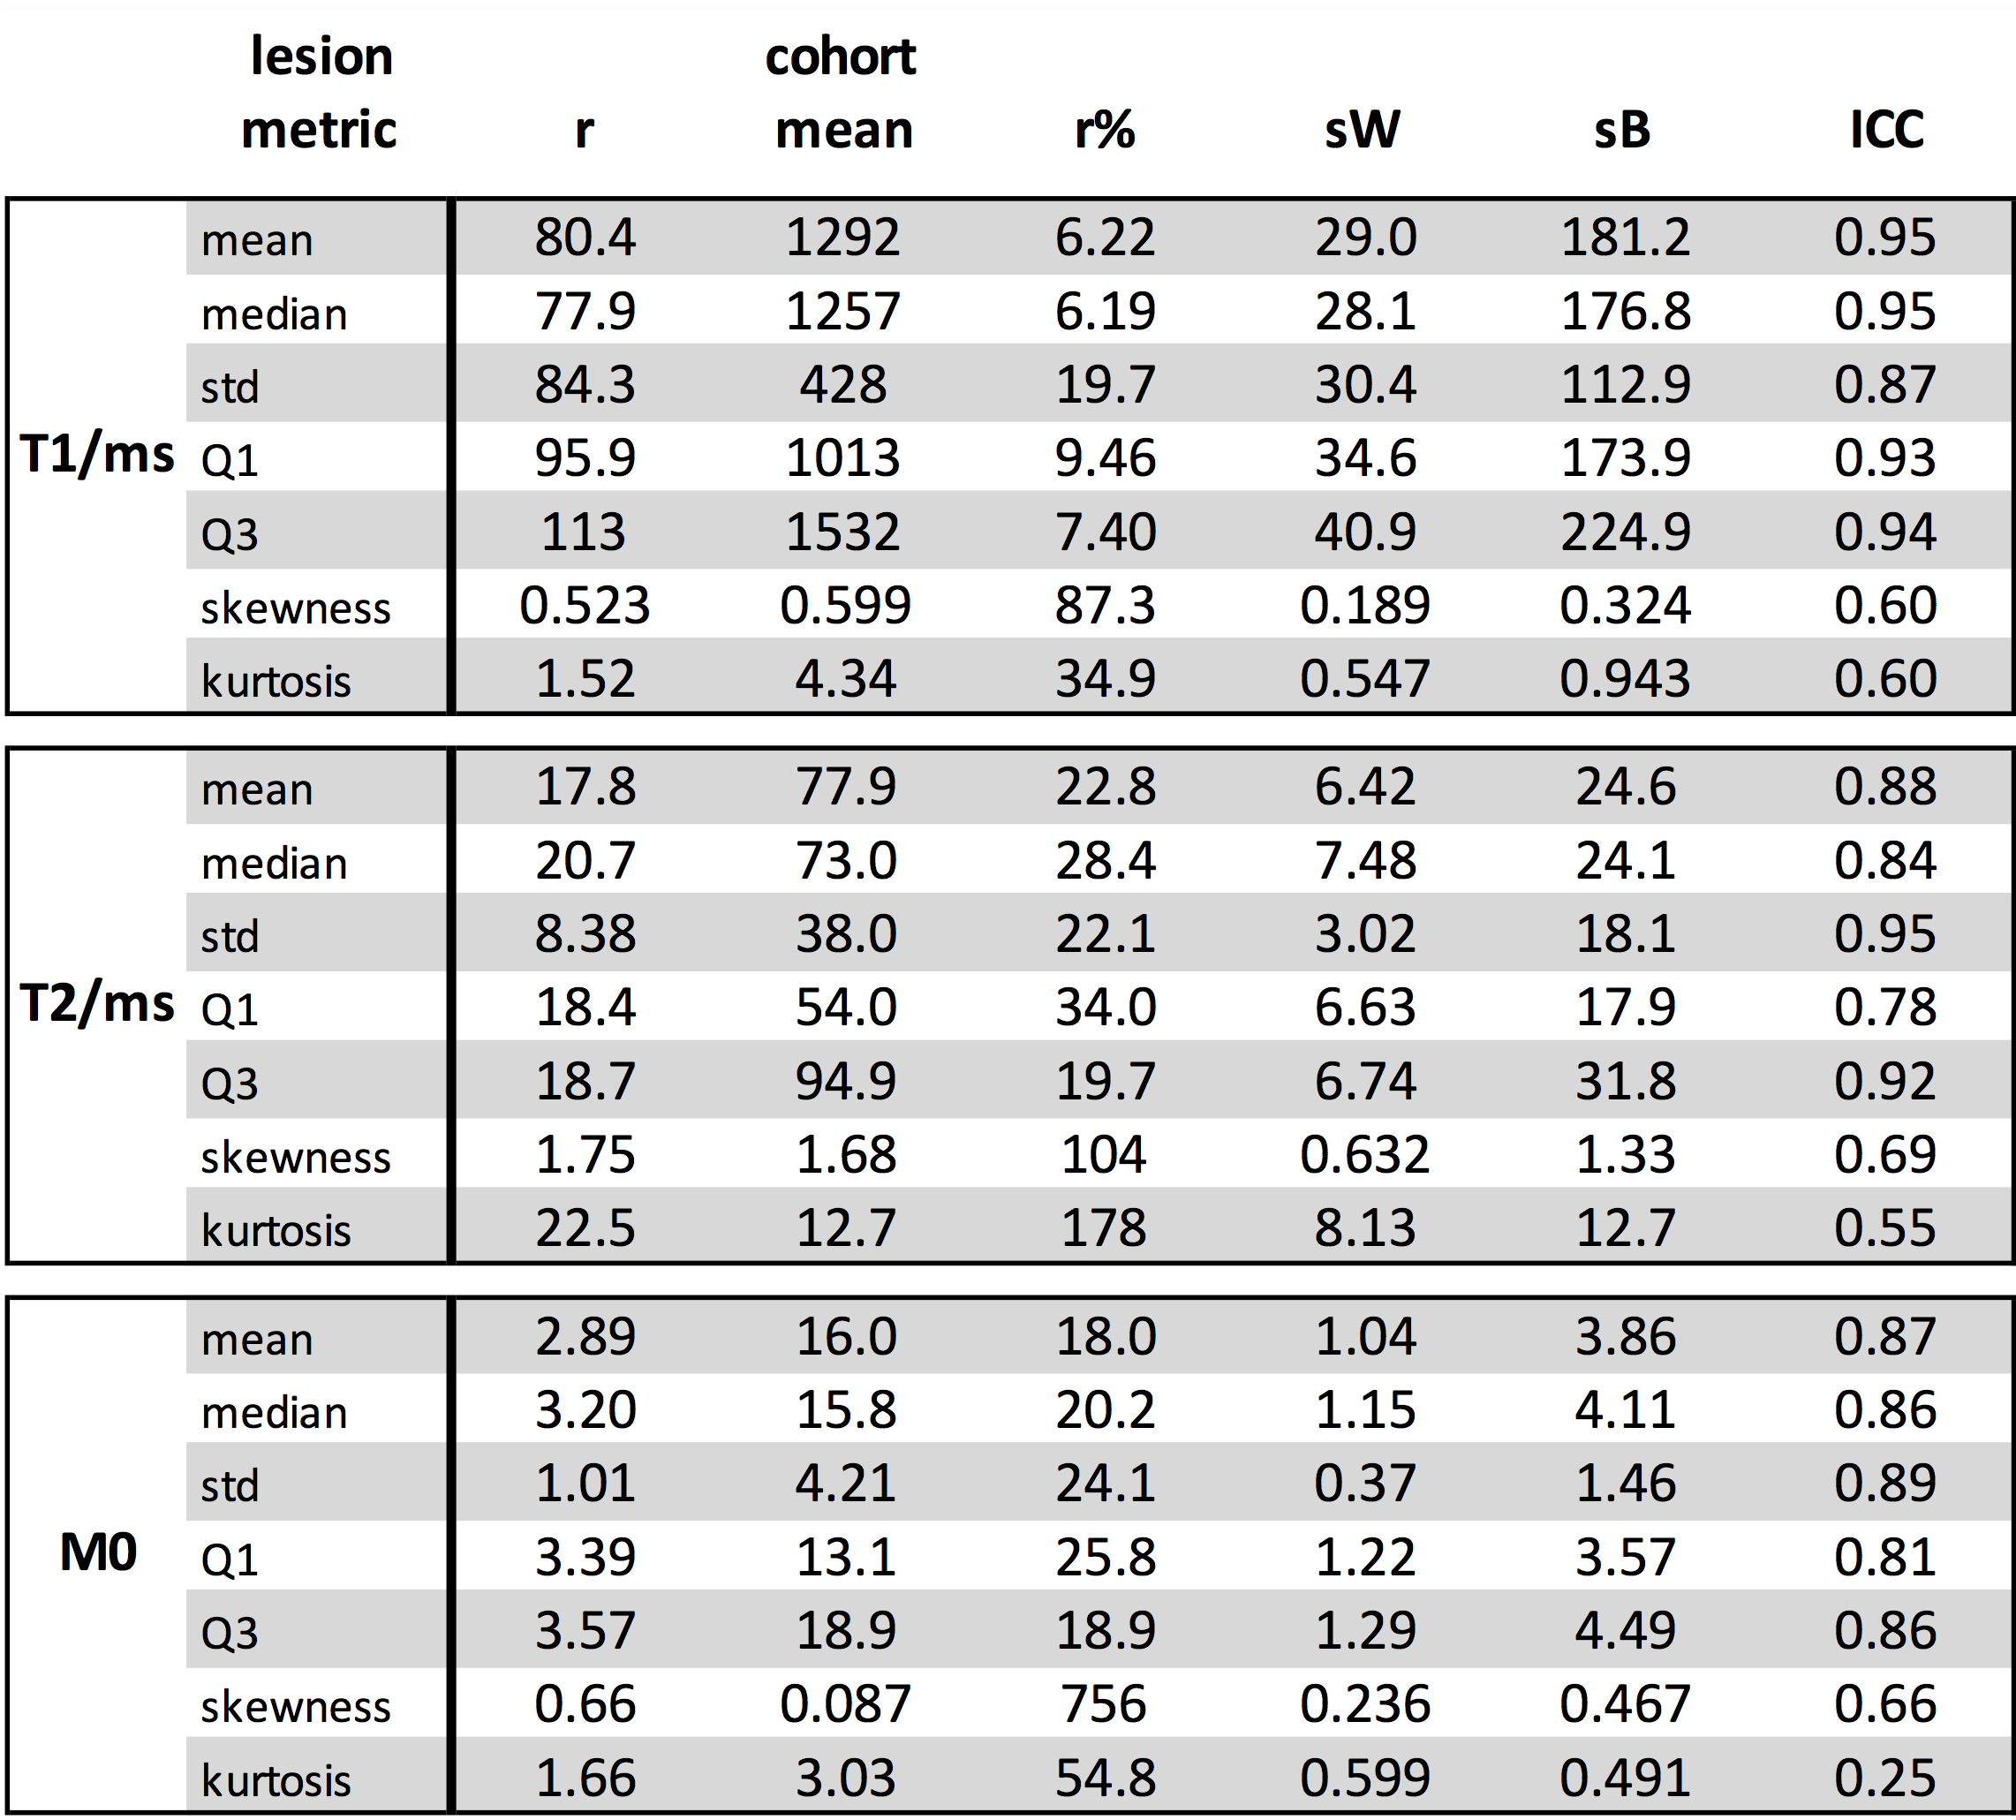
Table 2:
Repeatability statistics for T1, T2 and M0 statistics. Units are ms for T1 and T2, M0 has no units, and
in all cases skewness, kurtosis, r% and ICC are dimensionless.
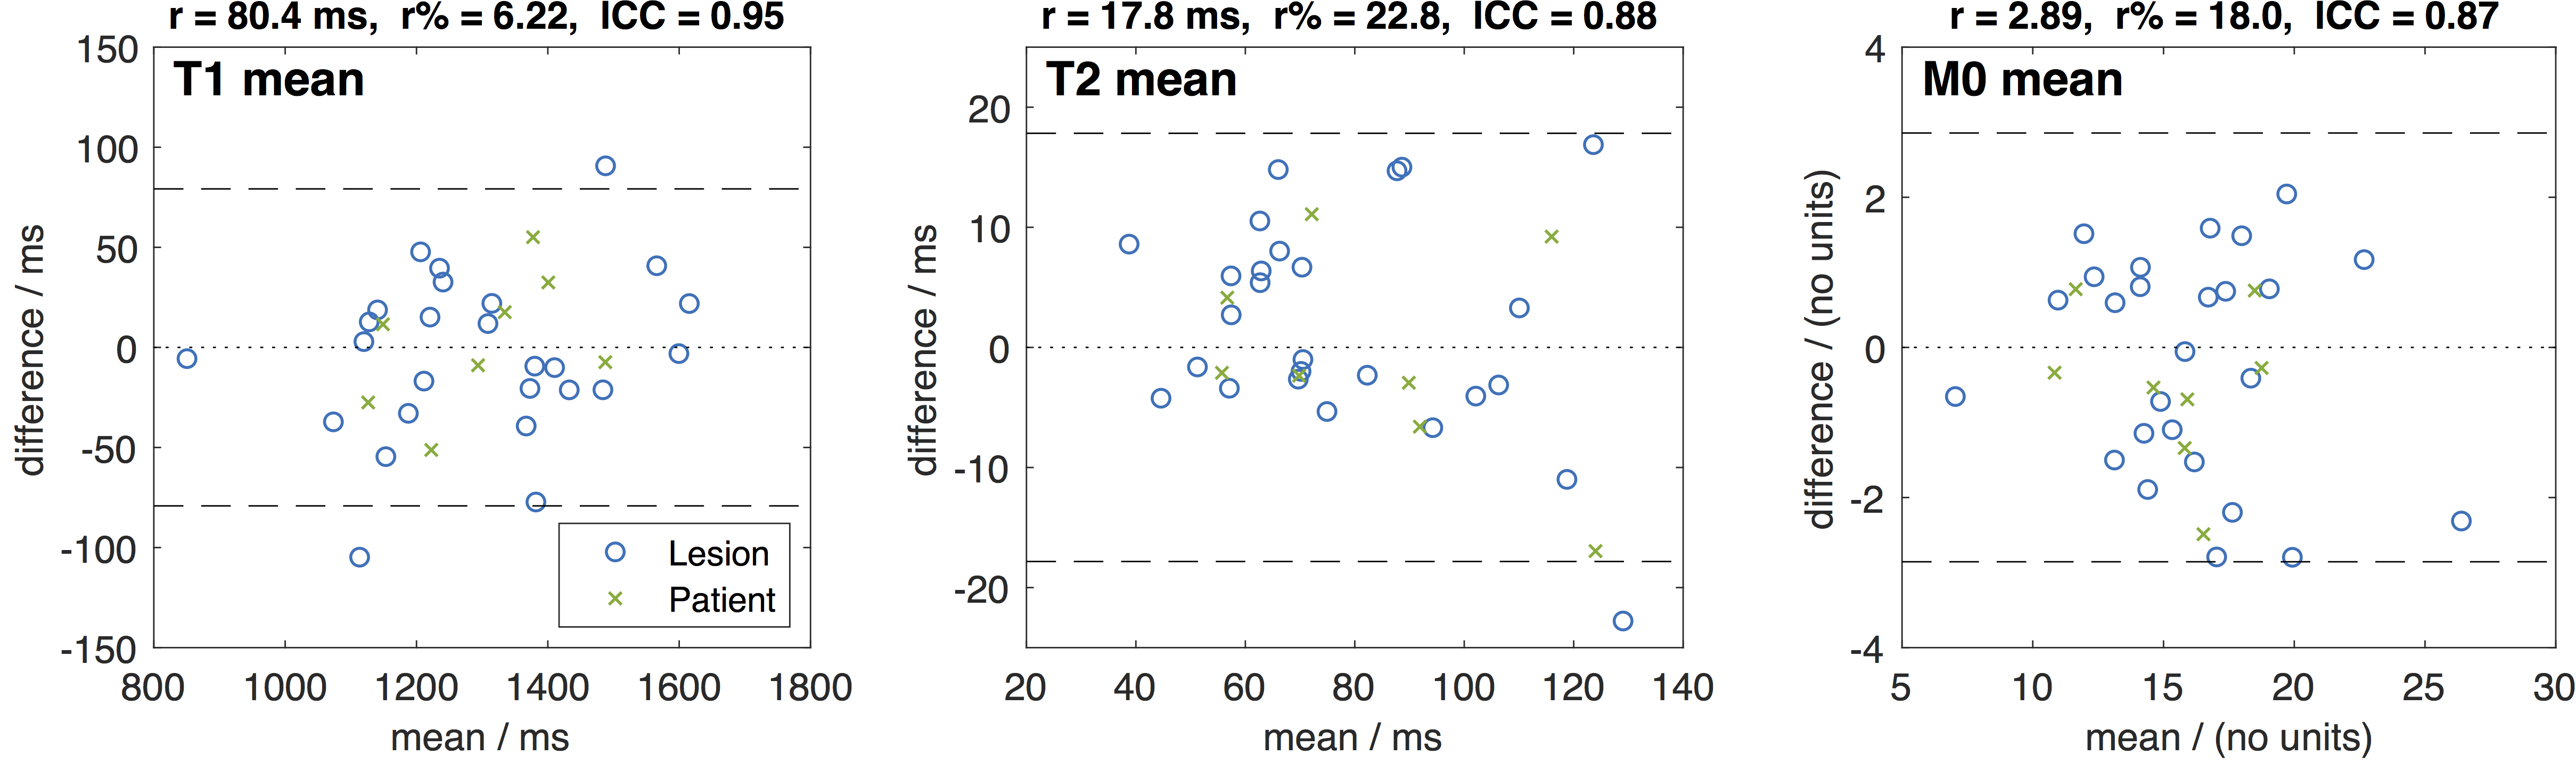
Figure 2: Bland-Altman plots for the lesion mean
statistics for T1, T2 and M0. The blue
circles are for each lesion, while the green crosses are from combining all
lesions per patient.