2667
Interaction between Modic changes and intervertebral discs revealed using deep learning and attention maps.1Institute of Clinical Sciences, Sahlgrenska Academy, University of Gothenburg, Gothenburg, Sweden, Gothenburg, Sweden
Synopsis
Observation of crosstalk between inflammatory IVD and vertebral Modic changes (MCs) has been reported. This study aims to further evaluate possible interaction between MCs and intervertebral discs by utilizing a variety of MR image contrasts and visually displaying the relation using attention maps. The attention maps displayed that both the MC in the vertebra and the surrounding tissue, mainly the intervertebral discs, are important for the classifier. This indicates that there is possible interaction between MC and the surrounding intervertebral discs. The choice of contrast in the images used to train the CNN affected the distribution of the attention maps.
Introduction
During the past decade, Modic changes (MCs) have been recognized as a promising pathological feature that may be linked to low back pain. Recently, observation of crosstalk between inflammatory IVD and vertebral MCs has been reported [1], indicating possible involvement of surrounding tissue in conjunction with vertebral MCs.This study aims to further evaluate possible interaction between vertebral MCs and intervertebral disc by utilizing different magnetic resonance (MR) image contrast information and visually displaying the relation using a convolutional neural network (CNN) and attention maps.
Material and methods
CohortTwenty-one patients with chronic low back pain (age 25-69, mean 38.7) and 9 individuals with no back pain (age 26-59, mean 37.8) with a total of 150 vertebrae were included in this study.
Magnetic resonance imaging protocol
The lumbar spine (L1 to L5) of all individuals were examined, on a Siemens Magnetom Aera 1.5 T MRI scanner (Erlangen, Germany), using a sagittal T1-weighted (T1W), T2-weighted (T2W) and T2-mapping technique.
Image analysis and post-processing
The occurrence of MCs (any type or size) in each vertebra and in every image slice was determined by a senior radiologist with 15 years of experience using the conventional T1W and T2W images.
Post-processing of the image data was performed using the MATLAB 2018b and Anaconda with Python distribution. To ensure high resolution with relevant image information, image patches containing the vertebra and surrounding tissue were extracted. A total of 1283 patches were extracted from each of the underlying T2W raw images of the T2-map, as well as from the T2-map itself. The patches were then sorted into two categories; Modic: n=89 patches per contrast and NoModic: n=1194 patches per contrast.
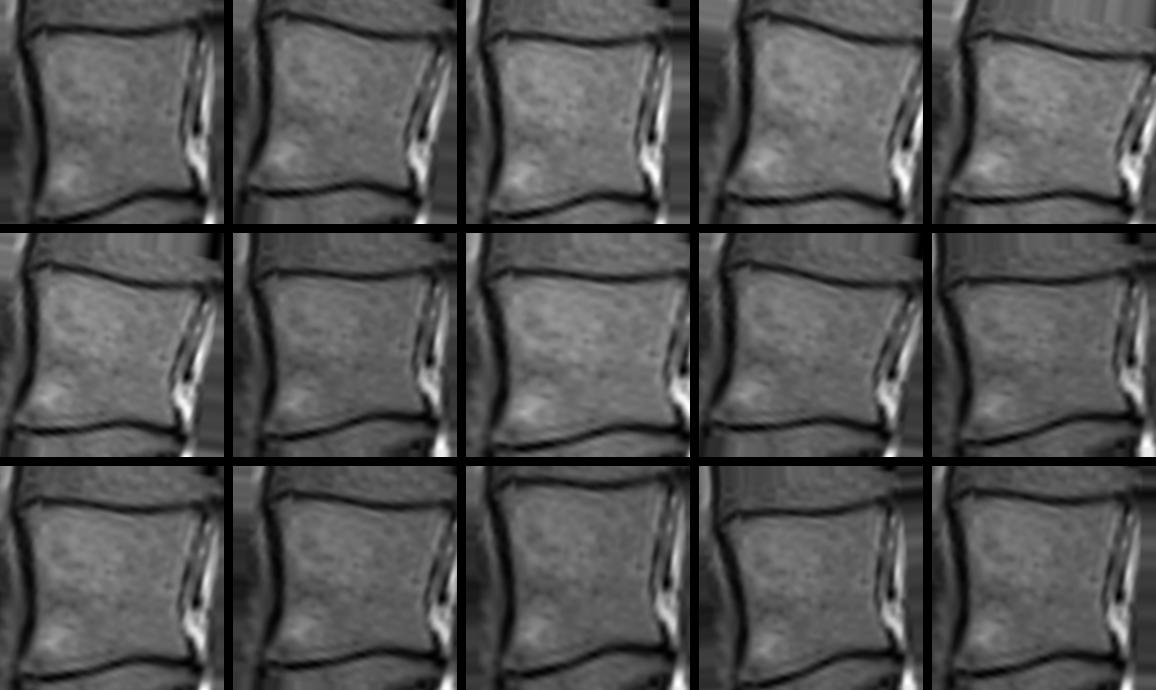
For the evaluation of MCs, Keras, i.e. a high-level neural networks API, was used to create a CNN classifier. All but the final dense layers with weights pre-trained on ImageNet were used from the original VGG-16 CNN [2] and prevented from further training. Replacing the original dense layers, three new dense layers were added to the model. To minimize the risk of the CNN becoming biased towards the class with the most available examples, an equal number of training examples were randomly fetched from both categories and fed into the fitting function. Each patch fed into the fitting function was first augmented (Figure 1). To evaluate the influence of surrounding tissue on the MC categorization, the CNN was trained on two sets of images with different contrast. The first set used images with different contrast in each RGB image channel: raw-data image with the echo time (TE) of 11.1 ms, 77.7 ms and the pure T2-map. The second set consisted of MR images with an TE of 11.1 ms copied to all three image channels.
Possible interaction between vertebral MCs and the surrounding tissue were displayed using validation data and attention maps created with Keras-vis [3].
A 10-fold cross-validation was performed and the CNN was retrained on every fold. Each new version of the CNN was trained for 50 epochs and the weights yielding the first-best validation score was saved.
Results
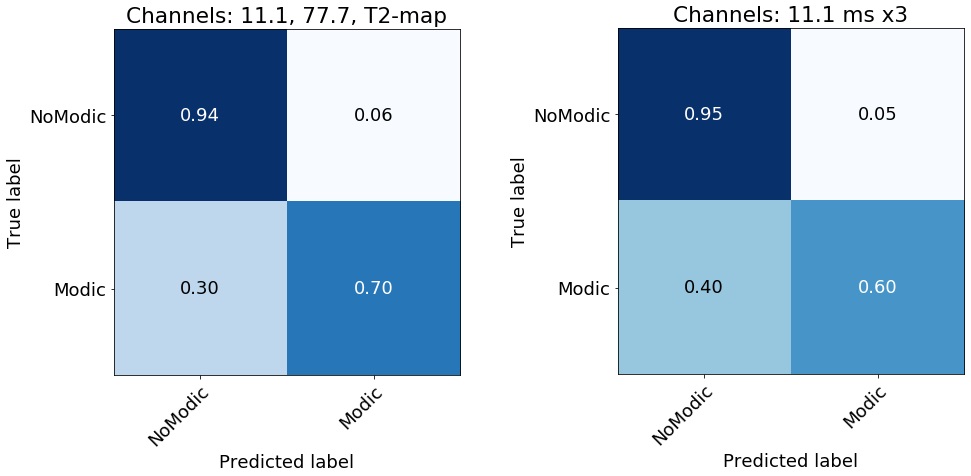
The 10-fold cross-validation using the first test set with image channels: TE 11.1 ms, TE 77.7 and T2-map yielded the following normalized results: True Positive (TP): 0.70, False Positive (FP): 0.30, True Negative (TN): 0.94, False Negative (FN): 0.06 (Figure 2). F1-score: 0.56The second test set with image channels: TE 11.1 ms x 3 yielded the following normalized results: TP 0.60, FP 0.40, TN 0.95, FN 0.05. F1-score: 0.52.
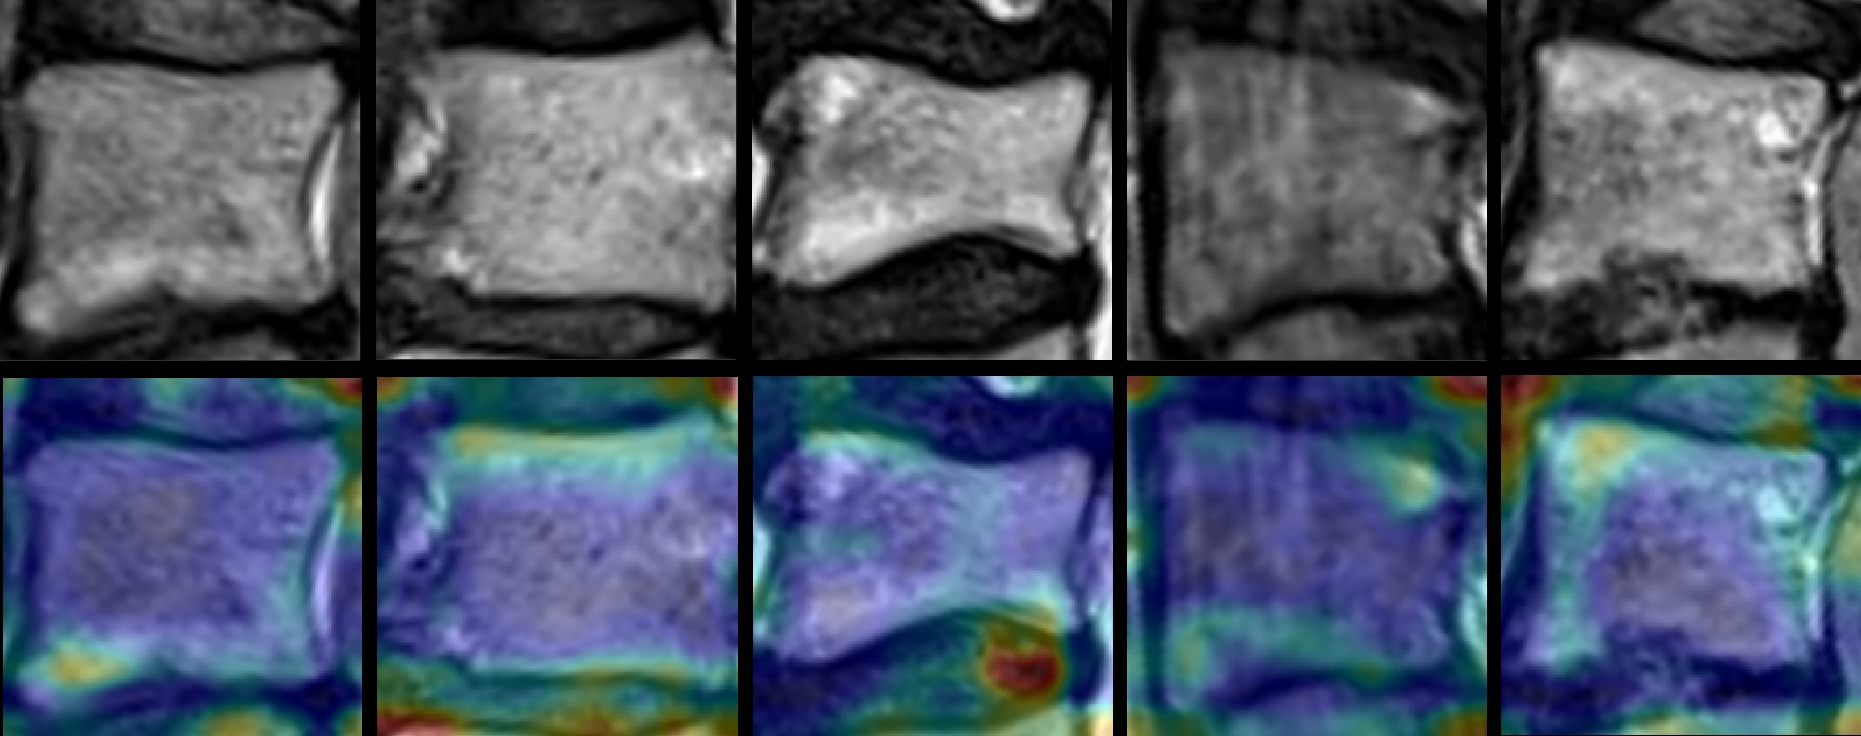
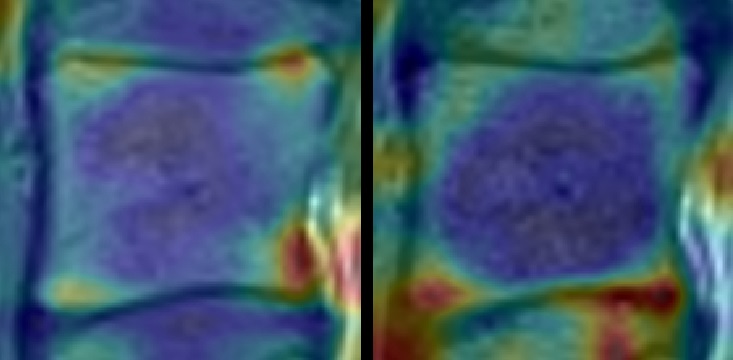
The attention maps clearly display that both the MC and the tissue surrounding the vertebra, mainly the intervertebral discs, are important for the classifier (Figure 3). Furthermore, the contrast available in the images influenced classifiers attention. Compared to attention maps based on images from the second test set (channels: TE 11.1 ms x 3), attention maps based on the first test set is generally more prone to highlight tissue outside the vertebra (Figure 4).
Discussion
This study suggest that MCs often appear in conjunction specific morphology in the tissue surrounding the vertebrae. This is supported by the attention maps which focuses not only the MC itself, but also on the surrounding tissue. Especially the intervertebral discs seem to be an important structure as it is frequently highlighted. Attention maps based on the first set of images, which hold superior contrast information (channels TE 11.1 ms, TE 77.7 and T2-map), was generally more prone to highlight tissue outside the vertebra. As this set of images outperformed the second set, it is probable that important contrast information is available in the surrounding tissue which interacts or relates to the MC. The findings in this study suggest that different combinations of contrast information might alter the attention maps distribution. Pure T1W and T2W images are desirable as it can cover more contrast information and better expose the morphology.Conclusion
This study indicates that there is a possible interaction between MC and the surrounding intervertebral discs. The choice of contrast in the images used to train the CNN will probably have an effect on the performance of the classifier as well as the distribution of the attention maps.Acknowledgements
No acknowledgement found.References
1. Dudli, S., et al., Modic type 1 change is an autoimmune response that requires a proinflammatory milieu provided by the 'Modic disc'. Spine J, 2018. 18(5): p. 831-844.
2. Simonyan, K. and A. Zisserman, Very deep convolutional networks for large-scale image recognition. arXiv preprint arXiv:1409.1556, 2014.
3. Kotikalapudi, R., Keras visualization toolkit. Home-Keras-Vis Documentation, 2017.
Figures