2665
Fully Automatic Multi-label Segmentation of Knee joint MRI using Deep Learning Neural Networks1CUHK lab of AI in radiology (CLAIR), Department of imaging and interventional radiology , The Chinese university of Hong Kong, HongKong, Hong Kong, 2Department of imaging and interventional radiology, The Chinese university of Hong Kong, Hong Kong, Hong Kong
Synopsis
Accurate segmentation of the cartilage and meniscus is highly desirable for diagnosis and treatment of knee joint diseases. We implemented and compared four deep learning neural networks for fully automated simultaneous segmentation of cartilage and meniscus. Using the Osteoarthritis Initiative (OAI) data sets, we demonstrated the U-net combined with specific post-processing achieved the best performance on femoral cartilage, tibial cartilage, patellar cartilage, and meniscus in terms of dice score.
Introduction
Magnetic Resonance Imaging (MRI) is a preferred imaging modality for assessing the morphological properties of knee joints due to its superior soft-tissue contrast and non-invasive nature [1]. Knee MR images often requires precise segmentation of tissues including meniscus and cartilages for quantitative analysis [1, 2]. The traditional semi-automatic segmentation methods require manual selection of certain parameters, which makes segmentation time-consuming and subject to inter-observer variability. In this work, we investigated four deep neural networks on fast and accurate segmentation of meniscus and cartilage of knee joints.Methods
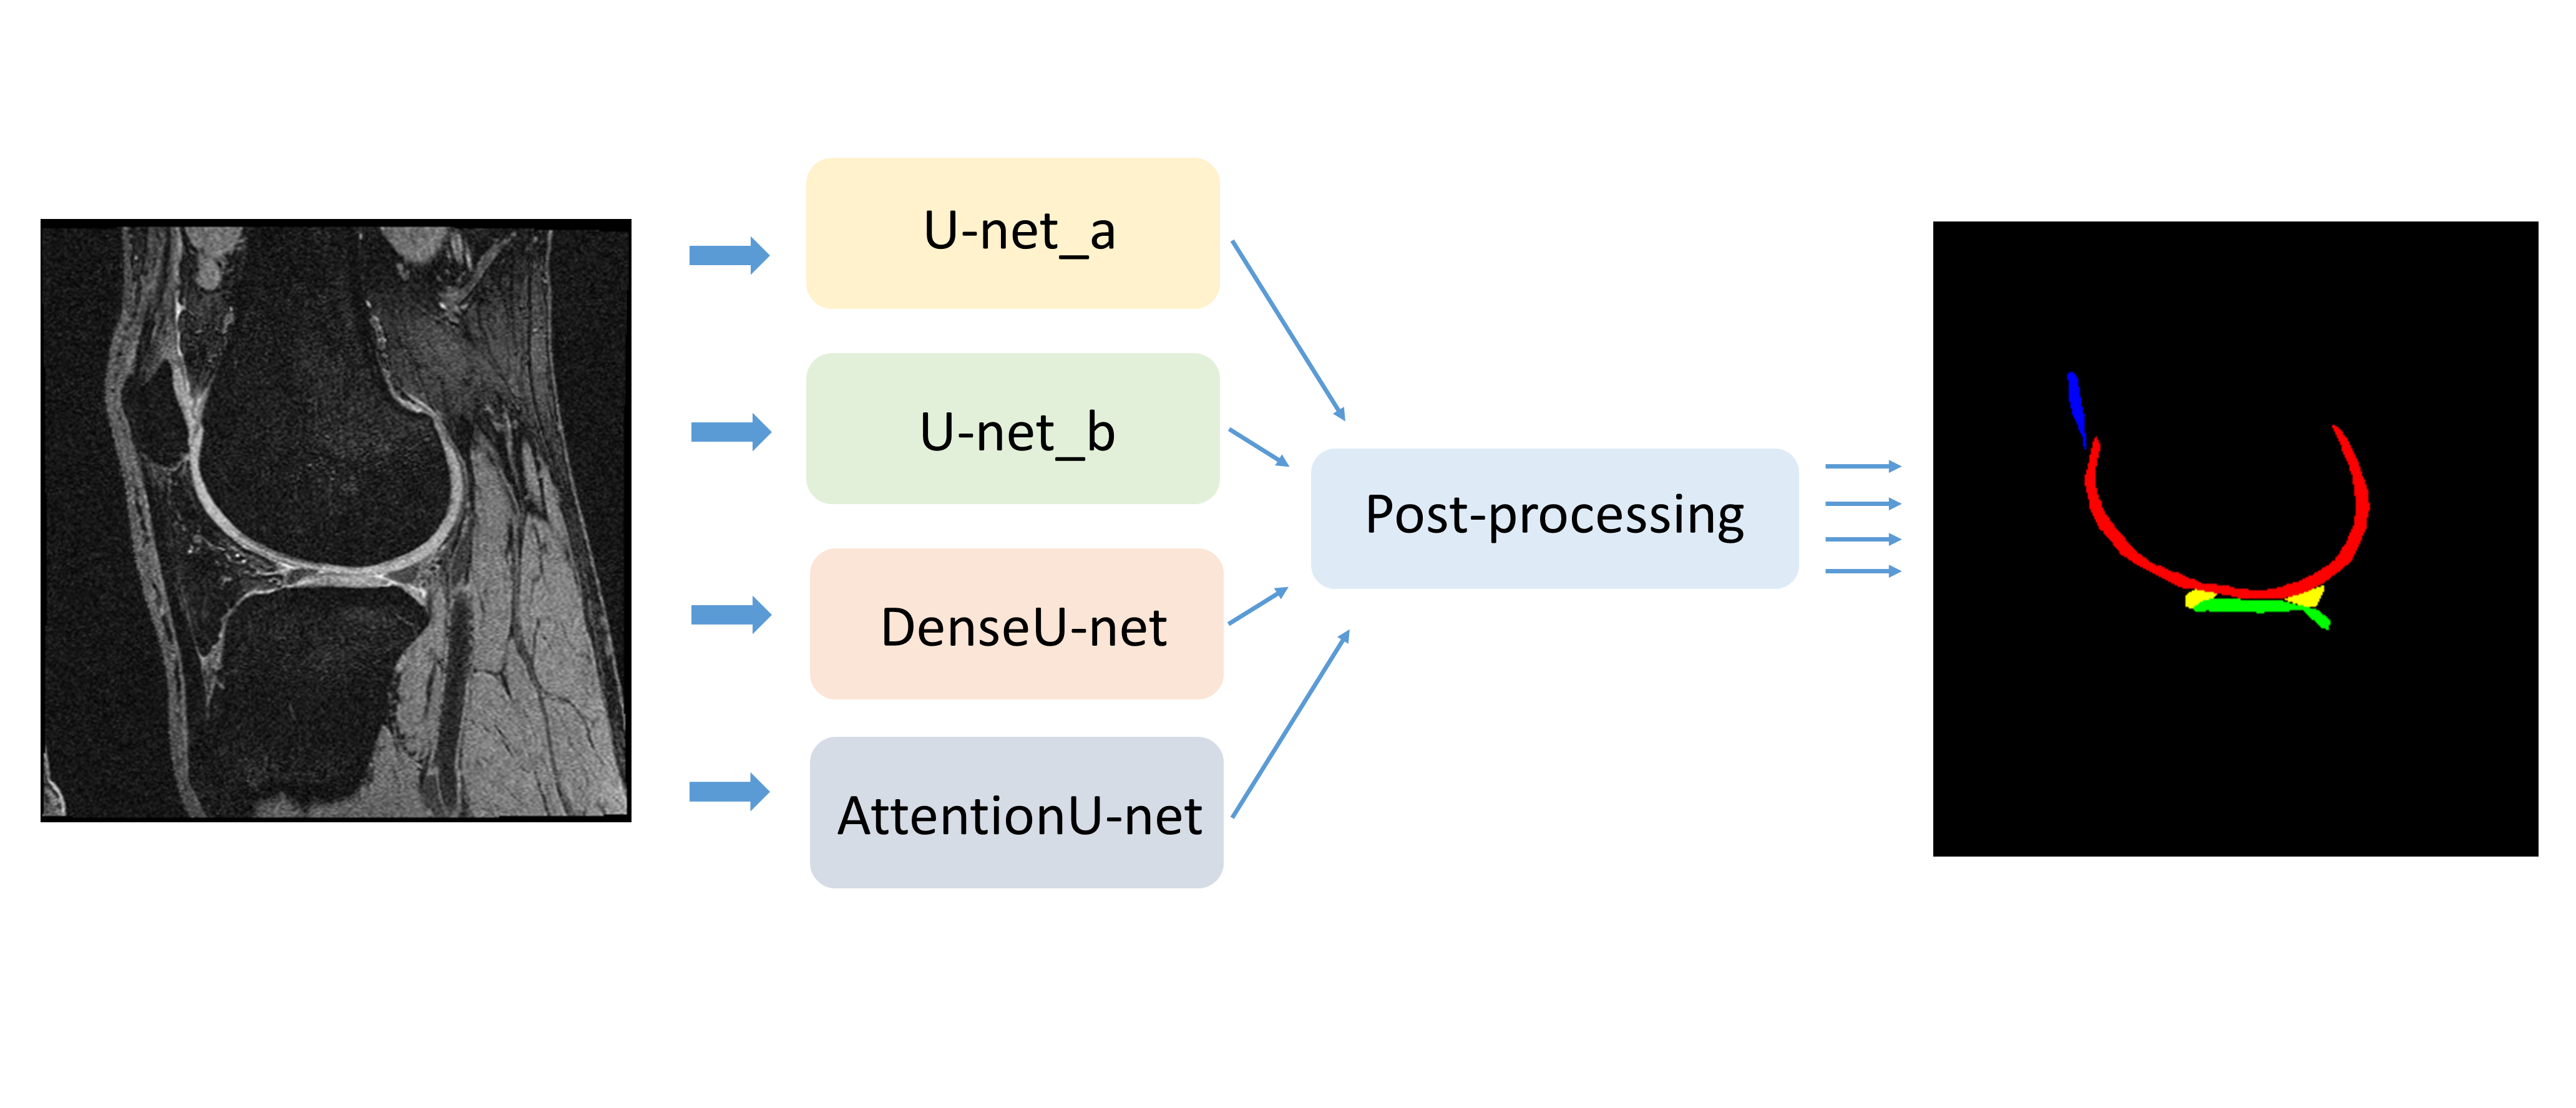
The basic workflow we proposed for multi-label segmentation is shown in Figure 1. Four deep convolutional neural networks for automatic segmentation of knee joints were implemented and compared. These networks were based on U-net [3] with an encoder-decoder structure, which can be used to extract high-resolution features and fuse them with low-resolution features. In our workflow, minimum connected component restriction was used to efficiently correct the wrong segmentation of the output of the network.The four networks include: 1. U-net_a: the basic U-net architecture using the generalized dice coefficient as the loss function; 2. U-net_b: same architecture as the U-net_a while the loss function is the combination of the generalized dice coefficient and the weighted cross-entropy; 3. Attention U-net [4]: addition with attention gate to strengthen relevant features for a specific target; 4. Dense U-net [5]. The loss function used for the Attention U-net and Dense U-net is the combination of the generalized dice coefficient and the weighted cross-entropy. All the implementations are conducted on the Tensorflow platform.
During training, the momentum Optimizer with a learning rate of 1e-2 and a momentum of 0.5 were used. Models were trained with 1248k iteration with a batch size of 1. All the models utilized the same hyper-parameters. Training and testing were performed on a server with 4 Nvidia TITAN V GPUs.
MR images from Osteoarthritis Initiative (OAI) (https://oai.nih.gov) were used in our experiments. These MR images were acquired at 3.0T using a 3D double-echo steady-state (DESS) pulse sequence. Six sub-regions (femoral cartilage, lateral tibial cartilage, medial tibial cartilage, patellar cartilage, lateral meniscus, and medial meniscus) of knee joints were labeled manually in sagittal planes by two musculoskeletal radiologists. The 3D DESS data sets were collected from 88 subjects, which were randomly split into 78 subjects for training and 10 subjects for testing. Data sets were pre-processed through data normalization and then fed into networks batch by batch with the size of 384x384x1.
Results
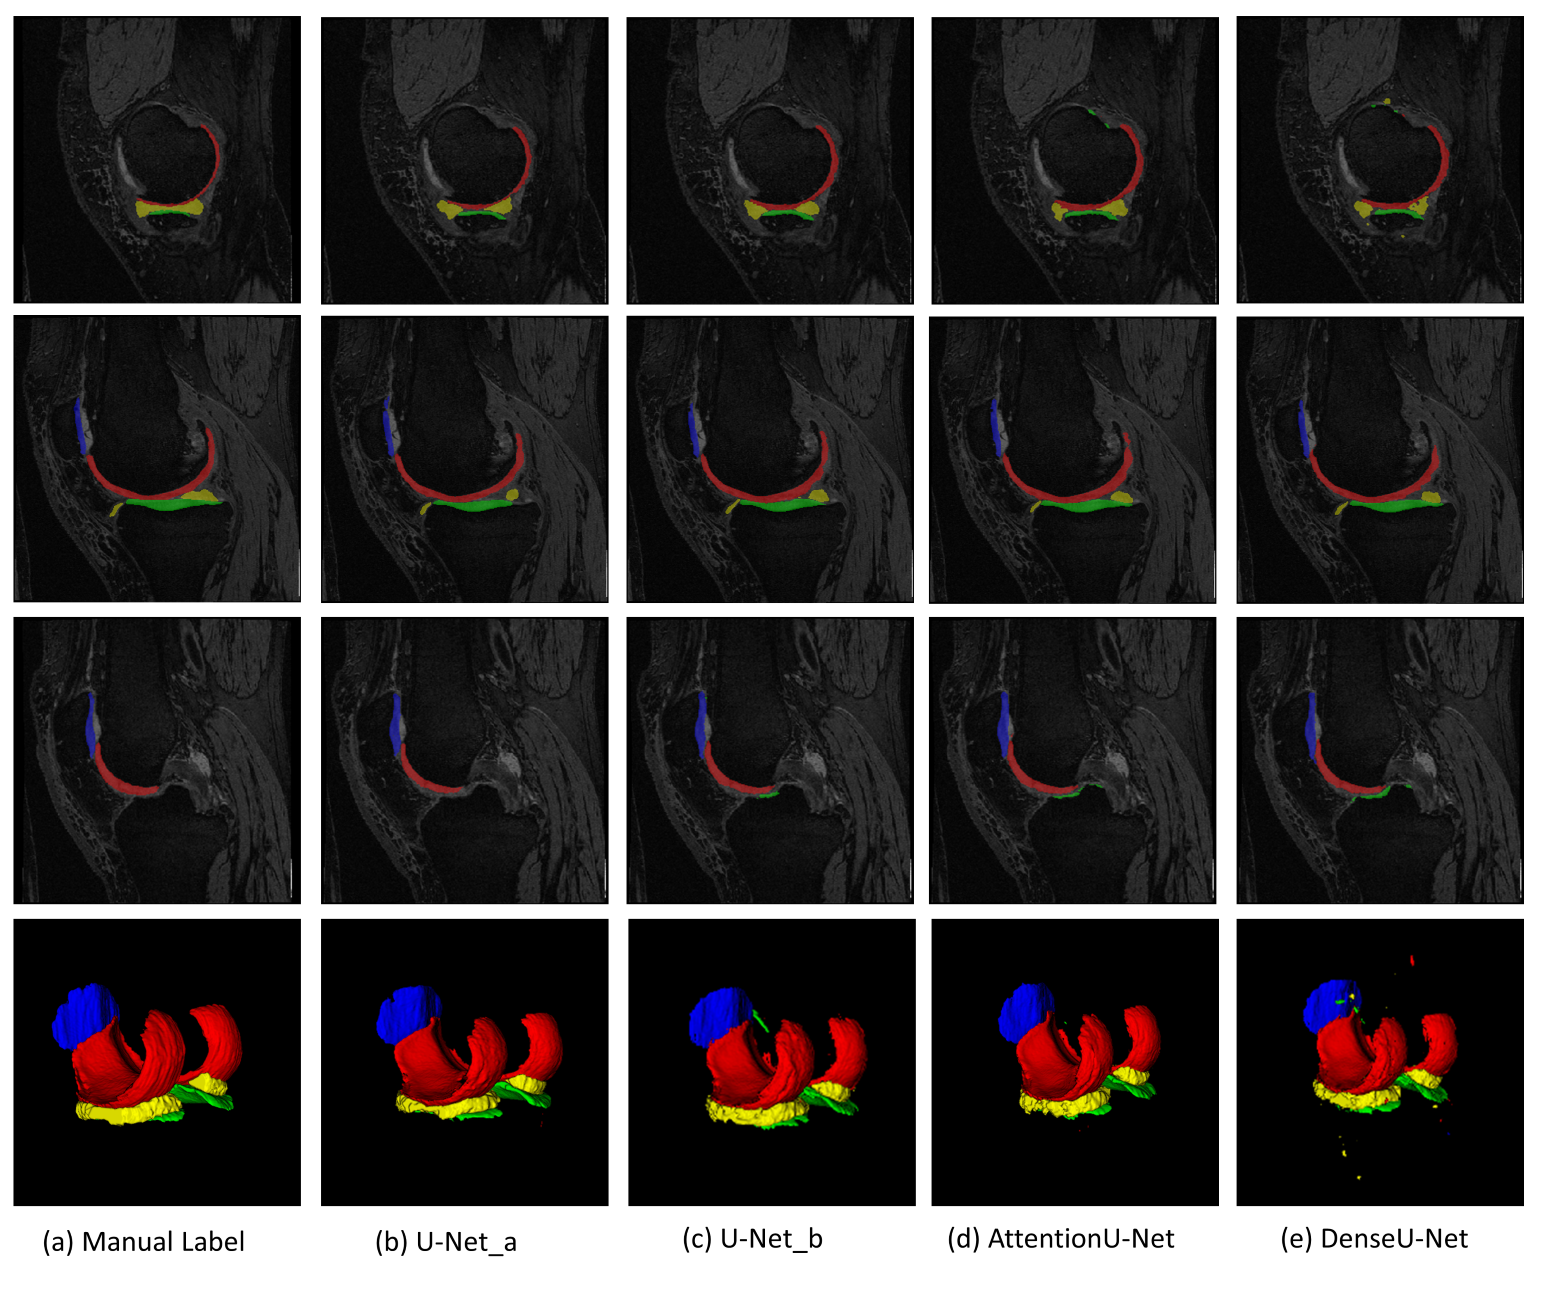
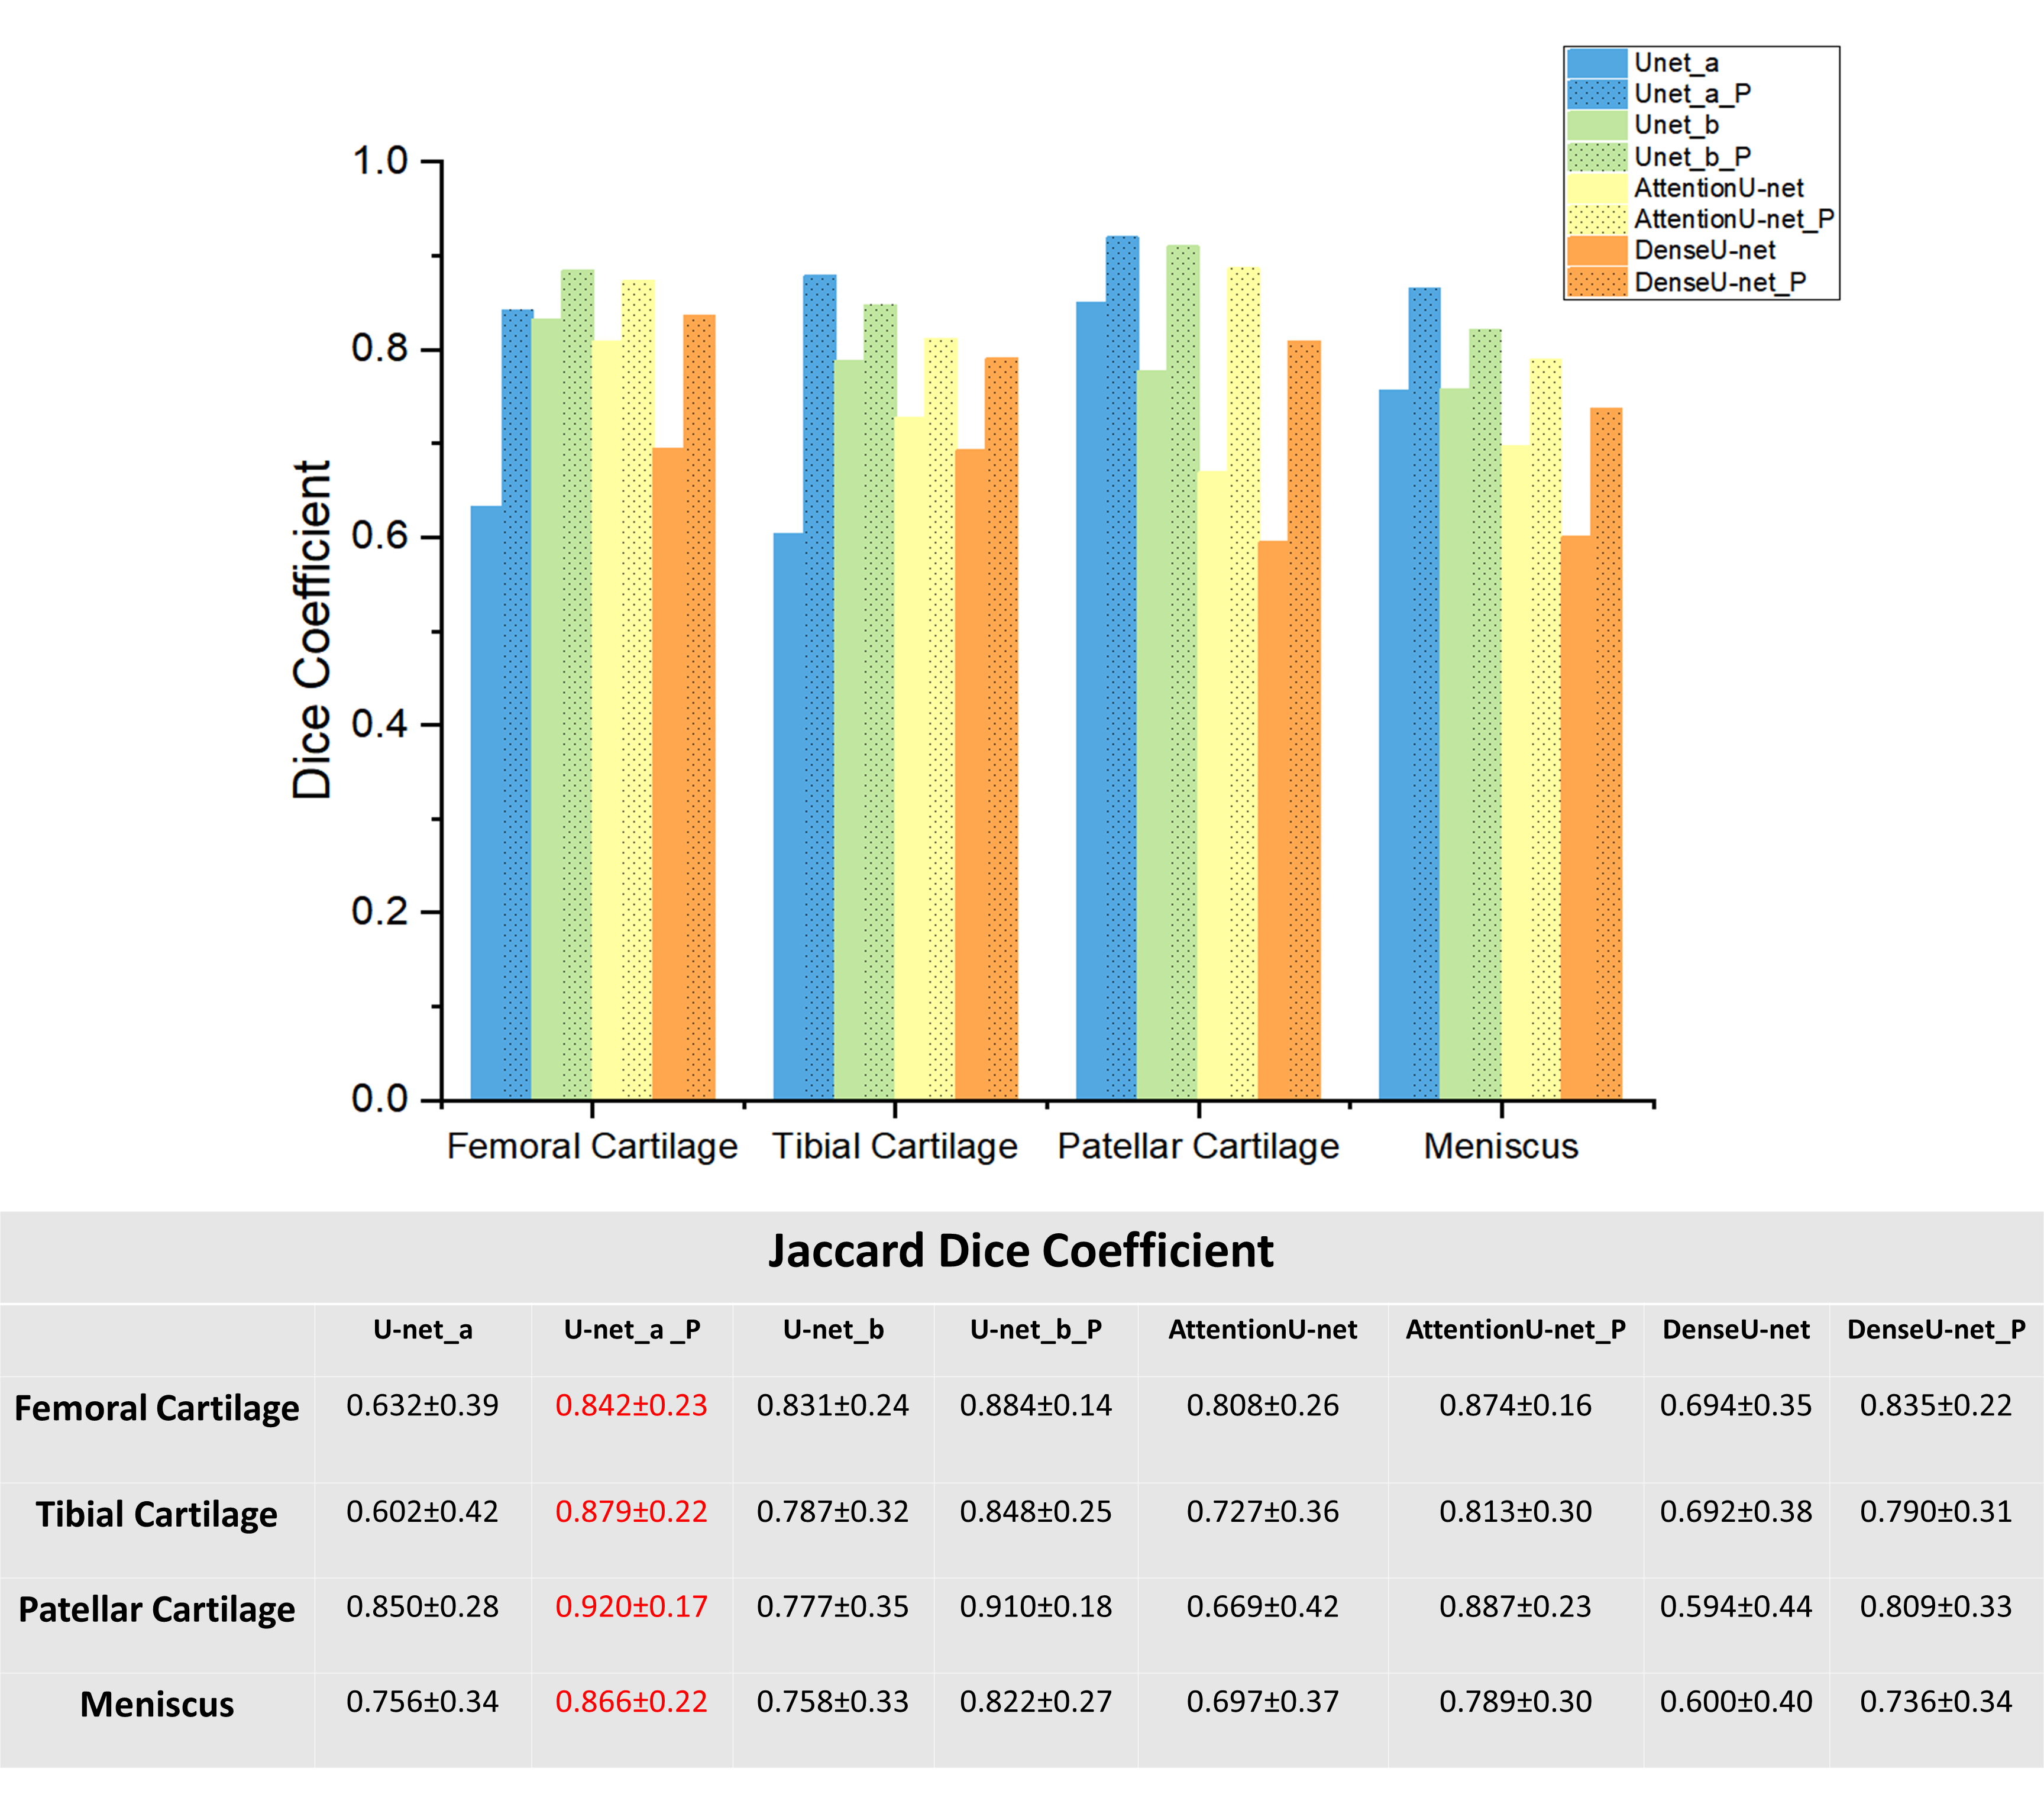
Figure 2 shows the examples of segmentation results overlaid on the corresponding images. We used Jaccard Dice coefficient to evaluate the performance of four networks. The results are shown in Figure 3. Note the post-processing improves the performance of all four networks. The U-net_a and U-net_b with post-processing achieved much better performance compared to the attention U-net and Dense U-net.Discussion and Conclusions
We discovered that attention mechanism and dense connection networks did not improve the segmentation results. U-net_b trained by the combined loss function appeared to improve the performance of U-net_a without post-processing. Post-processing procedure can improve the accuracy of segmentation. U-net_a with post-processing achieved the best overall results. The computation time of segmentation of one slice is 0.16s using one GPU card. One challenge to segment multiple tissues simultaneously is that improving performance on one tissue may degrade its accuracy of segmentation on other tissues. In the future, we need to add more mechanism to the network architecture to solve this problem.Acknowledgements
This study is supported by a grant from the Research Grants Council of the Hong Kong SAR (Project SEG CUHK02), and a grant from the Innovation and Technology Commission of the Hong Kong SAR (Project MRP/001/18X).References
[1] Norman, Berk, Valentina Pedoia, and Sharmila Majumdar. "Use of 2D U-Net convolutional neural networks for automated cartilage and meniscus segmentation of knee MR imaging data to determine relaxometry and morphometry." Radiology 288.1 (2018): 177-185.
[2] Ronneberger, Olaf, Philipp Fischer, and Thomas Brox. "U-net: Convolutional networks for biomedical image segmentation." International Conference on Medical image computing and computer-assisted intervention. Springer, Cham, 2015.
[3] Zhou, Zhaoye, et al. "Deep convolutional neural network for segmentation of knee joint anatomy." Magnetic resonance in medicine 80.6 (2018): 2759-2770.
[4] Oktay, Ozan, et al. "Attention u-net: Learning where to look for the pancreas." arXiv preprint arXiv:1804.03999 (2018).
[5] Huang, Gao, et al. "Densely connected convolutional networks." Proceedings of the IEEE conference on computer vision and pattern recognition. 2017.
Figures