2663
Are Two MR Images Enough to Generate the Third One Accurately? - Clinically Feasible Fat Suppression of Lumbar Spine MRI from T1w and T2w Images Only1Yonsei University, Seoul, Republic of Korea, 2Yonsei University College of Medicine, Seoul, Republic of Korea, 3Gangnam Severance Hospital, Seoul, Republic of Korea
Synopsis
This study aims to generate T2-weighted fat suppression (T2 FS) magnetic resonance (MR) lumbar spine image from T1-weighted (T1-w) and T2-weighted (T2-w) images using fully convolutional neural networks. We trained our model that uses multimodal images (T1-w, and T2-w images) to generate synthetic T2FS images close to the acquired T2FS images. The results of our study show that our deep learning model can properly generate bone marrow edema of the vertebral bodies which significantly impact on diagnosis.
Purpose
In a typical lumbar spine MR protocol, T1-weighted (T1-w) images provide anatomical structure with high resolution and can easily recognize the changes of bone marrow. And T2-weighted (T2-w) images show the changes in peripheral soft tissues including intervertebral discs and spinal ligaments, and it also useful for the detection and characterization of various other regions. T2-weighted fat suppression (T2 FS) images improves the diagnostic confidence by enhancing the visualization of abnormal regions using fat suppression.1-2 However, acquiring such multi-contrast images at once is time consuming and gives a burden to patients. The purpose of this study is to generate T2 FS image from T1-w and T2-w images without additional scanning.Method
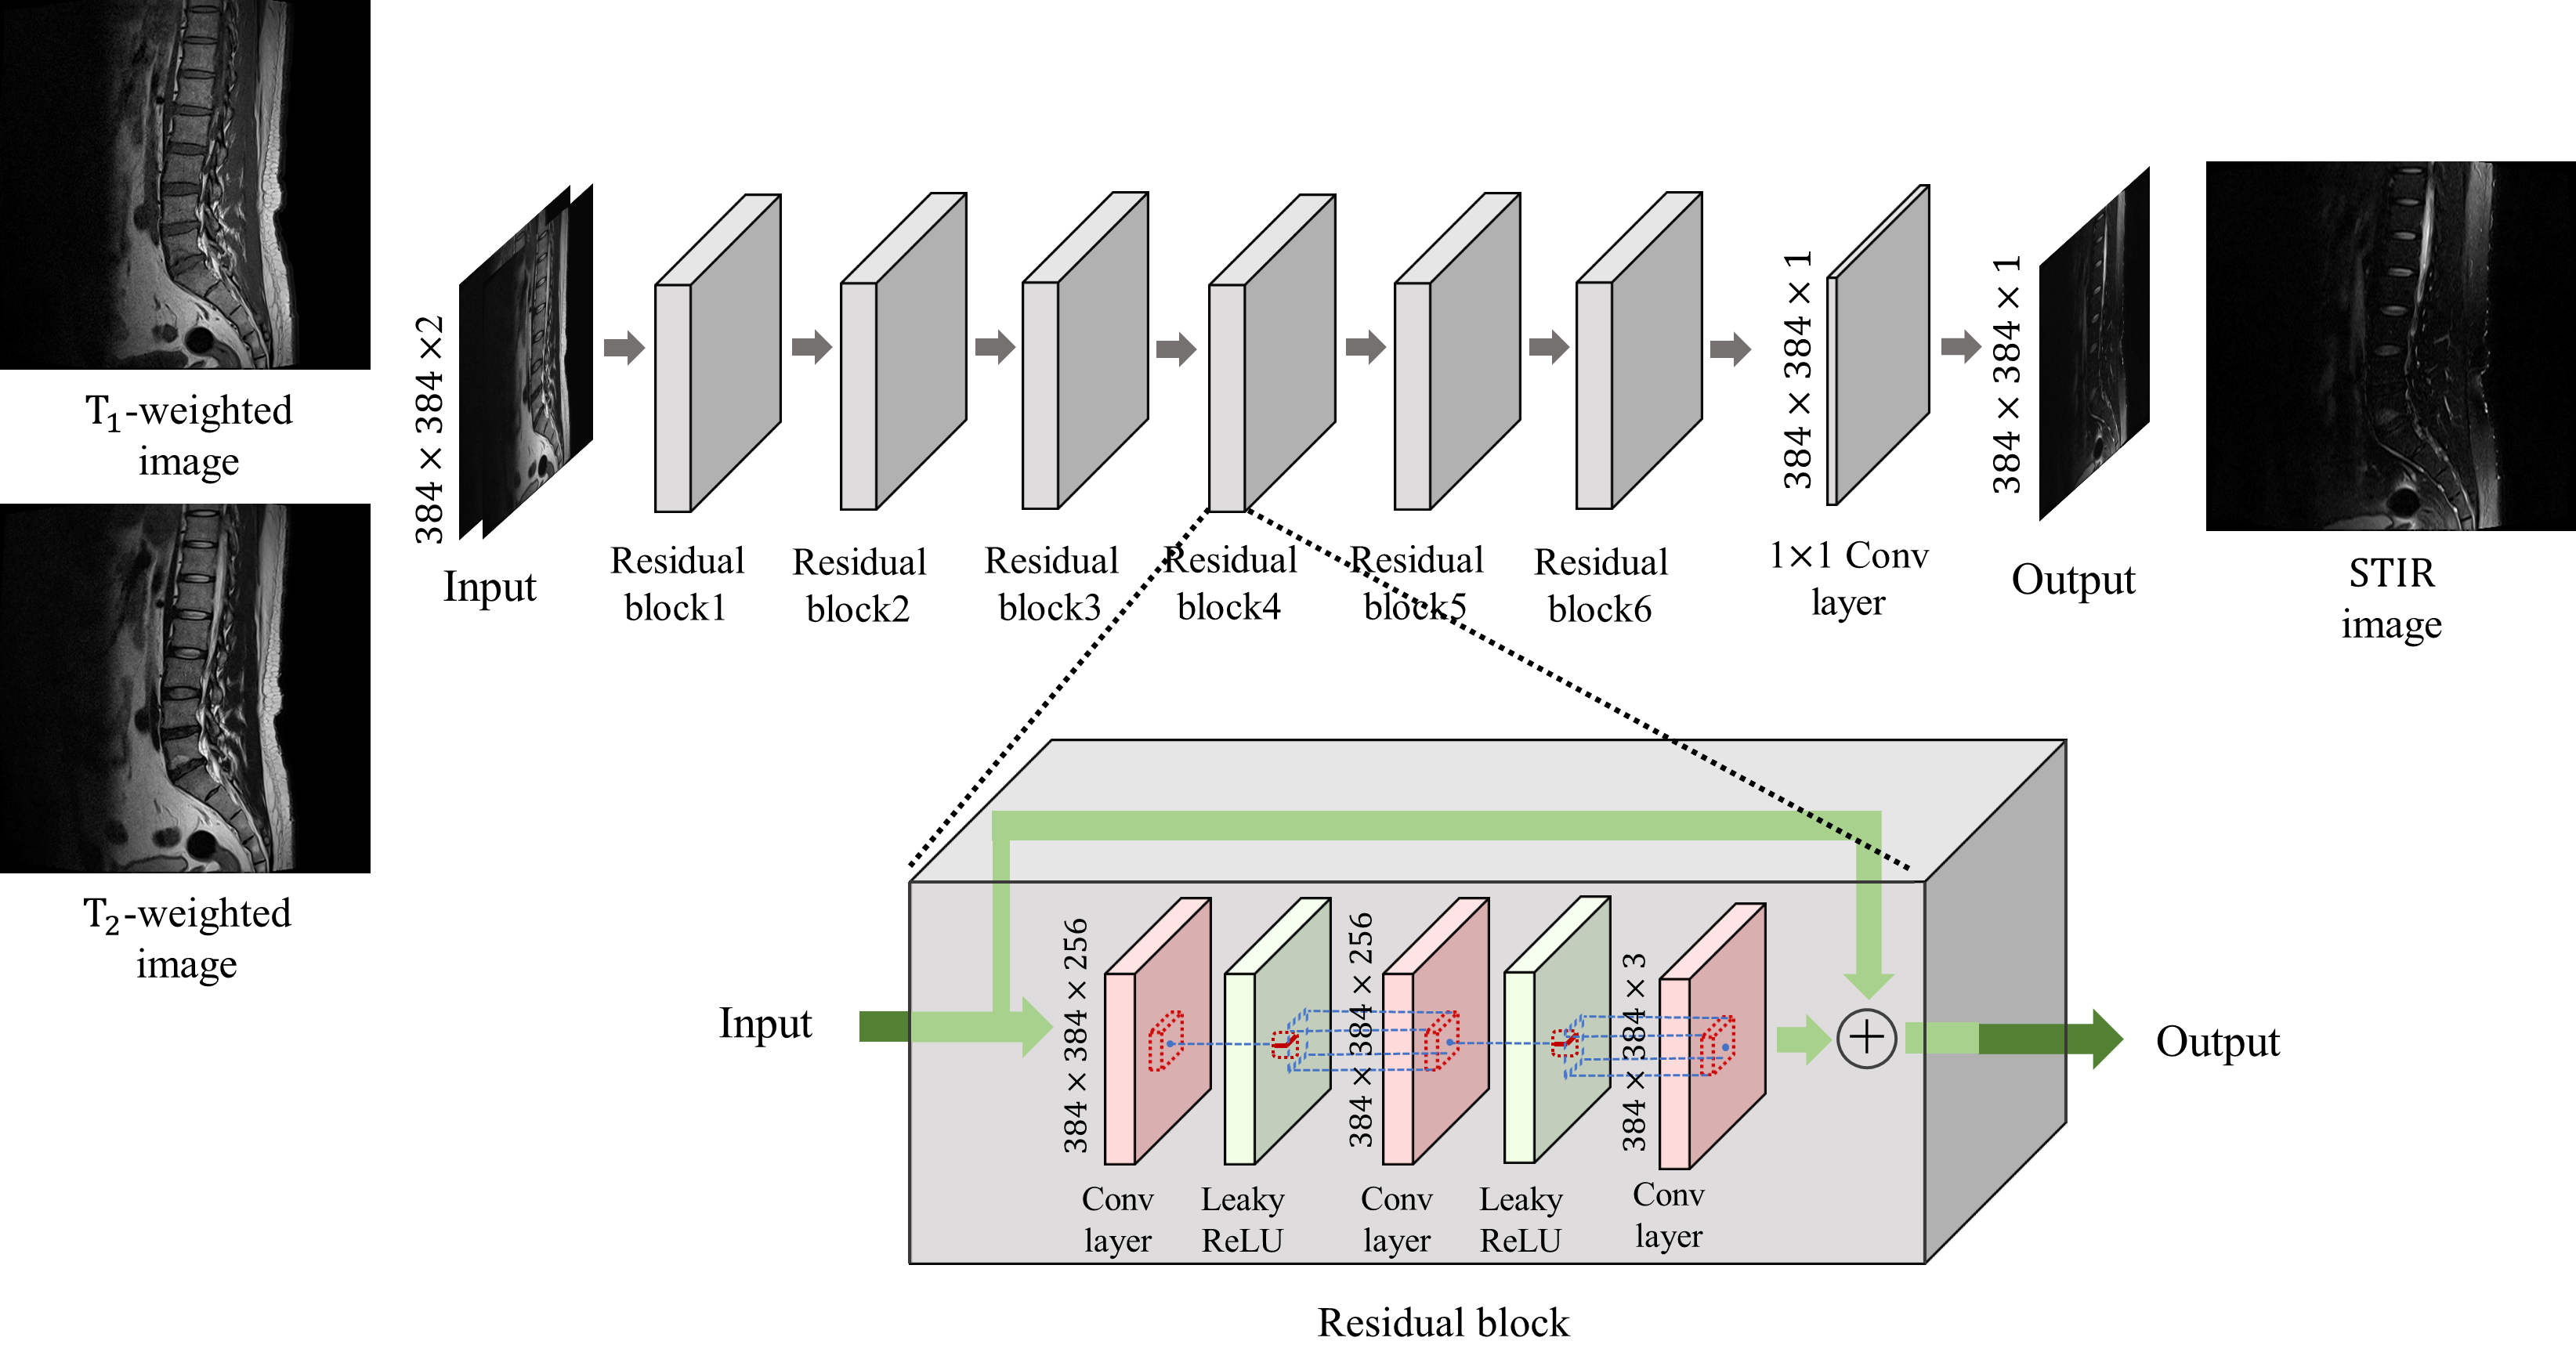
MRI is an imaging modality that exploits the phenomenon of nuclear magnetic resonance3.Our model was trained to generated PD FS images from T1-w and T2-w images as 2-channel inputs. The network is a fully convolutional network and includes no down-sampling or up-sampling layer to minimize the loss of fine details.4 Our network structure is shown in Fig. 1. Since various contrast MR images show relative contrasts between tissues rather than quantitative values of tissues, the maximum intensities in each image also important. Therefore, we normalized the T1-w, T2-w, and PD FS images with min-max normalization based on the maximum intensity of the total dataset to consider the ratio of the maximum intensity of each image. Our model is trained by the mean squared error loss function (MSE) and a patch-based variation error loss function which can help the model to learn the intensity distribution of the label images. In addition, we also use an additional loss function for training to correct slight misregistration that may occur between the multi-contrast images even if registration algorithms are used.5-6The dataset we used is 2040 tuples of lumbar spine multi-contrast images consisting of 120 subjects. 60 subjects were used as training dataset, and the other 60 subjects were used for validation and test equally.
Results and discussion
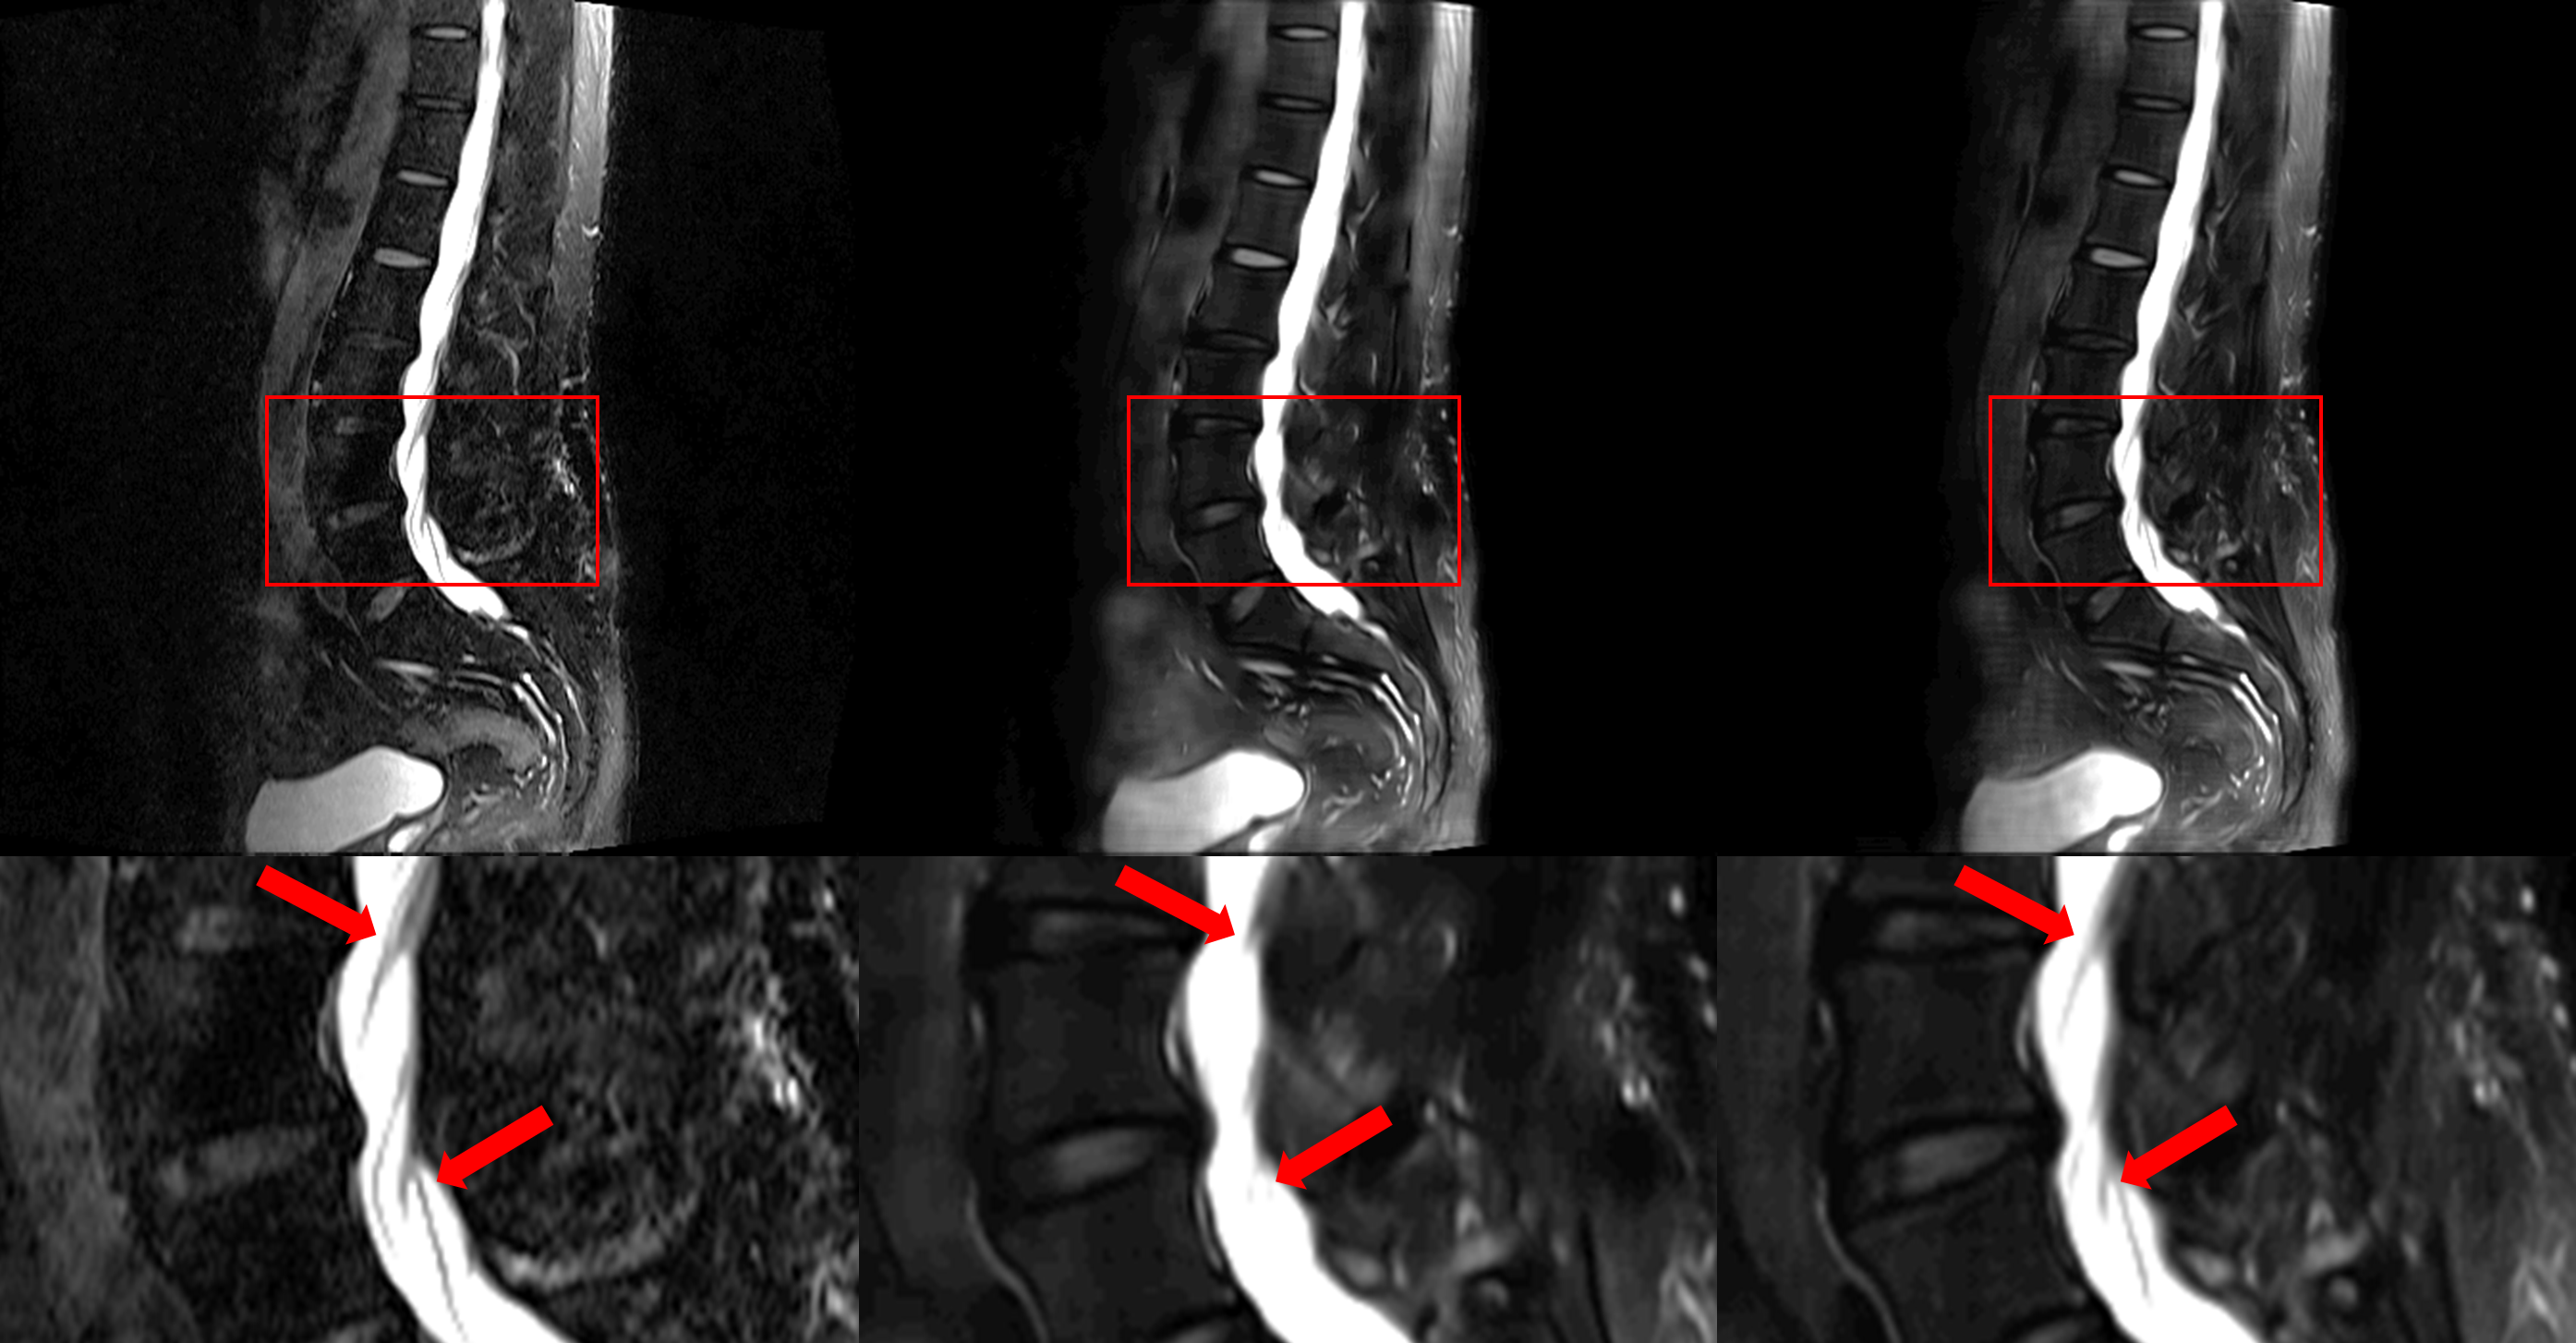
Before comparing results, all T2 FS images and our result images were normalized from 0 to 1 per slice to use quantitative evaluation metrics. For a total of 510 test slices, our results achieved an 0.002 MSE and 27.3703 PSNR scores. Table. 1 shows the comparison of the MSE and PSNR scores between the results of our model trained with all the loss functions and those of our model trained with only MSE loss function. The results using all the loss functions achieved better scores in both metrics. In addition, as shown in Fig. 2, the blurring artifacts are reduced when all the loss functions were used for the training.The left side of the lumbar spine images, where the lungs and intestines are located, has a large variation between the multi-contrast images due to respiration and breaks the alignment of the images. For the important regions like vertebraes and intervertebral discs which influence on musculoskeletal diagnosis, our results achieved an 0.0001 MSE and 30.9852 PSNR scores. In general, the PSNR score higher than 30 is considered that the difference between the two images is not distinguishable for human eye.7-8 This score indicates that the acquired T2 FS images and our results are quite similar for the clinically important regions.
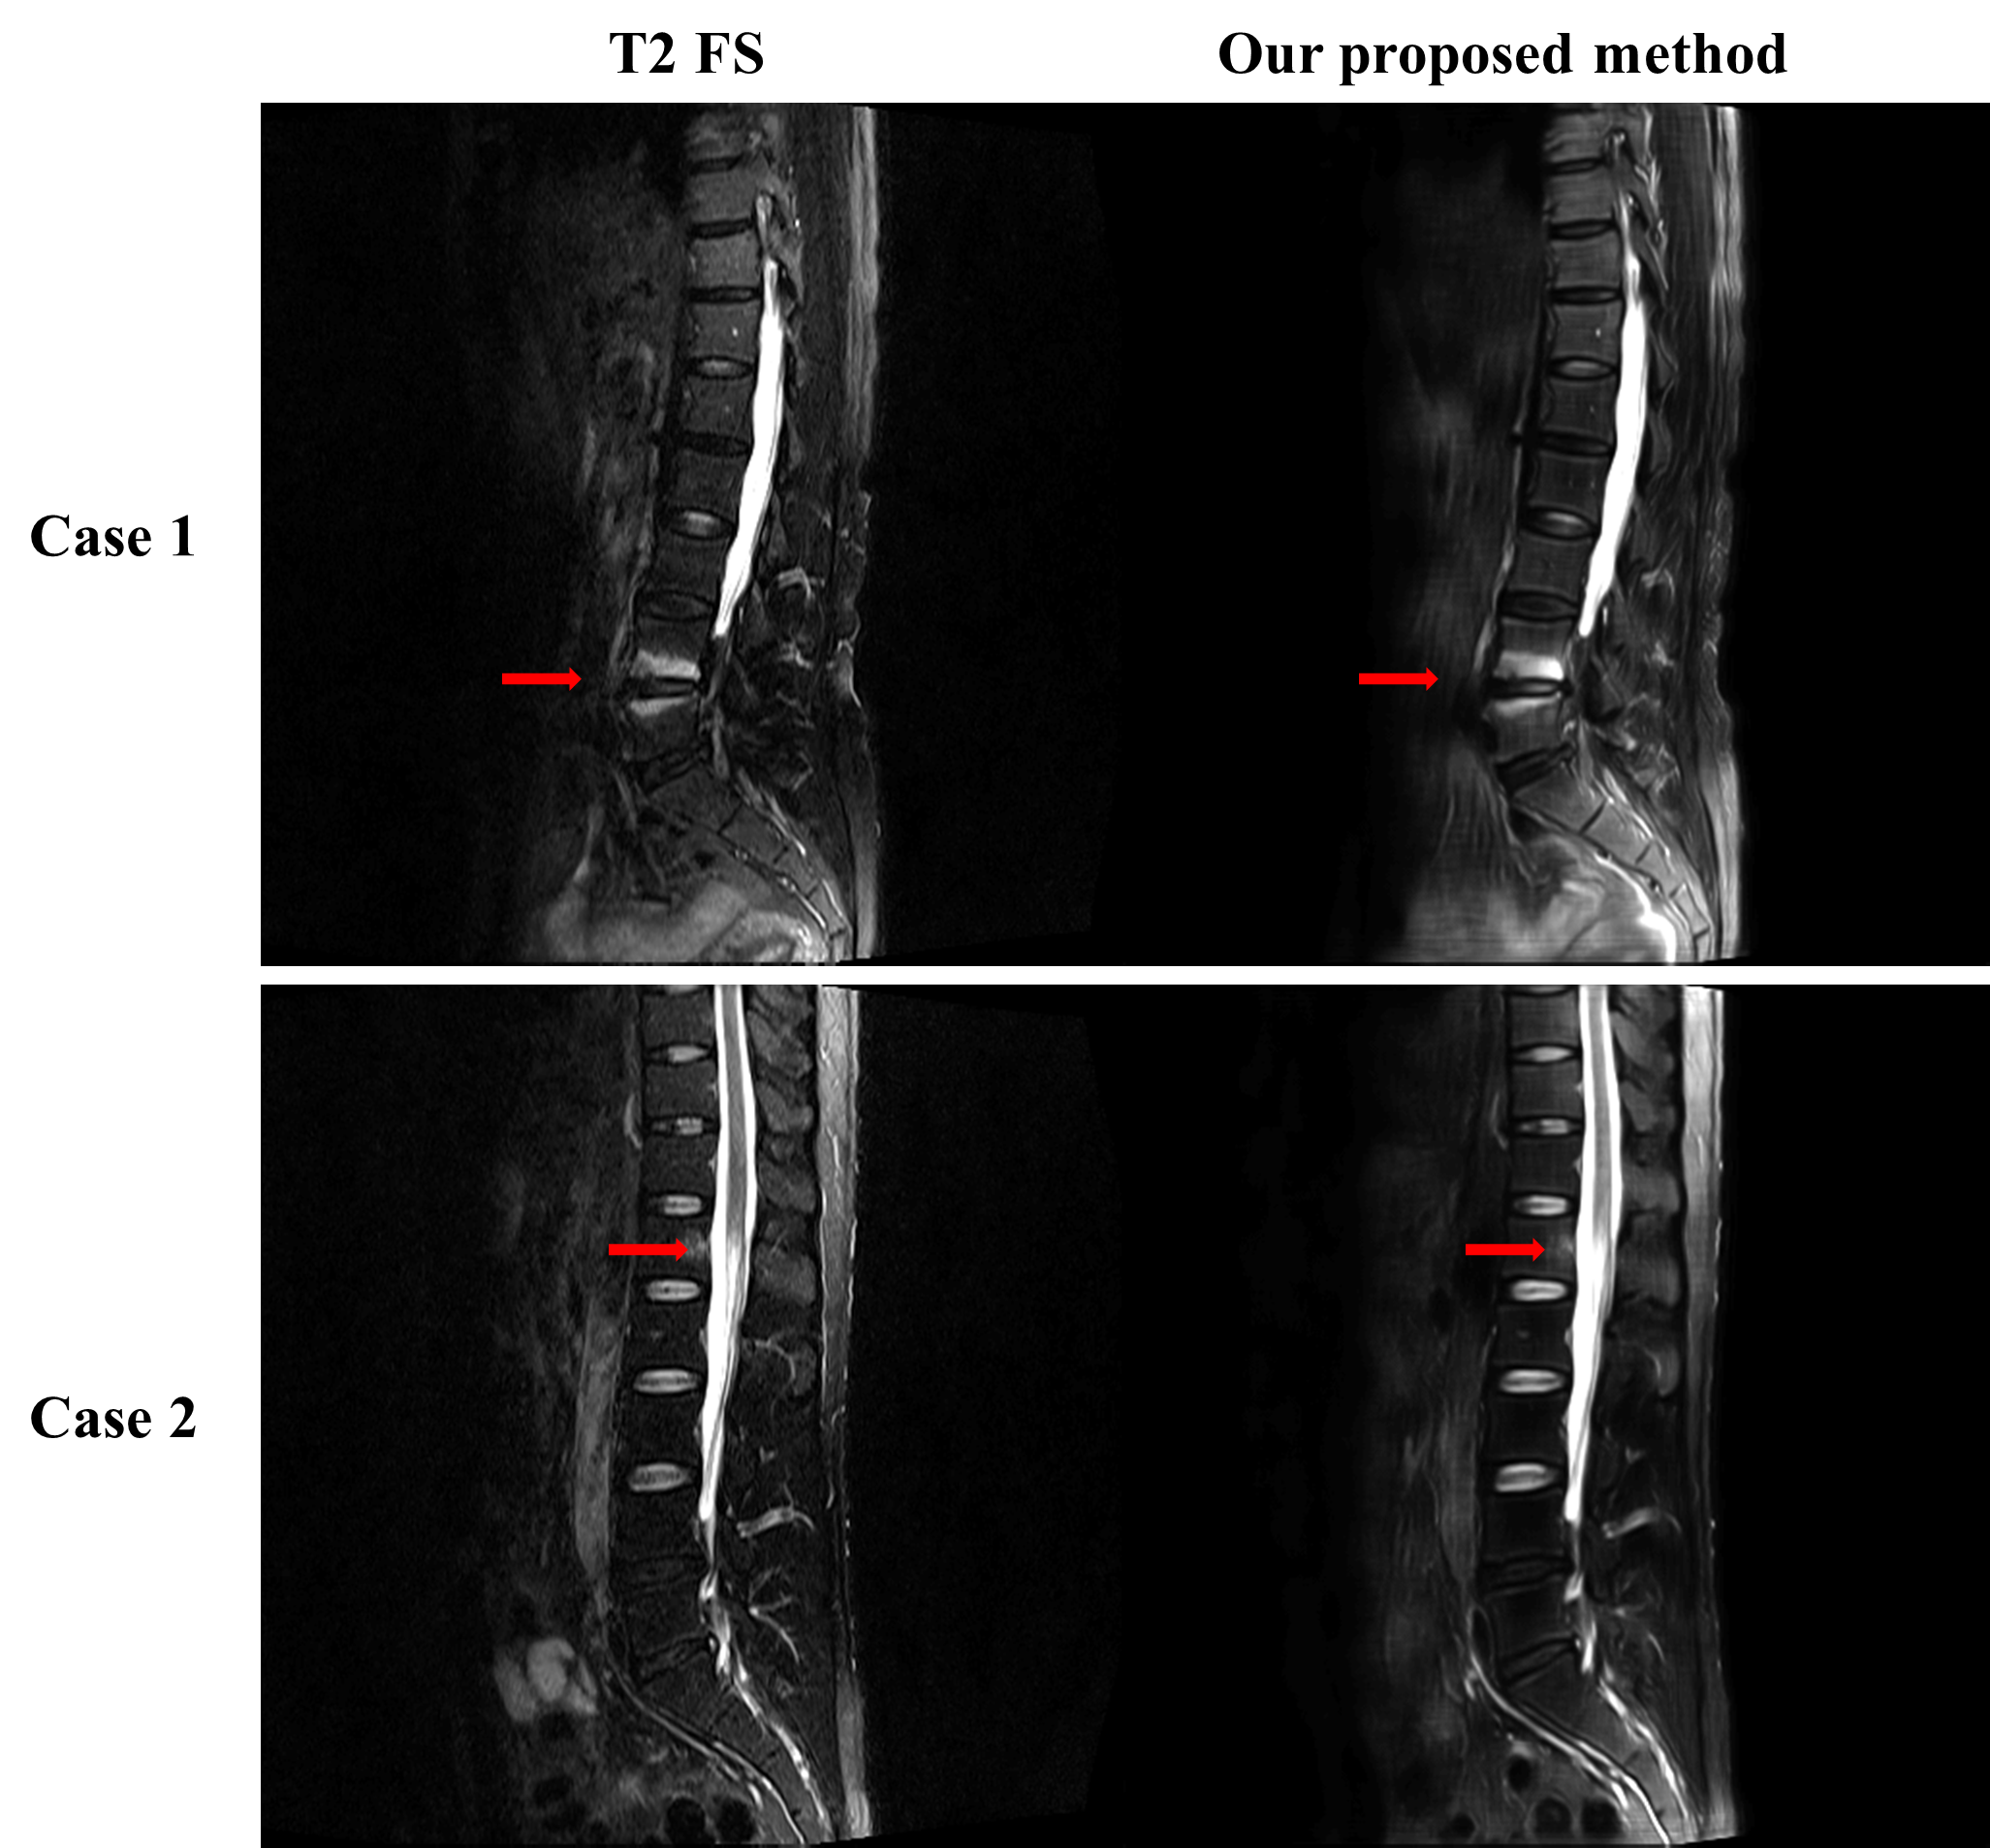
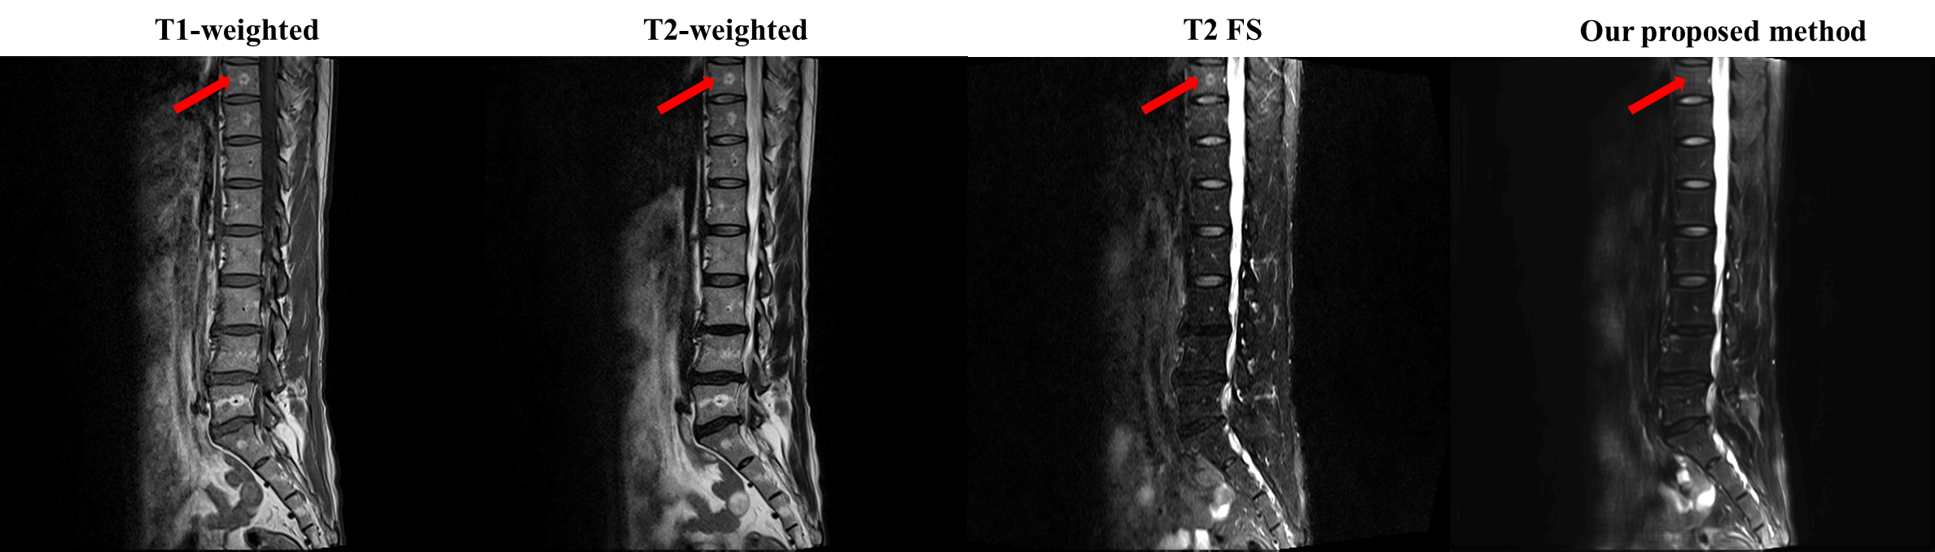
Fig. 3 and Fig. 4 show that our model accurately learns fat suppression and generates T2 FS images with bright edema regions. The arrows in Fig. 3 show the bone marrow edema regions, which is also bright in our results. Fig. 4 shows the case where the fat suppression is not properly done in the T2 FS image. On the other hand, our model correctly suppressed fat regions properly. This indicates that our model can learn the fat suppression process and may reduce artifacts that can occur in the acquired T2 FS images.
Conclusion
Our results demonstrate the feasibility of image translation using deep learning model. Our model generated T2 FS images with clinically important features from two multi-contrast inputs (T1-w, T2-w images) without additional scanning.Acknowledgements
This research was supported by Basic Science Research Program through the National Research Foundation of Korea (NRF) funded by the Ministry of Science and ICT (2019R1A2B5B01070488), Bio & Medical Technology Development Program of the National Research Foundation (NRF) funded by the Ministry of Science and ICT (NRF-2018M3A9H6081483).References
[1] Hanrahan CJ, Shah LM. MRI of spinal bone marrow: part 2, T1-weighted imaging-based differential diagnosis. American Journal of Roentgenology. 2011;197(6):1309-1321.
[2] Lee S, Choi DS, Shin HS, et al. FSE T2-weighted two-point Dixon technique for fat suppression in the lumbar spine: comparison with SPAIR technique. Diagnostic and Interventional Radiology. 2018;24(3):175.
[3] McAuliffe MJ, Lalonde FM, McGarry D, Gandler W, Csaky K, Trus BL. Medical image processing, analysis and visualization in clinical research. In: Proceedings 14th IEEE Symposium on Computer-Based Medical Systems. CBMS 2001. IEEE; 2001. p 381-386.
[4] Ye JC, Han Y, Cha E. Deep convolutional framelets: A general deep learning framework for inverse problems. SIAM Journal on Imaging Sciences. 2018;11(2):991-1048.
[5] Yang Z, Chen G, Shen D, Yap PT. Robust fusion of diffusion MRI data for template construction. Scientific reports. 2017;7(1):12950.
[6] Zhao W, Wang D, Lu H. Multi-Focus Image Fusion With a Natural Enhancement via a Joint Multi-Level Deeply Supervised Convolutional Neural Network. IEEE Transactions on Circuits and Systems for Video Technology. 2018;29(4):1102-1115.
[7] Zhao R, Zhao JJ, Dai F, Zhao FQ. A new image secret sharing scheme to identify cheaters. Computer Standards & Interfaces. 2009;31(1):252-257.
[8] Lee CC, Wu HC, Tsai CS, Chu YP. Adaptive lossless steganographic scheme with centralized difference expansion. Pattern Recognition. 2008;41(6):2097-2106.
Figures