2662
Noise Reduction of 3D Fast Spin Echo Knee Imaging Using Fusion of Convolutional Neural Networks1CUHK lab of AI in radiology (CLAIR), Department of Imaging and Interventional Radiology, The Chinese University of Hong Kong, Hong Kong, Hong Kong
Synopsis
3D FSE can be acquired with isotropic resolution and reformatted into an arbitrary plane for visualizing complex anatomic structures. However, image blurring can occur on short T2 tissues when long echo trains are used. Image deblurring may result in loss of signal-to-noise ratio (SNR). In this work, we proposed a fusion network based on CNNs to address this problem. We demonstrate this network has potential to suppress the noise and reserve structure details at the same time.
Introduction
Fast/turbo spin echo (FSE/TSE) plays a central role in clinical MRI. Three-dimensional (3D) FSE images can be acquired with isotropic resolution and reformatted into an arbitrary plane for visualizing complex anatomic structures. Commercial 3D FSE sequences typically utilize long echo trains with variable flip angle to achieve reasonable scan time without excessive blurring. As the short T2 tissues are dominant in knee joints, image blurring can be a problem if long echo trains are used. The approaches to reduce image blurring without increasing scan time, such as reducing the minimum flip angle of the echo train, often accompany with reduced signal-to-noise ratio (SNR).1 In this work, we proposed a novel method based on deep learning neural networks (CNN) to address this problem in 3D FSE.Methods
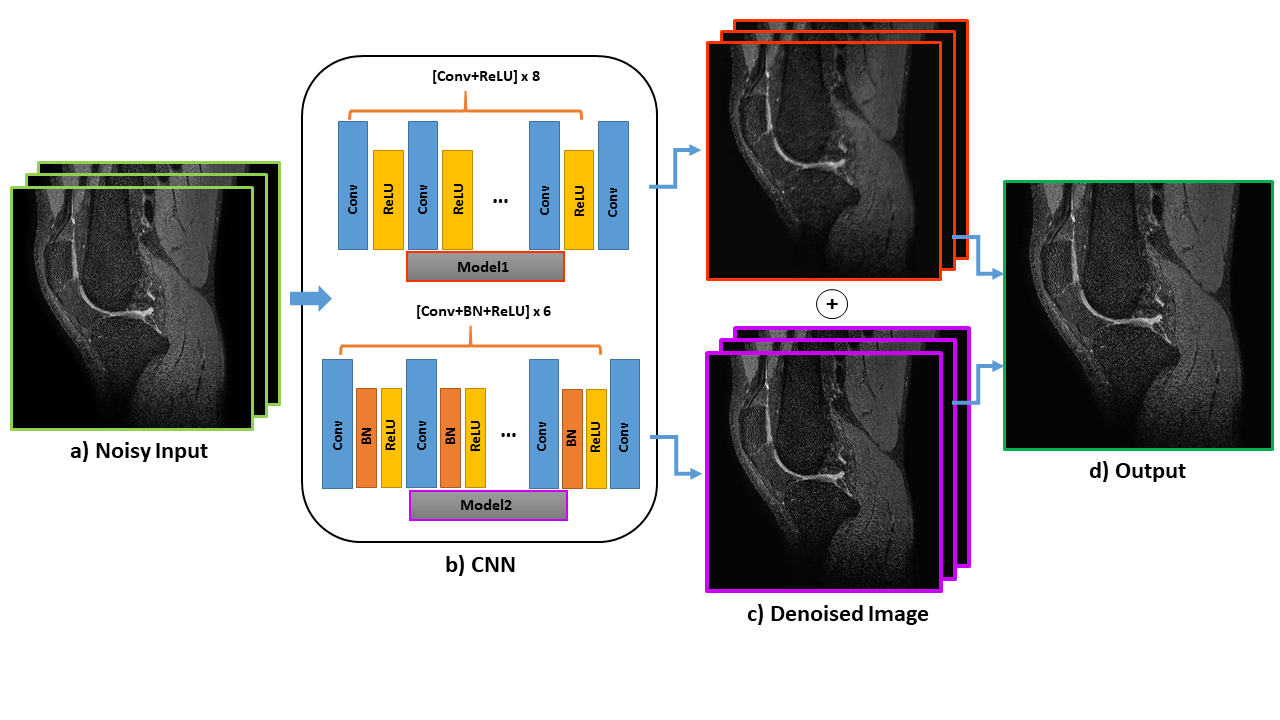
Our network is a function $$$f(X)$$$ that calculates the image differences between the noisy input $$$N_{i}$$$ and ground truth $$$G_{i}$$$:$$argmin_{f}\left \| f(N_{i})-(G_{i}-N_{i}) \right \|_{2}^{2}$$This network is trained by L2 loss and implemented on Pytorch platform.The datasets were collected from the 3D FSE/TSE VISTA pulse sequence (Philips Healthcare, Best, Netherlands). All MRI exams were conducted under the approval of the institutional review board. The low and high quality 3D FSE knee images were acquired, which were used as the input images and the target images, respectively, for network training. For high quality 3D FSE images, the imaging parameters are as follows: TR/TE 1200/30ms, 250 slices with resolution 0.5×0.5×0.5mm, ETL 30. For low quality 3D FSE images, the ETL was increased to 90. The scan time for low and high quality 3D FSE acquisition is 3.5mins and 10.5mins, respectively. In total, two knee datasets were collected for training and two other datasets were collected for testing.Figure 1 illustrates the proposed method. We used two 2D-CNNs with real and imaginary channels for training. Model 1 $$$f_{1}(X)$$$ is a 9-layer CNN and Model 2 $$$f_{2}(X)$$$ has 7 layers. Both networks include single convolution without any activation at the end of the process, to ensure both positive and negative values could be included for better evaluation of the difference between the input and the ground truth.2 The outputs of two networks are combined through square root of sum of squares (SSoS) to form the final results.$$F(N_{i})=\sqrt{\frac{f_{1}(N_{i})^{2}+f_{2}(N_{i})^{2}}{2}}$$
Results and Discussion
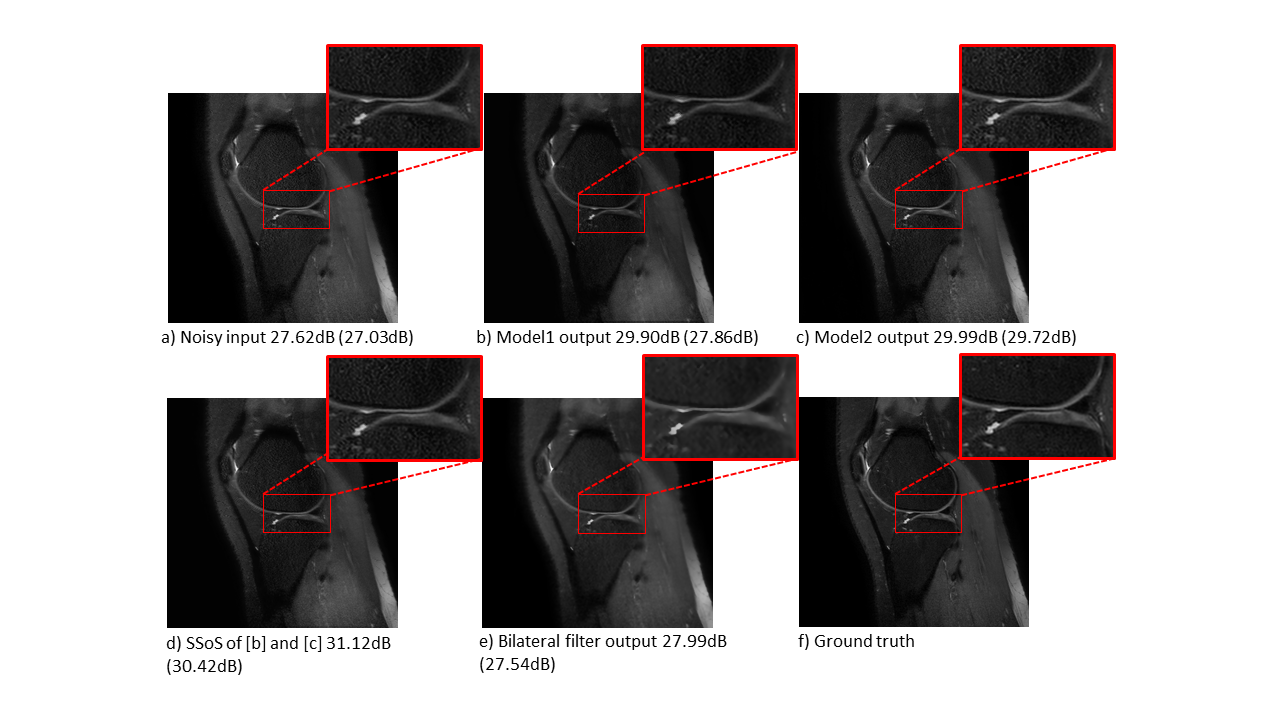
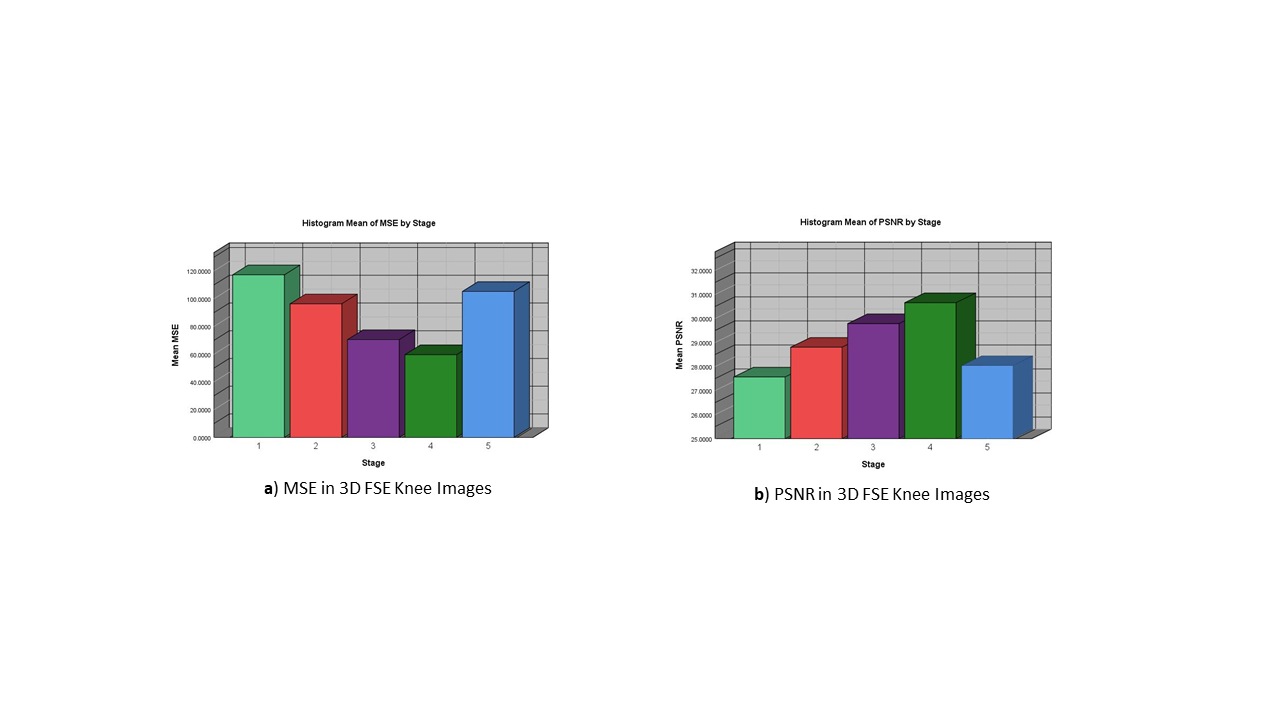
Figure 2 shows the testing results of a single slice. Figure 2(b) and (c) are the results from two models, respectively. Note Model 1 resulted in improved denoising but at the cost of exacerbated image blurring, especially in cartilages. Model 2 preserved fine structures of the image, but has inferior denoising performance compared to Model 1. The SSoS result is shown in Figure 2(d) with better denoising effect than either model. Figure 2(e) shows the result from the traditional denoising method of the bilateral filter approach3. Note the proposed network outperformed the bilateral filter approach without increasing image blurring.Figure 3 shows the comparison of the mean squared error (MSE) and peak signal-to-noise ratio (PSNR) of noisy input, the results from Model 1, Model 2, SSoS, and the bilateral filter approach. Both Model 1 and Model 2 achieved improved results (reduced MSE and increased PSNR compared to noisy input). The proposed SSoS achieved the minimum MSE and maximum PSNR among all methods compared. We performed T-test to compare MSE and PSNR among various methods. Compared to noisy 3D FSE input, the improvement by using SSoS is significant (p<0.001). The bilateral filter approach also resulted in improved MSE and PSNR. Nonetheless, compared to the bilateral filter approach, the improvement by using SSoS is also significant (p<0.001). These results demonstrate that the proposed method has potential to improve 3D FSE image quality. Note only two training datasets were used. We expect further improvement can be made by using more datasets for training.
Conclusion
The CNNs can be used to improve 3D FSE image quality. The proposed fusion process can be used to merge various CNN models for improved performance compared to using a single CNN network.Acknowledgements
This study is supported by a grant from the Innovation and Technology Commission of the Hong Kong SAR (Project MRP/001/18X), and a grant from the Research Grants Council of the Hong Kong SAR (Project SEG CUHK02).References
1.Busse R F, Hariharan H, Vu A, et al. Fast spin echo sequences with very long echo trains: design of variable refocusing flip angle schedules and generation of clinical T2 contrast[J]. Magnetic Resonance in Medicine: An Official Journal of the International Society for Magnetic Resonance in Medicine, 2006, 55(5): 1030-1037.
2.Chaudhari A S, Fang Z, Kogan F, et al. Super‐resolution musculoskeletal MRI using deep learning[J]. Magnetic resonance in medicine, 2018, 80(5): 2139-2154.
3.Chaudhari A. Denoising for magnetic resonance imaging[J]. 2016.
Figures