2660
Mapping of exercise-stimulated muscle perfusion using DCE-MRI and an artificial neural network approach1A.A. Martinos Center for Biomedical Imaging; Radiology, Massachusetts General Hospital, Charlestown, MA, United States, 2Radiology and Imaging Science, University of Utah, Salt Lake City, UT, United States, 3Department of Kinesiology, University of Massachusetts, Amherst, MA, United States, 4Institute for Applied Life Sciences, University of Massachusetts, Amherst, MA, United States, 5MGH and BWH Center for Clinical Data Science, Massachusetts General Hospital, Charlestown, MA, United States, 6Verily Life Sciences, Cambridge, MA, United States
Synopsis
We tested the feasibility of using artificial neural network (NN) to rapidly map calf-muscle perfusion, and assessed the importance of data diversity in NN training. Forty-eight DCE MRI data were collected from healthy and diseased subjects stimulated by plantar flexion. Results: the NN method was much faster than model fitting. The NN trained with diverse data gave estimates with mean absolute error (MAE) of 15.9 ml/min/100g, significantly more accurate than regular model fitting or NN trained with homogeneous data (MAE 22.3 and 24.9 ml/min/100g, P<0.001). Conclusion: properly trained NN is capable of estimating muscle perfusion with high accuracy and speed.
Introduction
Tissue-perfusion maps from DCE MRI can reveal regional tissue heterogeneity and improve the diagnosis of various pathological conditions [1-7]. For perfusion mapping, voxel-wise fitting to a tracer kinetic model is conventionally done with least-mean-square optimization. Hence, perfusion mapping is a time-consuming process that is mostly done off-line. In addition, converge to local optimum often leads to inaccurate perfusion estimates.Artificial neural network (NN) shows promise in multiple applications of medical imaging. With simple operations, NN can be easily programmed on any computer platform, and does not rely on optimization. In this study, we tested the feasibility of the NN approach for quantifying exercise-stimulated perfusion of calf muscles from DCE MRI. Different from other organs, muscle perfusion can vary dramatically with exercise intensity, pathologic condition, and even aging. To accurately estimate perfusion with such large variations, we assessed the importance of training NN with diverse data.
Materials and Methods
DCE MRI for calf musclesThis IRB-approved study recruited 13 young healthy subjects, 5 elderly healthy and 3 patients with peripheral artery disease (PAD), and used a 3T MRI scanner (TimTrio; Siemens). Calf muscles were first stimulated by plantar flexion. The exercise protocols included load of 4, 8 or 16 lbs for 3 minutes, and exercise to exhaustion [8]. For each subject, we performed MRI after two or four of the exercise protocols, so collected 48 MRI data. Immediately after exercise, dynamic images of an axial calf slice were acquired after 0.05 mmol/kg gadoteridol (Prohance; Bracco), using 2D SR-prepared turboFLASH [8]. Voxel-wise model fitting was applied to tracer concentration curves of each tissue voxel (TC) and an arterial region (AIF) [9]. The model fitting was implemented with optimization initialized with one set of parameter values (termed “regular fit”), and 25 sets of initial values (“multi-grid fit”). The 25 sets of values were the combinations of 5 perfusion values and 5 bolus arrival time values. The perfusion estimates from the multi-grid fit were used as reference values for both NN training and testing evaluation.
Training of NN for quantifying muscle perfusion
We performed the training and testing of NN in TensorFlow (version 1.13; Python 3.7.3), using a fully connected feed-forward network with 7 hidden layers and 70 nodes per layer. Each node used the rectified linear unit as the activation function. The input for the network was the vector that concatenated voxel TC and AIF, and the output was perfusion value. Two groups of data were separately used for training: a) a diverse group of 20 MRI data including 2 young healthy subjects (each stimulated by 4 different exercises), 4 elderly healthy subjects and 2 PAD patients (each by 2 different exercises); b) a homogeneous group of 20 data including 10 young healthy subjects (each repeated a same exercise twice). Both the trained networks were tested on the remaining 8 data sets that included 1 young healthy subject (stimulated by 4 different exercises), 1 elderly healthy subject and 1 PAD patient (stimulated by 2 exercises). Using the perfusion values from multi-grid fit as reference, mean absolute error (MAE) and correlation coefficient (R) were computed for the estimates by each estimation method.
Results
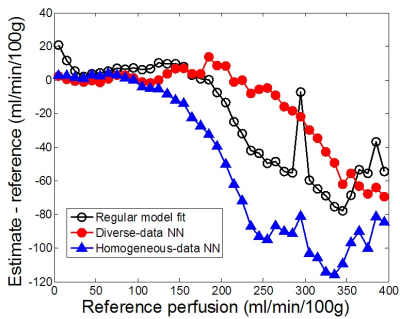
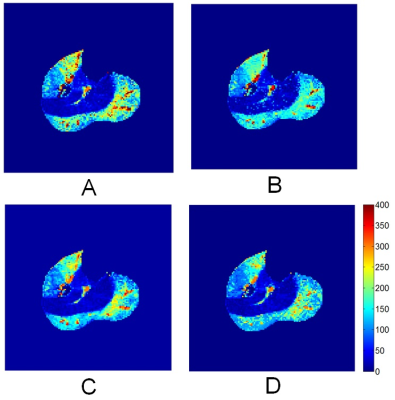
Compared to the reference values, the regular-fit estimates differed by MAE of 22.3 ml/min/100g and correlation coefficient R of 0.889. The NN trained by the diverse group performed significantly better with lower MAE of 15.9 (P value<0.001) and higher R 0.949. The NN trained with homogeneous data gave error (MAE 24.9; R 0.850) significantly higher than the other two methods (P value <0.001). While all the three methods gave estimates with low error for perfusion less than 100 ml/min/100g (Figure 1), the NN trained with diverse data outperformed the other two methods substantially in estimating higher perfusion values.For a same dataset, perfusion maps were generated by all the four methods (Figure 2). To generate the map, the multi-grid fit took 79 minutes 34 seconds, the regular fit 2 minutes 41 seconds, and the NN methods each took less than 1 second. All the activated muscle groups, including medial and lateral gastrocnemius and anterior tibial muscles, and even the arterial regions inside the muscles were accurately enhanced in the map generated by the NN method (Figure 2C).
Discussion
With the NN method, perfusion maps of 8 testing data (about 25,000 voxels) were generated almost instantaneously, and the estimates were comparable to the values from multi-grid fit that took about 70-80 minutes for each data set. For NN training, the diverse group included all three types of subjects: young healthy, elderly healthy and PAD, and each subject was stimulated by exercise of at least two different intensities. In contrast, the homogeneous group included only 20 young healthy subjects, stimulated by a same exercise only. This result indicates that to estimate tissue perfusion accurately with the NN method, training data should match to those of the target data, or the more diverse the collection of the training data, the more robust the network.In conclusion, the NN method is capable of providing perfusion estimates with comparable accuracy as conventional model fitting, and its extremely fast implementation would make real-time perfusion mapping possible.
Acknowledgements
No acknowledgement found.References
1. Mazaheri Y, Akin O, Hricak H. Dynamic contrast-enhanced magnetic resonance imaging of prostate cancer: A review of current methods and applications. World journal of radiology. 2017;9(12):416-25.
2. Bernstein JM, Homer JJ, West CM. Dynamic contrast-enhanced magnetic resonance imaging biomarkers in head and neck cancer: potential to guide treatment? A systematic review. Oral oncology. 2014;50(10):963-70.
3. Nielsen G, Fritz-Hansen T, Dirks CG, Jensen GB, Larsson HB. Evaluation of heart perfusion in patients with acute myocardial infarction using dynamic contrast-enhanced magnetic resonance imaging. J Magn Reson Imaging. 2004;20(3):403-10.
4. Pack NA, DiBella EV. Comparison of myocardial perfusion estimates from dynamic contrast-enhanced magnetic resonance imaging with four quantitative analysis methods. Magn Reson Med. 2010;64(1):125-37.
5. Lee VS, Rusinek H, Johnson G, Rofsky NM, Krinsky GA, Weinreb JC. MR renography with low-dose gadopentetate dimeglumine: feasibility. Radiology. 2001;221(2):371-9.
6. Vivier PH, Storey P, Rusinek H, et al. Kidney function: glomerular filtration rate measurement with MR renography in patients with cirrhosis. Radiology. 2011;259(2):462-70.
7. Yamamoto A, Zhang JL, Rusinek H, et al. Quantitative evaluation of acute renal transplant dysfunction with low-dose three-dimensional MR renography. Radiology. 2011;260(3):781-9.
8. Zhang JL, Layec G, Hanrahan C, et al. Exercise-induced calf muscle hyperemia: quantitative mapping with low-dose dynamic contrast enhanced magnetic resonance imaging. American journal of physiology Heart and circulatory physiology. 2019;316(1):H201-H11.
9. Dennis Cheong LH, Tchoyoson Lim CC, Koh TS. Dynamic contrast-enhanced CT of intracranial meningioma: comparison of distributed and compartmental tracer kinetic models--initial results. Radiology. 2004;232(3):921-30.
Figures

