2659
External validation of a machine learning algorithm for differentiating between myelodysplastic syndromes and aplastic anemia1Department of Diagnostic Radiology, Hiroshima University Hospital, Hiroshima, Japan, 2Department of Radiology, Tokushima University, Tokushima, Japan, 3Department of Radiology, Hiroshima Red Cross Hospital, Hiroshima, Japan
Synopsis
An MRI-based predictive model was built to differentiate between myelodysplastic syndrome (MDS) and aplastic anemia (AA). The conventional multiparametric MRI provided correct diagnosis with a support vector machine model at accuracies up to 78.0% with a combination of age, fat fraction, and platelet count. In an external validation, the LeNet model achieved an accuracy of 80.0%, sensitivity of 80.0%, specificity of 81.7%, and AUC of 0.860 for T1WI and an accuracy of 65.6%, sensitivity of 65.6%, specificity of 65.3%, and AUC of 0.667 for STIR images. The machine learning algorithm proved effective for differentiating MDS from AA.
INTRODUCTION
Aplastic anemia (AA) is characterized by hypoplastic bone marrow (BM) with profound reduction in hematopoietic stem/progenitor cells, which leads to defective mature blood cell production and peripheral pancytopenia1. Myelodysplastic syndromes (MDSs) are a group of myeloid neoplasms characterized by peripheral blood cytopenia and increased risk of leukemic evolution. Although chemotherapy for MDS can prolong survival, once the response to these agents is lost, the prognosis is very poor. The BM in MDS is usually hyper- or normocellular, but in some patients, the BM is hypocellular2. Distinguishing between these entities can be problematic because clinical and morphologic differences in the BM may be subtle.This research built an MRI-based predictive model to differentiate between AA. and MDS using a machine learning algorithm.
METHODS
Patients with histologically confirmed MDS (n=25) or AA (n=30) were retrospectively investigated under an IRB approved protocol.The patients were scanned using a 3-T system (Ingenia, Philips Healthcare) equipped with head, anterior torso array, and integrated posterior coils for a whole-body MRI examination. For the whole spine, sagittal T1 turbo fast spin-echo-weighted imaging (TE/TR = 10/404, bandwidth/pixel size = 576, voxel size = 1.4×2.7×4 mm) and sagittal STIR imaging (TE/TR/TI = 70/5693/200, bandwidth/pixel size = 625, voxel size 1.5×2.2×4 mm) were performed. For the lumbar spine, single-shot spinal DWI (9 b-values from 0 to 2000, TE/TR = 84/8000, bandwidth/pixel size = 2024, voxel size 2.7×2.7×4 mm) was performed. Mean ADC, kurtosis, and skewness were calculated from the mean signal intensity of the regions of interest (ROIs) within the BM of L1-L3 without a fracture. The three parameters of perfusion fraction, pseudo-ADC, and true ADC were calculated using a biexponential model from the same ROIs. On whole-body coronal modified DIXON sequence (six evenly spaced echoes, TR = 5.7, bandwidth/pixel size = 128, voxel size 2.4×2.4×6 mm), mean fat fraction (FF) was calculated from the same ROIs.
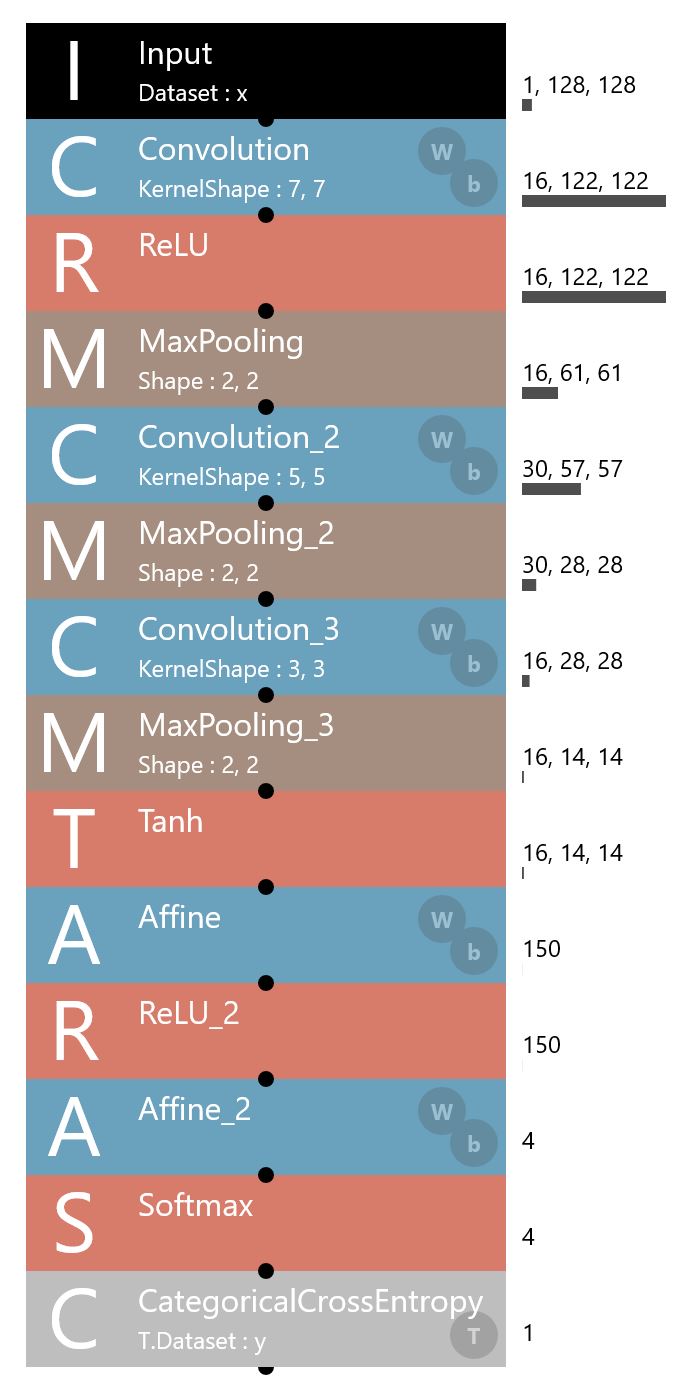
First, we used three machine-learning approaches, including logistic regression, random forest, and support vector machine (SVM) models for the classification task to differentiate the entities. Model inputs included indices calculated from DWI, FF, and whole blood test data, including white blood cell count, hemoglobin level, platelet count, reticulocyte percentage, and serum ferritin level. We used 10-fold cross-validation to prevent overfitting. Second, we compiled datasets of the lumbar T1WI and STIR images. We used three images (mid-sagittal, bilateral para-mid-sagittal images) for each sequence. Data augmentation was performed by frontal horizontal axis rotations that considered sacral slope. We used the training dataset to fine-tune a multilayer LeNet model3, which consisted of three sets of convolutional, activation, and pooling layers and a softmax classifier (Figure 1). The LeNet model with a categorical cross-entropy loss function and an Adam optimizer with an initial learning rate of 0.001 provided automated diagnosis. Third, external validation of our trained model was performed using MRI examinations obtained with a different 3-T system (Discovery MR750W, General Electric) from an independent cohort of 35 unique patients in a different hospital. Lastly, the diagnostic performances of a radiology fellow, experienced musculoskeletal radiologist, and senior hematologist with pancytopenia expertise were calculated.
RESULTS
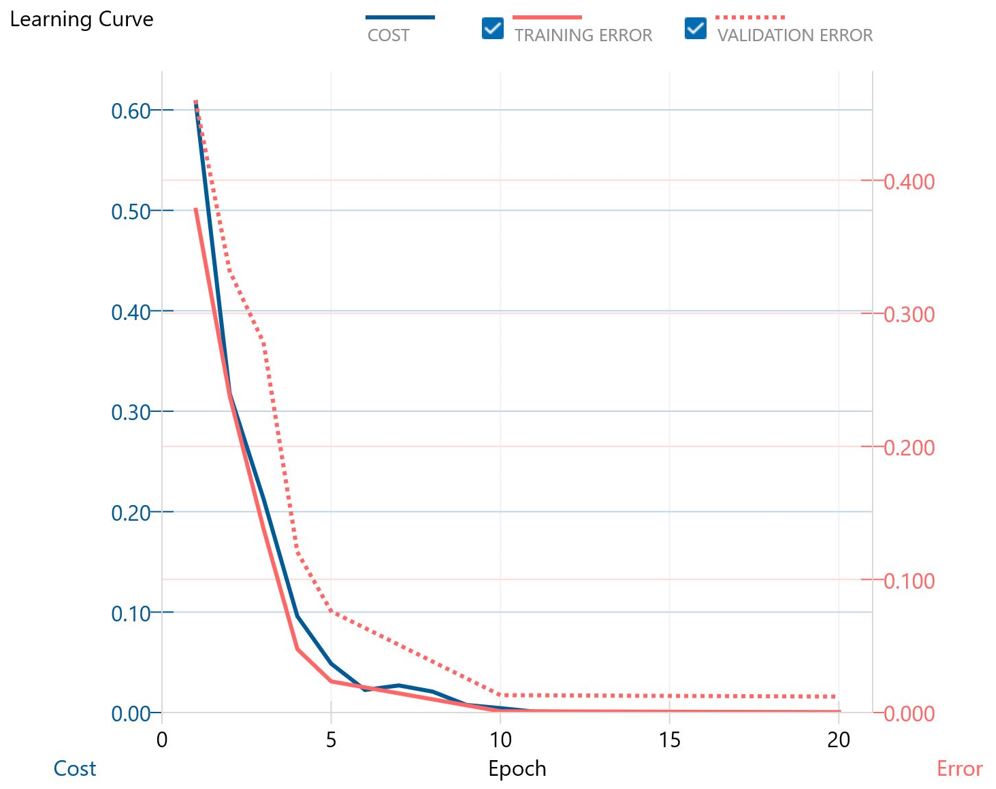
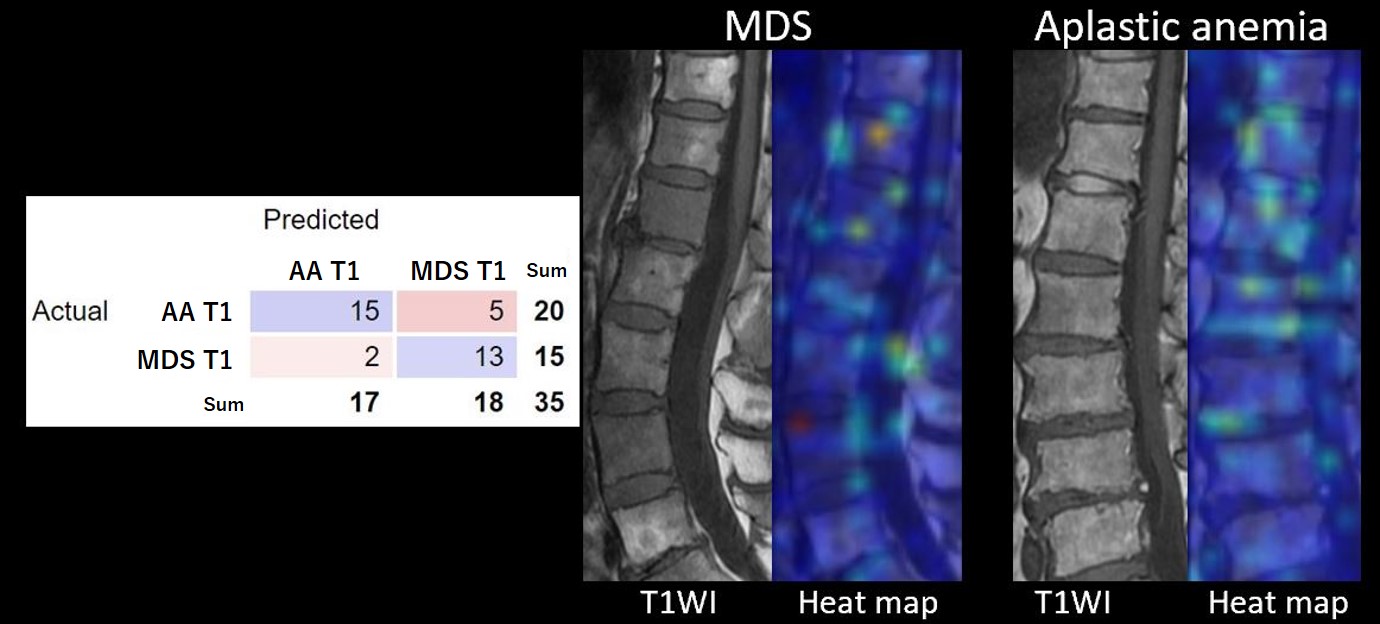
For the 55 patients, the algorithm by conventional multiparametric MRI predicted diagnosis correctly by the SVM model with the highest accuracies of 78.0% with a combination of features of age, FF, and platelet count.The accuracy achieved by the LeNet model on a random sampling with 80% of the training set size with 30 iterations was 93.8% for T1WI and 88.9% for STIR images (Figure 2). In the external validation experiment, this LeNet model achieved an accuracy of 80.0%, sensitivity of 80.0%, specificity of 81.7%, and AUC of 0.860 for T1WI. For STIR images, an accuracy of 65.6%, sensitivity of 65.6%, specificity of 65.3%, and AUC of 0.667 was obtained. In general, misclassifications were caused by signal intensity and heterogeneity within the BM. Figure 3 shows a confusion matrix and representative heat maps for T1WI.
The fellow, radiologist, and hematologist respectively attained 60%, 66%, and 66% accuracy for T1WI and 39%, 65%, and 45% accuracy for STIR images.
DISCUSSION
The LeNet model provided better differentiation between MDS and AA than conventional clinical and multiparametric MRI or visual inspection by human observers.In the multiparametric analysis, age, FF of lumbar BM, and platelet count proved useful for differentiation of the two entities, which is consistent with the nature of the disease.
The accuracies in differentiating between the two entities were higher with T1WI than with STIR images for both visual inspection by human observers and the LeNet model. We believe that this result was mainly because STIR images have a low signal-to-noise ratio. On the other hand, hematopoietic BM or ineffective erythropoiesis might have been more conspicuous on T1WI than STIR images against the high signal of fatty BM.
CONCLUSION
A machine learning algorithm proved effective for differentiating MDS from AA. The LeNet model was internally validated on the training set and subsequently externally validated on the test set obtained with a different MRI system. Machine learning may help to provide accurate prognostic information and appropriate intervention.Acknowledgements
References
1. Luzzatto L, Risitano AM. Advances in understanding the pathogenesis of acquired aplastic anaemia. Br J Haematol. 2018; 182(6):758–777.
2. Maschek H, Kaloutsi V, Rodriguez-Kaiser M, et al. Hypoplastic myelodysplastic syndrome: incidence, morphology, cytogenetics, and prognosis. Ann Hematol. 1993; 66(3):117-122.
3. Lecun Y, Bottou L, Bengio Y, et al. Gradient-based learning applied to document recognition. Proc IEEE. 1998; 86(11):2278–2324.
Figures