2657
Generalizability of Deep-Learning Segmentation Algorithms on Independent Datasets for Measuring T2 Relaxation Times1Radiology, Stanford University, Palo Alto, CA, United States, 2Bioengineering, Stanford University, Palo Alto, CA, United States, 3Mechanical Engineering, Stanford University, Palo Alto, CA, United States, 4Philips Healthcare North America, Gainesville, FL, United States, 5Electrical Engineering, Stanford University, Palo Alto, CA, United States
Synopsis
Automated segmentation using deep learning can potentially expedite segmentation tasks. However, the generalizability of such algorithms on new unseen datasets is unknown. To test this generalizability, we used a knee segmentation algorithm trained on Osteoarthritis Initiative double-echo steady-state (DESS) datasets to segment cartilage from quantitative DESS datasets from three independent studies. We compared manual-automatic segmentation accuracy and the resultant qDESS T2 map variations. These results quantitatively demonstrate that a deep learning network trained on a single dataset does not generalize with a high accuracy to additional datasets even with similar image characteristics, and that additional fine-tuning may be needed.
Introduction
Osteoarthritis (OA) of the knee is one of the leading causes of chronic disability and has no known treatment or cure. Cartilage morphology and T2 relaxation times have shown potential in detecting changes during early cartilage degeneration1-3. Recently, the quantitative double-echo steady-state (qDESS) sequence has been shown to simultaneously and rapidly generate accurate T2 relaxometry and morphometry measurements4,5. However, to obtain cartilage T2 maps, cartilage must first be segmented from the MR image. Manual segmentation is the current gold-standard but is a time-consuming and error-prone process6.Deep-learning-based tools for automatic segmentation provide potential to expedite the segmentation process7,8. Many such algorithms have been trained on DESS scans from the OAI9. Despite these algorithms achieving high segmentation accuracies on the OAI DESS datasets, the generalizability of such deep-learning methods on independent datasets with different MRI vendors, and similar (but not identical) contrasts and resolution has not been validated.
In this study, we use DOSMA (deep open source musculoskeletal analysis), a knee segmentation framework trained on OAI DESS datasets, to evaluate the generalizability of segmenting cartilage from qDESS datasets10. We evaluate the variations in cartilage T2 values obtained from automated segmentations and manual segmentations in three independent studies to ascertain the generalizability of deep-learning-based segmentation tools.
Methods
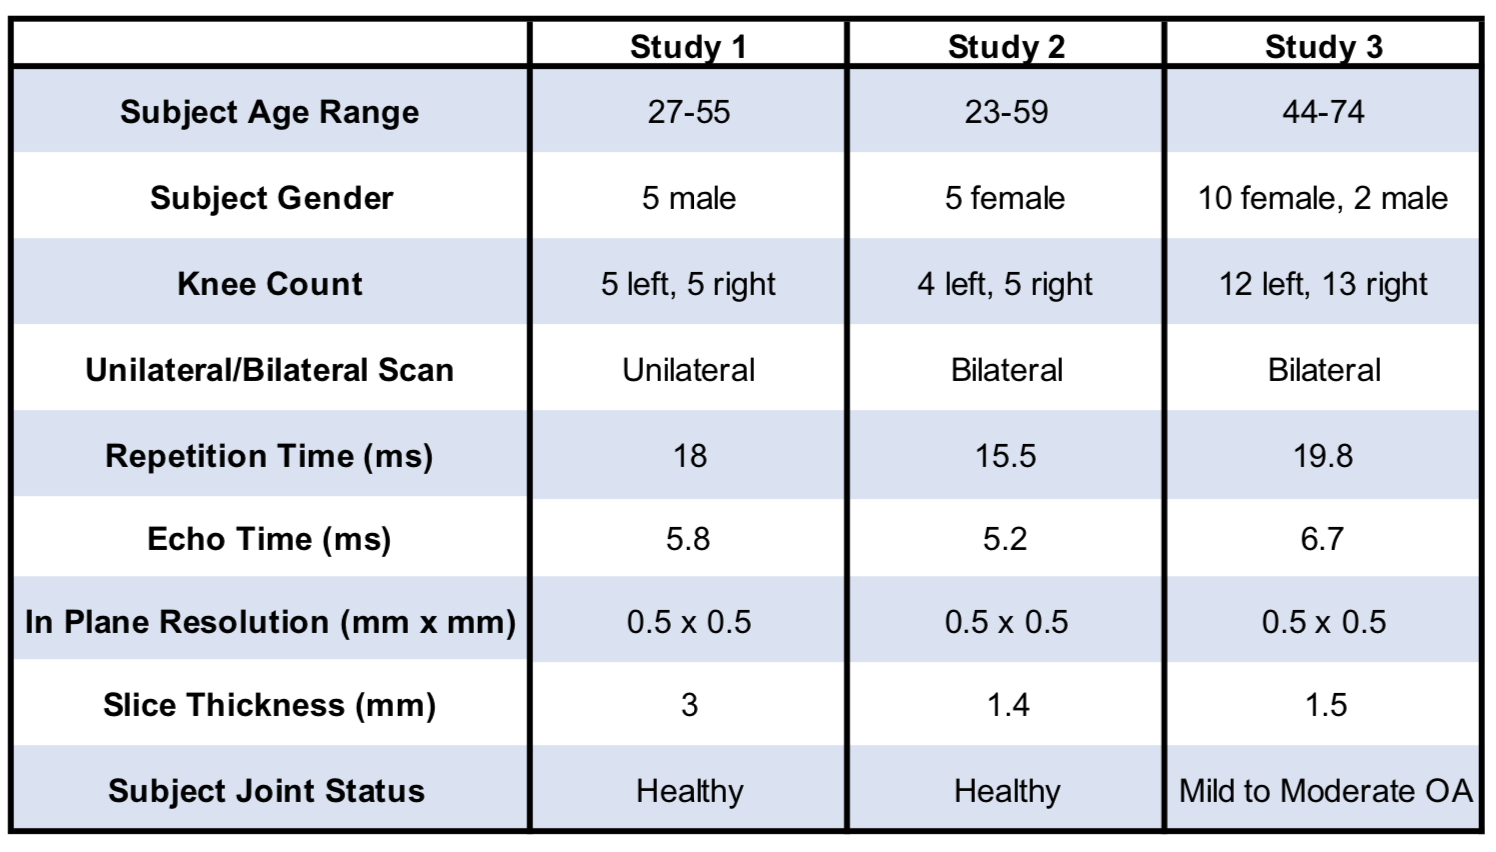
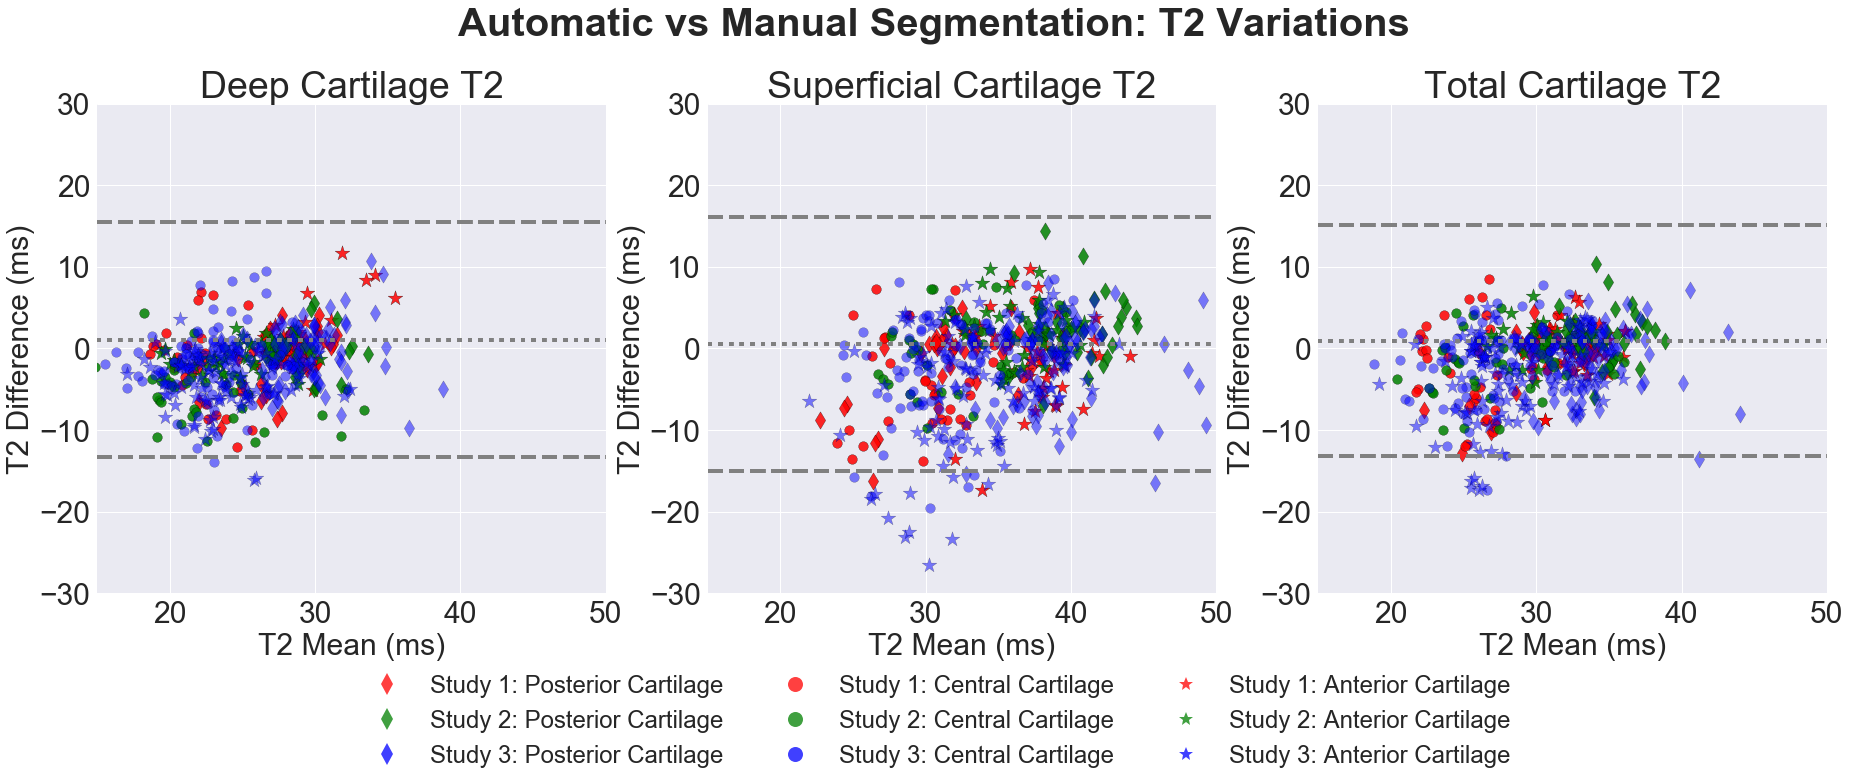
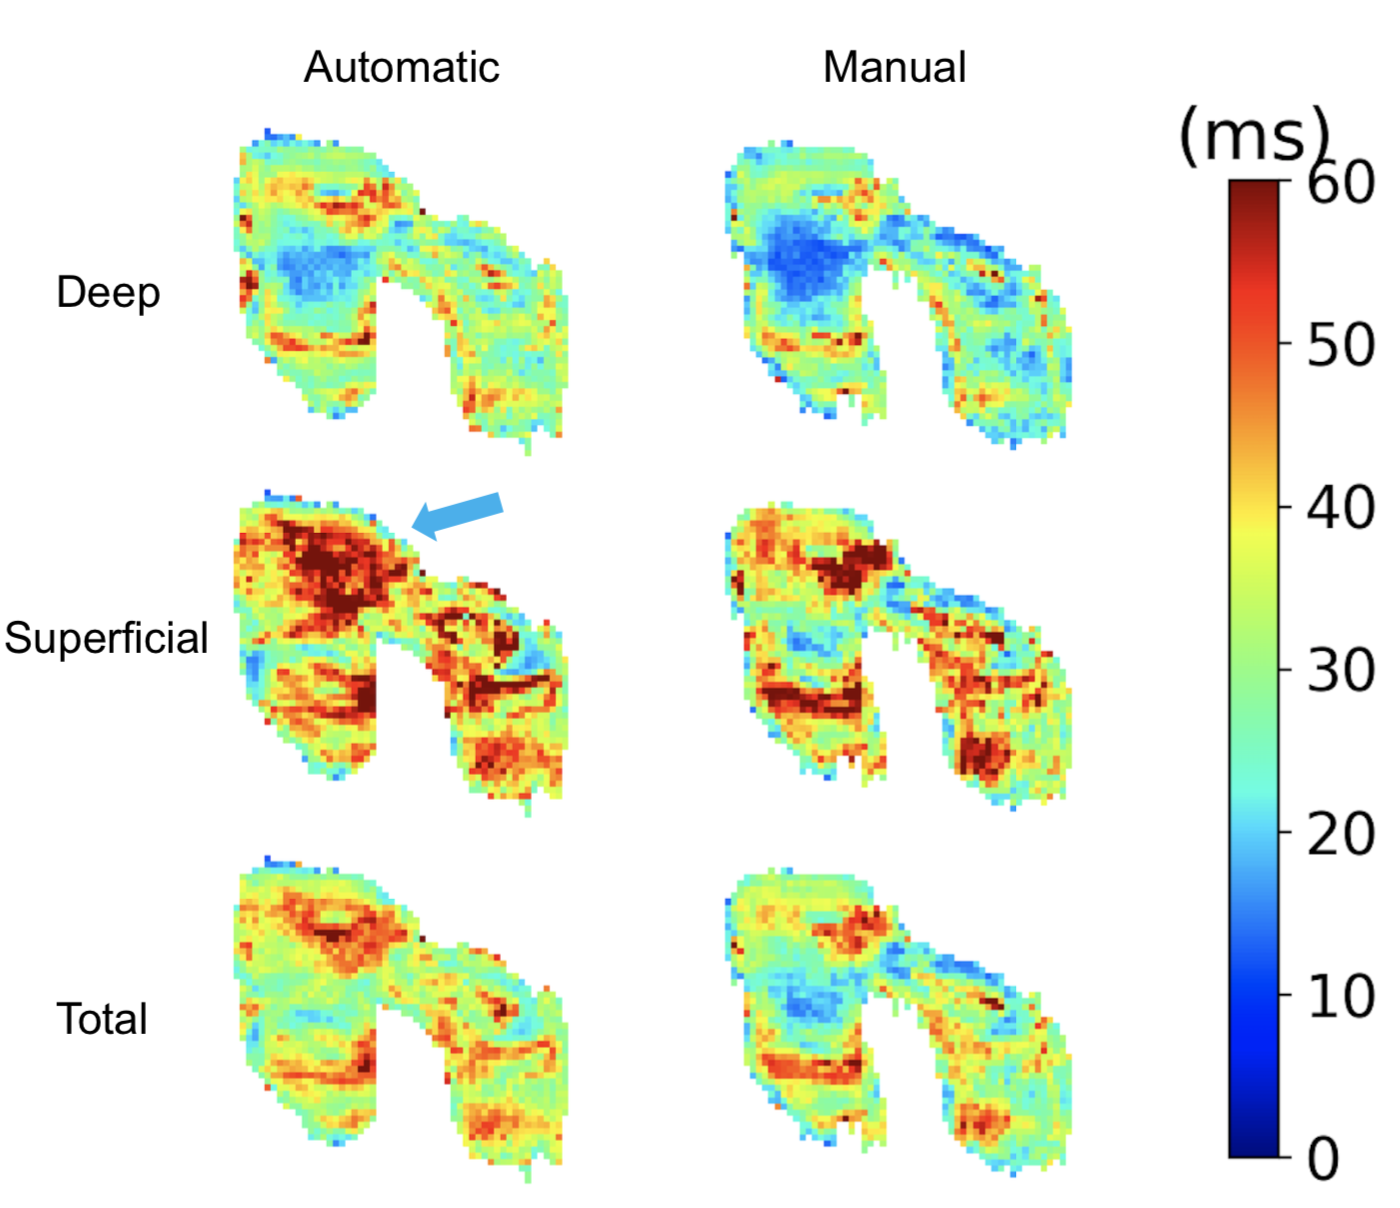
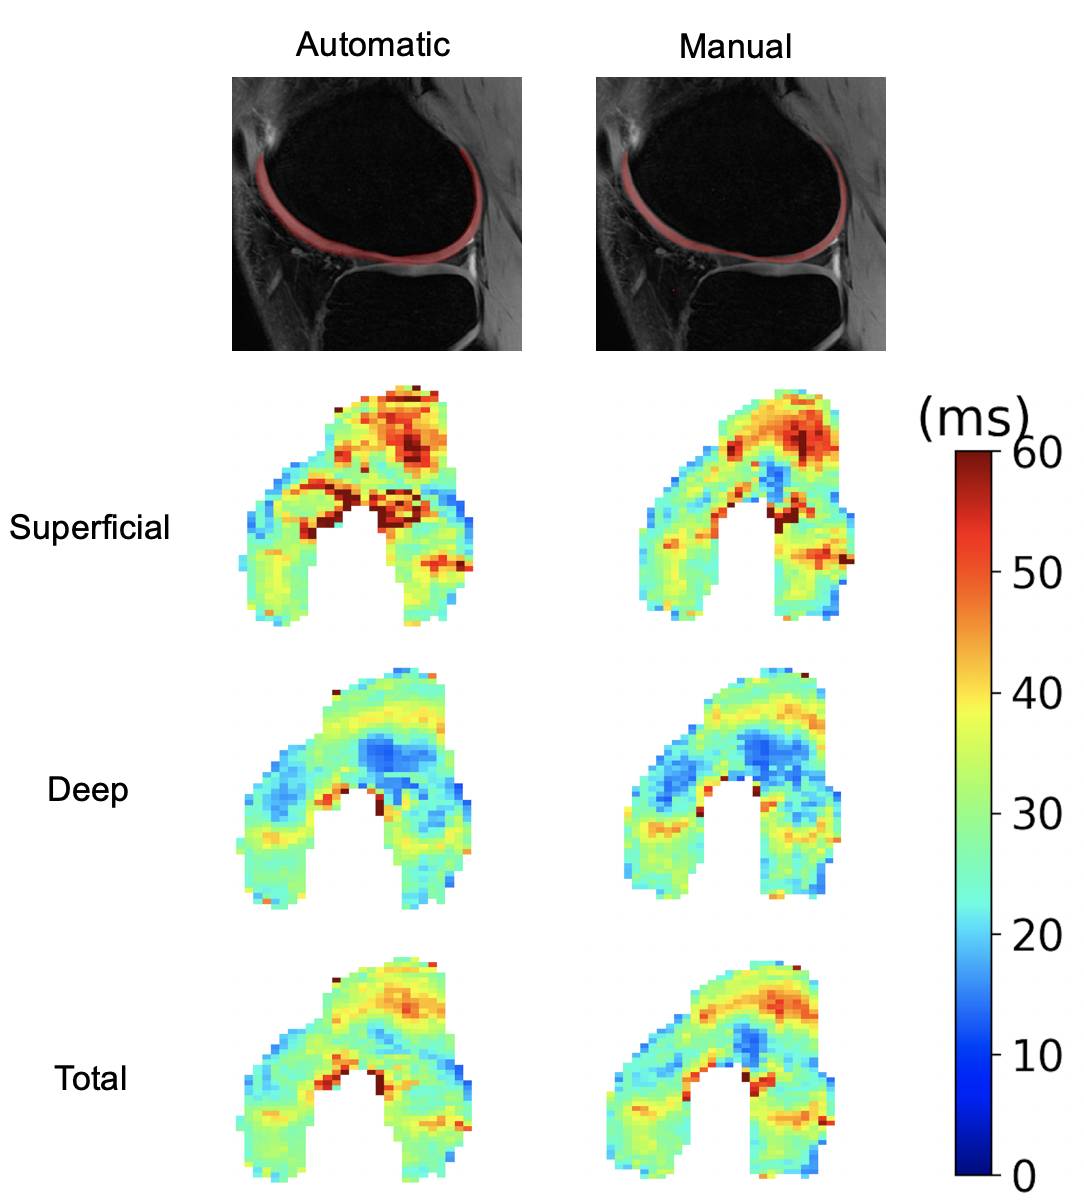
The evaluation dataset was acquired from three studies that varied in subject health and slightly in image acquisition parameters. All images were acquired using a sagittal qDESS pulse sequence. Studies 1 and 2 involved healthy subjects, whereas study 3 included subjects with OA with Kellgren-Lawrence (KL) grades of 1-3. Scans for studies 1 and 2 were performed on a 3.0T MRI scanner (GE Healthcare, Waukesha, Wisconsin), and scans for study 3 were performed on a 3.0T PET/MRI hybrid system (GE Healthcare, Milwaukee, WI). The femoral cartilage in each study was segmented by a different trained reader. For all studies, DOSMA was used to automatically segment femoral cartilage, to generate T2 maps for all manual and automatic segmentations, and to automatically divide the cartilage into anterior, posterior, and central sub-regions for superficial and deep cartilage.The volumetric Dice score (DSC) was used to assess pixel-wise segmentation accuracy between the expert-segmented manual segmentations and the automatic segmentations. T2 values averaged over the sub-regions described above were compared between the manual and automatic segmentation methods. Manual-automatic segmentation variations were quantified with the Wilcoxon rank-sum test, Lin’s Concordance Correlation Coefficient (CCC), root-mean-squared error coefficient of variation (RMSE-CV%), and Pearson correlation coefficient. To visualize variations between manual and automatic T2 values, Bland-Altman plots were created separately for sub-regions within deep, superficial, and total cartilage layers.
Results
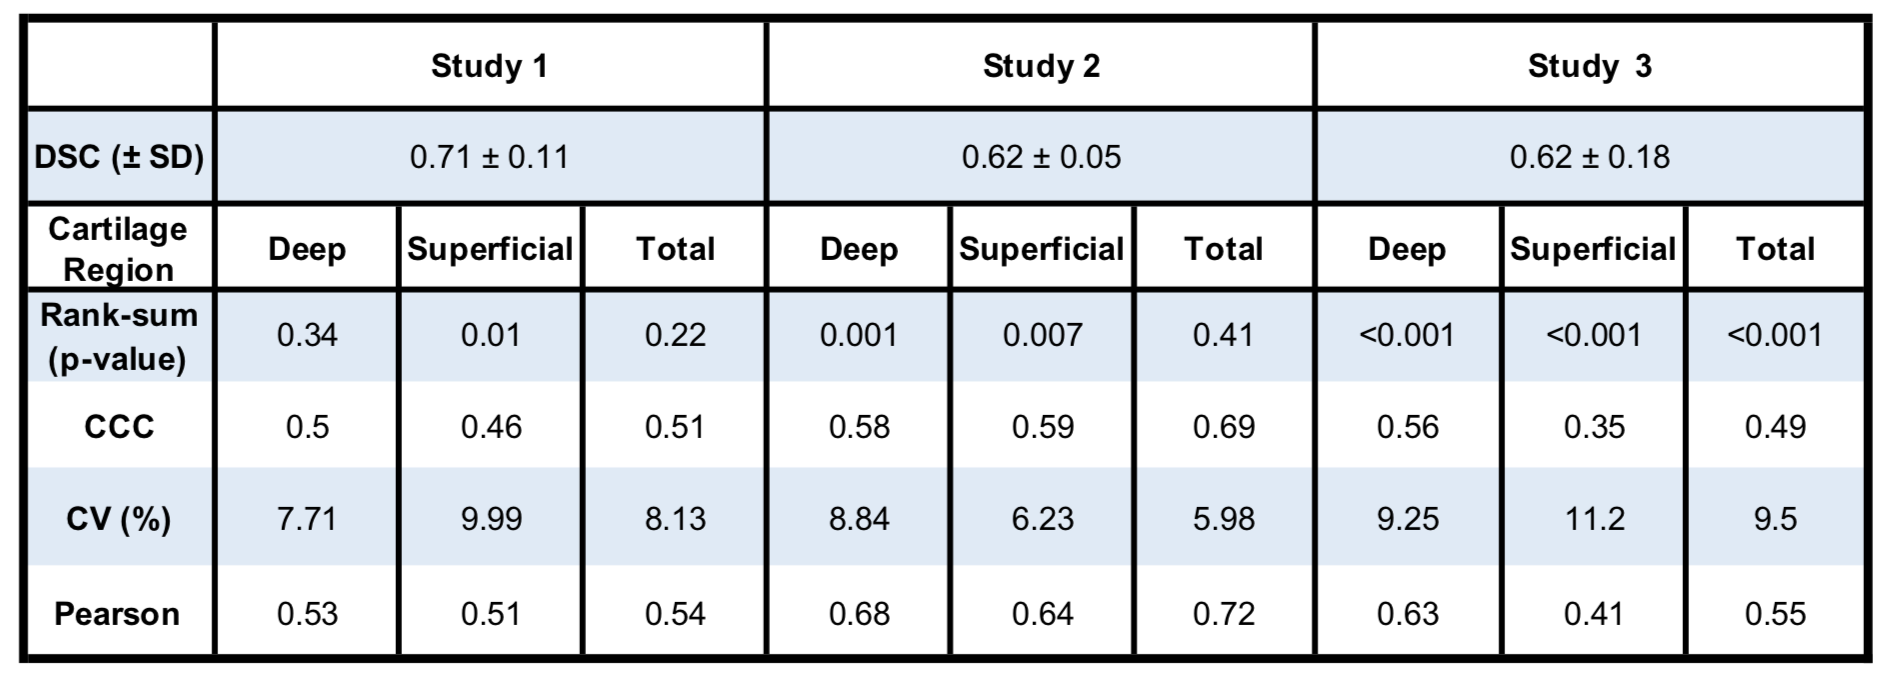
42 total knees were included in this analysis. Studies 1-3 had DSC scores of 0.71±0.11, 0.62±0.05, and 0.62±0.18 respectively. The Bland-Altman plots comparing manual and automatic segmentations showed smaller 95% limits of agreement (LoA) for the deep cartilage compared to the superficial, independent of the anatomical region.The most significant differences in T2 between manual and automatic segmentations were seen in global T2 for study 3 (p<0.001). Significant differences were also seen in T2 in the superficial region for study 1 (p<0.05), and the superficial and deep layers of study 2 (p<0.01). No consistent trends were evident in variations between the deep and superficial regions across the studies or between anatomical regions (anterior, central, and posterior) or for the deep and superficial layers.
CCC and Pearson correlation values ranged between 0.35-0.72, with a majority around 0.5, indicating moderate agreement. RMSE-CV ranged between 6-11% for all studies and all regions of cartilage.
Discussion
Compared to the segmentation performance on the OAI DESS dataset (91% Dice accuracy), the segmentation accuracy was considerably lower on qDESS9. This suggests that despite having a similar contrast and resolution, this deep learning segmentation network has lower generalizability when translated to unseen image sets.The LoA for qDESS T2 were comparable to the current state-of-the-art segmentation model that was trained on quantitative MRI, despite DOSMA never having been trained on qDESS11.
Study 1 had likely the highest signal-to-noise ratio (SNR) (thickest slices and shortest TR) of the three studies and the best performance in segmentation accuracy and T2 manual-automatic variations, indicating DOSMA might be best translated to image sets with high SNR. The statistically significant differences between the three studies may also suggest different tendencies for segmentations amongst different readers. Moreover, study 3 had the lowest performance and included subjects with OA, which may likely be a contributing factor to higher T2 manual-automatic variations. Future studies with multiple readers and a range of OA incidence may help differentiate the cause of the variations.
The variations between T2 from the manual and automatic segmentations suggest that to maintain higher accuracy, deep learning algorithms may be not suitable to use as an ‘out-of-the-box’ approach and may have to be fine-tuned to datasets of interest. Previous studies have shown that domain adaptation with even two cases can help increase segmentation accuracy12.
Conclusion
Using data from three independent studies, we quantitatively demonstrate the performance loss of a deep learning network trained on a single dataset when generalized to additional datasets with similar image characteristics. This decreased performance loss may be mitigated by fine-tuning even on a small training corpus.Acknowledgements
We would like to acknowledge our funding sources: National Institutes of Health (NIH) grant numbers NIH R01 AR063643, R01 EB002524, K24 AR062068, and P41 EB015891. GE Healthcare, Philips, and Stanford Medicine Precision Health and Integrated Diagnostics.References
1. Dardzinski BJ, Mosher TJ, Li S, Van Slyke MA, Smith MB: Spatial variation of T2 in human articular cartilage. Radiology 1997; 205:546–550.
2. Mosher TJ, Dardzinski BJ, Smith MB: Human articular cartilage: influence of aging and early symptomatic degeneration on the spatial variation of T2--preliminary findings at 3 T. Radiology 2000; 214:259–266.
3. David-Vaudey E, Ghosh S, Ries M, Majumdar S: T2 relaxation time measurements in osteoarthritis. Magn Reson Imaging 2004; 22:673–682.
4. Matzat SJ, McWalter EJ, Kogan F, Chen W, Gold GE: T2 Relaxation time quantitation differs between pulse sequences in articular cartilage. J Magn Reson Imaging 2014; 00:105–113.
5. Chaudhari AS, Black MS, Eijgenraam S, et al.: Five-minute knee MRI for simultaneous morphometry and T 2 relaxometry of cartilage and meniscus and for semiquantitative radiological assessment using double-echo in steady-state at 3T. J Magn Reson Imaging 2018; 1328–1341.
6. Eckstein, F., Kwoh, C. K., & Link, T. M. (2014). Imaging research results from the Osteoarthritis Initiative (OAI): A review and lessons learned 10 years after start of enrolment. Annals of the Rheumatic Diseases. 2014; 73:1289-1300.
7. Liu F, Samsonov A, Chen L, Kijowski R, Feng L: SANTIS: Sampling-Augmented Neural neTwork with Incoherent Structure for MR image reconstruction. Magn Reson Med 2019; 82:1890–1904.
8. Pedoia V, Norman B, Mehany SN, Bucknor MD, Link TM, Majumdar S: 3D convolutional neural networks for detection and severity staging of meniscus and PFJ cartilage morphological degenerative changes in osteoarthritis and anterior cruciate ligament subjects. J Magn Reson Imaging 2019; 49:400–410.
9. Peterfy, C. G., Schneider, E. & Nevitt, M. The osteoarthritis initiative: report on the design rationale for the magnetic resonance imaging protocol for the knee. Osteoarthr. Cartil. 16, 1433–1441 (2008).
10. Desai, A. D., Barbieri, M., Mazzoli, V., Rubin, E., Black, M. S., Watkins, L., … Chaudhari, A. S. (2019). DOSMA: A deep-learning, open-source framework for musculoskeletal MRI analysis. Proc. International Society for Magnetic Resonance in Medicine, Montreal, 1135.
11. Norman B, Pedoia V, Majumdar S: Use of 2D U-Net Convolutional Neural Networks for Automated Cartilage and Meniscus Segmentation of Knee MR Imaging Data to Determine Relaxometry and Morphometry. Radiology 2018; 000:172322.
12. Toews A, Fang Z, Black M, Jee J.H, Gold
G, Hargreaves B, and Chaudhari A.
Automated Knee Cartilage Segmentation
with Very Limited Training Data: Combining Convolutional Neural Networks with
Transfer Learning. Intl Soc Magn Reson Med (201), Paris, 2018.
Figures