2656
Convolutional neural network automatic global segmentation of thigh muscle water-fat images in neuromuscular diseases1NMR Laboratory, Neuromuscular Investigation Center, Institute of Myology, Paris, France, 2NMR Laboratory, CEA/DRF/IBFJ/MIRCen, Paris, France, 3United Institute for Informatics Problems, National Academy of Sciences, Minsk, Belarus, 4Consultants for Research in Imaging and Spectroscopy, Tournai, Belgium
Synopsis
Manual segmentation of skeletal muscles in quantitative NMRI studies is a laborious task. In this work, deep learning using a convolutional neural network (CNN) was applied for segmenting the global thigh segment and assessing the muscle fatty replacement over 1 year in patients with several neuromuscular pathologies. A series of 425 Dixon data sets, obtained at 3 T, were used for this purpose. Dice coefficients of 0.97 were obtained when comparing manual and CNN based segmentation. Standardized response means for the fat fraction evolution over 1 year using CNN were at least as high as results obtained with manual segmentation.
Introduction
With the growing use of quantitative NMRI (qNMRI) in the assessment of disease status and progression in neuromuscular disorders1, the question remains whether one specific muscle, a muscle group or the whole segment has to be taken into consideration for a longitudinal evaluation. A comprehensive comparative analysis between different manual segmentation methods including a global segmentation approach in eight different neuromuscular diseases (including muscular dystrophies, inflammatory myopathies and metabolic muscle diseases) has demonstrated that the ‘global’ approach was in many cases as sensitive and sometimes even more sensitive than individual or muscle group analysis, when assessing muscle fatty replacement over the course of one year2,3. Furthermore, the use of deep learning neural networks in the segmentation of skeletal muscle has been the topic of many recent studies4-8. In this work, we compared the performance in terms of standardized response mean (SRM) between global manual segmentation and global automatic segmentation using deep learning.Methods: Quantitative NMRI data
The qNMRI data used for this comparison was based on 425 Dixon data sets from nine different neuromuscular diseases (Duchenne muscular dystrophy/DMD, inclusion body myositis/IBM, GNE myopathy, immune-mediated necrotizing myositis, spinal muscular atrophy/SMA, dysferlinopathy, limb-girdle muscular dystrophy type 2I, facioscapulohumeral dystrophy and Pompe disease), obtained on a 3T clinical Trio/Prisma Siemens system, at the level of the thigh. Dixon qNMRI existed of a 3D gradient echo sequence with TEs of 2.75/3.95/5.15 ms, a TR of 10 ms, a flip angle of 3°, a spatial resolution of 1x1x5 mm3 and a 448x224x64 matrix size.Methods: Skeletal muscle segmentation
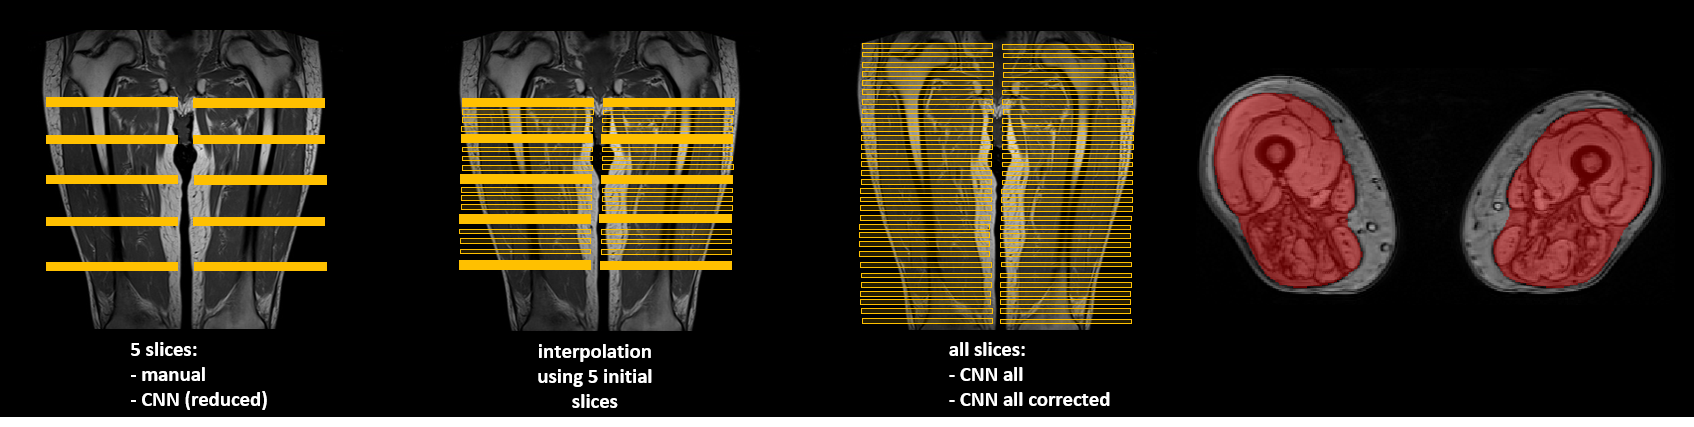
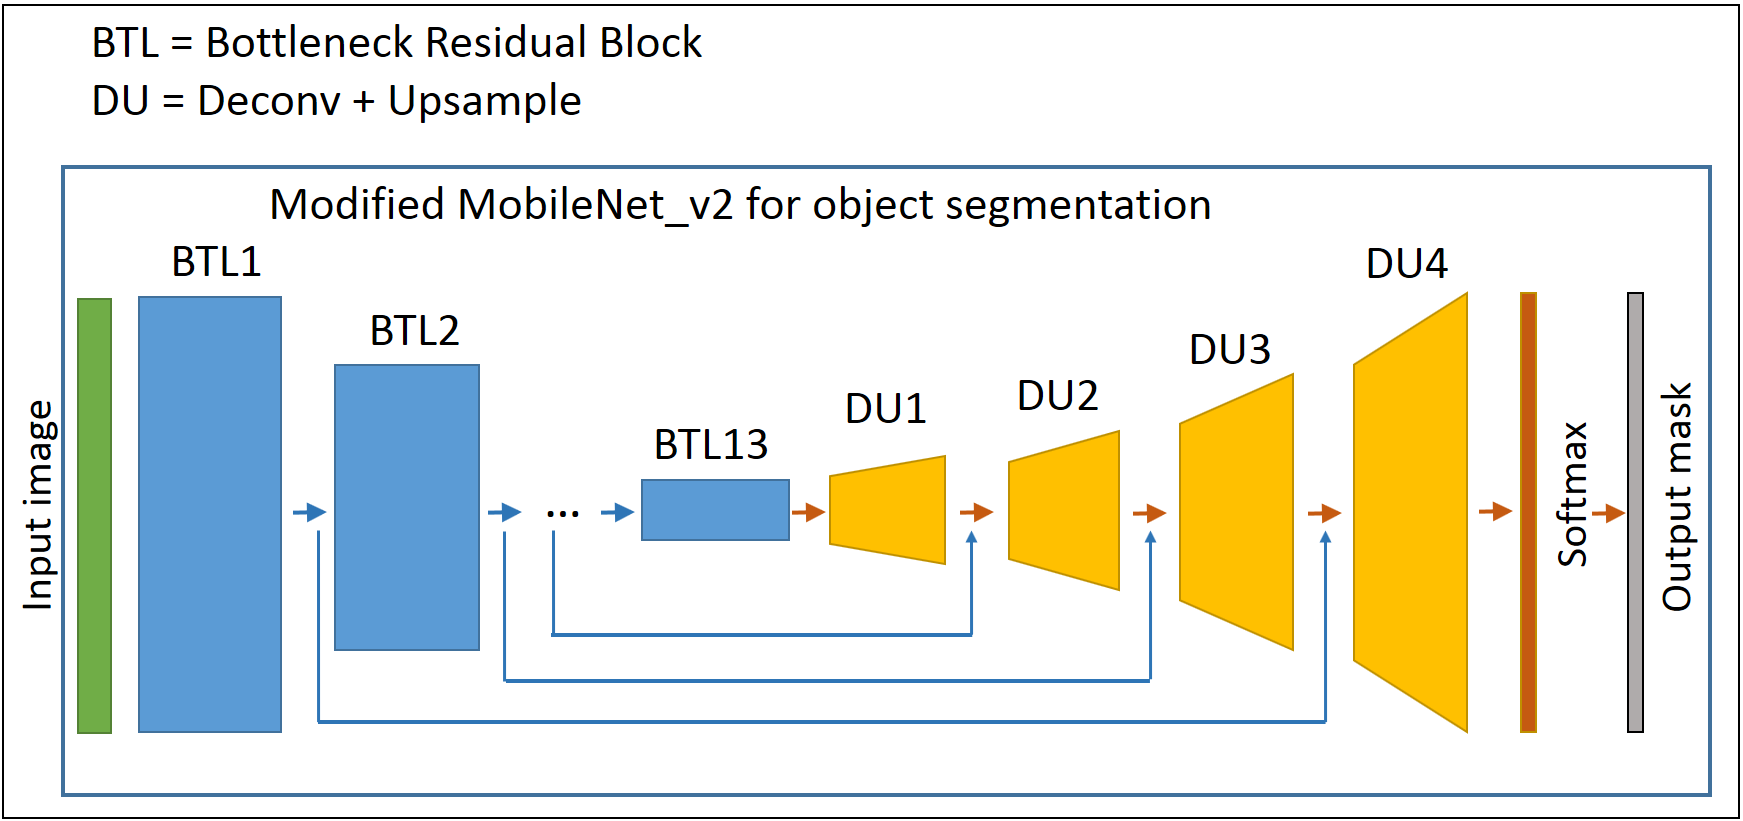
First, global manual segmentation was performed on 5 slices using the out-of-phase image (TE=3.95 ms) and included the femur (Fig. 1). For DMD and SMA patients, additional segmentation was done excluding the femur. In a next step, an interpolation algorithm was applied to obtain a volume between the 1st and 5th manually segmented slice, in order to gather more input information, assuming that the shape of muscles changes smoothly from slice to slice (Fig. 1). Then, a convolutional neural network (CNN) was applied on the data, composed of an encoder part, which is MobileNet v2 without fully-connected layers9, and a decoder part consisting of up-sampling layers and a soft maximum classifier at the end (Fig. 2). MobileNet v2 has recently proven to show a comparable classification accuracy as compared to larger well-known CNNs, while being much faster during training and inference phases.The learning process consists in calculating the optimal encoder and decoder weights based on the training samples. Data augmentation was applied during the training phase to get even more training data and for this purpose rotational and random elastic nonlinear transforms were used to obtain slightly deformed samples of the initial qNMR images and corresponding segmentation masks. The training phase was performed on the 425 out-of-phase (OPh) Dixon images (TE=3.95 ms) and the reconstructed fat (F) and water (W) images. Using three images instead of one, input values for CNN were calculated as a combination of values derived from these three images. We used both Keras 2.2.4, Tensorflow 1.13 Python libraries as well as cuda 10.2. The training phase took 4 hours using an NVidia GTX 1080 (Pascal architecture/2560 CUDA cores/8Gb of VRAM). For the testing part, the segmentation of one volume (64 slices) took 18 seconds on average. Here, we used two test sets, DMD and IBM, which implied that the training sets excluded DMD and IBM data, respectively. The segmentation accuracy was measured using the Dice coefficient, manual and automatic segmentation in the 5 initially manually drawn global regions of interest.Methods: Standardized response mean and statistical analysis
Muscle fat fraction (FF) values at baseline and year-1 and the corresponding SRMs were determined for 17 inclusion body myositis (IBM) (67 years old, 59-71 years old, 10 male) and 7 Duchenne muscular dystrophy patients (12 years old; 10-13 years old; 7 male), using all methods: manual, interpolated, CNN in the 5 slices, CNN of the whole volume, and the CNN of the whole volume corrected for errors (i.e. CNN segmentation was visually assessed and erroneous segmented slices were removed); with and without femur. A Friedman non-parametric statistical test was used to compare the different automatic segmentation approaches to the manual segmentation method (P<0.05).Results
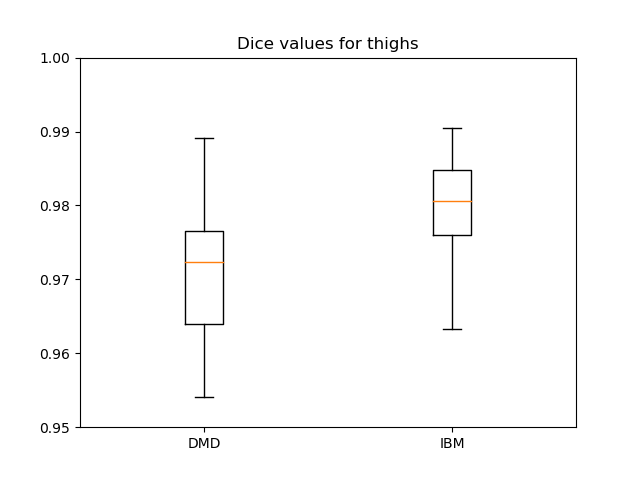
Dice coefficients for comparing manual and CNN-based segmentation including the femur were 0.97±0.02 and 0.98±0.01 for DMD and IBM, respectively; whereas excluding the femur resulted in 0.96±0.02 and 0.96±0.01 for DMD and IBM, respectively (Fig. 3). Tables 1 and 2 give an overview of the results using the different segmentation approaches. SRM values were ≥0.8 for all methods with very similar ΔFF values between manual and CNN-based segmentation, both in DMD and IBM. There were no significant differences in ΔFF between the automatic and manual segmentation approaches. Although the overall CNN results included errors, especially at the levels of the iliac crest and the upper patella, the uncorrected CNN segmentation SRM results were closer to the ground truth (i.e. manual segmentation) than when correcting the overall CNN-based segmentation.Conclusion
CNN-based global segmentation of the whole thigh segment resulted in very similar results as compared to the manual segmentation with even slightly improved sensitivity to change, as illustrated here in two different neuromuscular disorders (i.e. DMD and IBM).Acknowledgements
The contributions of Jean-Marc Boisserie and Julien Le Louër are greatly acknowledged.References
1Carlier PG, Marty B, Scheidegger O, Loureiro de Sousa P, Baudin P-Y, Snezhko E, et al. Skeletal muscle quantitative nuclear magnetic resonance imaging and spectroscopy as an outcome measure for clinical trials. J Neuromuscul Dis. 2016;3(1):1–28.
2Reyngoudt H, Boisserie J-M, Le Louër J, Koumako C, Marty, Carlier PG. How to segment muscle images using qNMRI to obtain the highest discriminant power in natural history studies of muscle diseases in adult patients? Proc. ISMRM 1348.
3Reyngoudt H, Boisserie J-M, Le Louër J, Koumako C, Baudin P-Y, Wong B, et al. Which muscle segmentation approach to use for obtaining the highest discriminate power in natural history neuromuscular diseases using quantitative NMRI? Neuromuscul Dis. 2019,29(S1):S153-S154.
4Snezhko E, Carlier PG, Azzabou N, Baudin PY. Automatic muscle groups segmentation on NMR images based on deep learning techniques. J Neuromuscul Dis. 2017,4(S1):S32.
5Ghosh S, Ray N, Boulanger P. A structured deep-learning based approach for the automated segmentation of human leg muscle from 3D MRI. Proc IEEE Int Conf Comput Vis. 2017:117-123.
6Mesbah S, Shalaby AM, Stills S, Soliman AM, Willhite A, Harkema SJ, et al. Novel stochastic framework for automatic segmentation of human thigh MRI volumes and its applications in spinal cord injured individuals. PLoS One. 2019, 14(7): e0219810.
7Amer R, Nassar J, Bendahan D, Greenspan H, Ben-Eliezer N. Automatic segmentation of muscle tissue and inter-muscular fat in thigh and calf MRI images. Med Image Comput Comput Assist Interv. 2019,11765:219-227.
8Li H, Luo H, Yunpeng L. Paraspinal muscle segmentation based on deep neural network. Sensors. 2019, 19(12): e2650.
9Sandler M, Howard A, Zhu M, Zhmoginov A, Chen L-C. MobileNetV2: Inverted residuals and linear bottlenecks. Proc IEEE Comput Soc Conf Comput Vis Pattern Recognit. 2018:4510-4520.
Figures