2655
Texture Analysis of T2-weighted Lumbar Spine MRI Predicts Presence of Low Back Pain1Research Unit of Medical Imaging, Physics and Technology, University of Oulu, Oulu, Finland, 2Medical Research Center, University of Oulu and Oulu University Hospital, Oulu, Finland, 3Department of Diagnostic Radiology, Oulu University Hospital, Oulu, Finland
Synopsis
We applied texture analysis to T2-weighted MRI of the lumbar spine in a population-based sample. The extracted features were used in a logistic regression pipeline to predict whether the subjects (N=200) suffered from clinically relevant low back pain. Best results were obtained by combining features from intervertebral discs and vertebrae with receiver operating characteristics area under curve of 0.86, accuracy of 0.84, and recall of 0.83. This preliminary work shows that texture analysis and machine learning may be used to predict pain from T2-weighted images. Thus, a connection between MRI textural features and clinically relevant low back pain may exist.
Introduction
Low back pain (LBP) is very common worldwide. As many as 70–85% of adults have been estimated to suffer from it at some point in their lives1. For most (ca. 90%) of patients with LBP, no specific cause for pain can be demonstrated. LBP may result from an injury or degenerative process of the lumbar innervated tissues such as facet joints, intervertebral discs (IVDs), ligaments, or muscles. Magnetic resonance imaging (MRI) shows degenerative changes in vertebrae and IVDs of which some have been associated with the severity of LBP2. However, these findings are common in the asymptomatic population as well, and thus may not be representative of clinical symptoms3,4. Therefore, our study aims to use texture analysis and machine learning methods to find representative features that could predict the presence of LBP from T2-weighted MRI.Methods
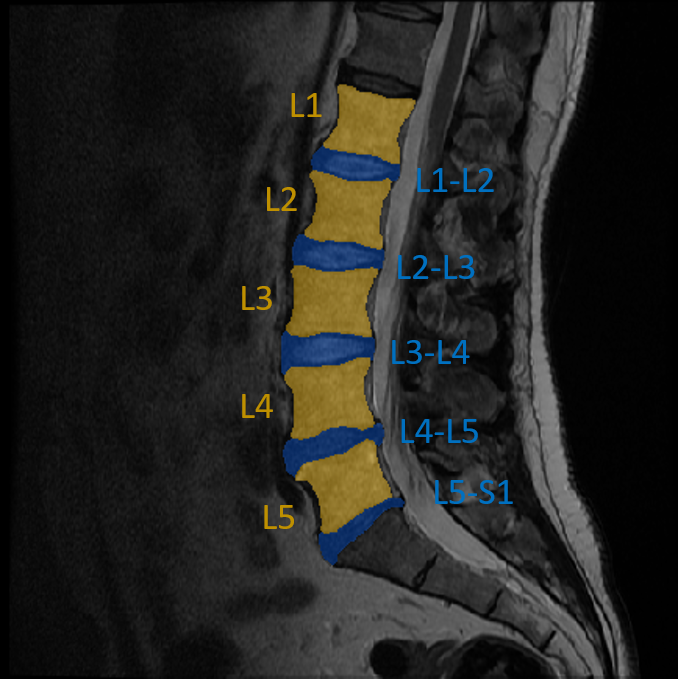
Mid-sagittal slices (N = 200) of T2-weighted MRI scans of the lumbar spine along with tabular data containing information about LBP frequency and intensity (scale from 0-10) of Northern Finland Birth Cohort 1966 participants were used in this study. Imaging was done at 1.5 T with a fast spin echo sequence (TE = 112.7 ms, TR = 3500 ms, ETL = 27, slice thickness = 4 mm, matrix size = 512x512, FOV = 280x280 mm2). Based on the pain characteristics at the time of imaging, two groups were formed: subjects with clinically relevant pain (frequency ≥ 30 days and intensity ≥ 6), and no pain (others). Separate regions-of-interest (ROIs) containing the lumbar IVDs and vertebrae were segmented from the images manually (Figure 1). A custom MATLAB (R2019b) script was then used to extract the following textural features from the ROIs in various directions (where applicable): histogram features, gradient features, gray-scale co-occurrence matrix, run-length encoding matrix, wavelet features, autoregressive model parameters, and local binary patterns. In total, 603 textural features were extracted.Sklearn (v. 0.21.2) machine learning library was used in Python (v. 3.7.3) to build a machine learning pipeline to analyze the feature data. Data were split into training (80%) and test (20%) sets making sure they have the same class distribution. A false-positive-rate test was used to reduce dimensionality by keeping only features testing for p-value below 0.05. A logistic regression classifier was then implemented to predict whether the subject LBP or not. A 5-fold stratified cross-validation scheme was used in conjunction with a grid-search to tune the amount of L2 regularization in the classifier. The best performing parameters were then used for final classification task. This analysis was done separately for IVD features and vertebral features, and for a combination of both.
Results
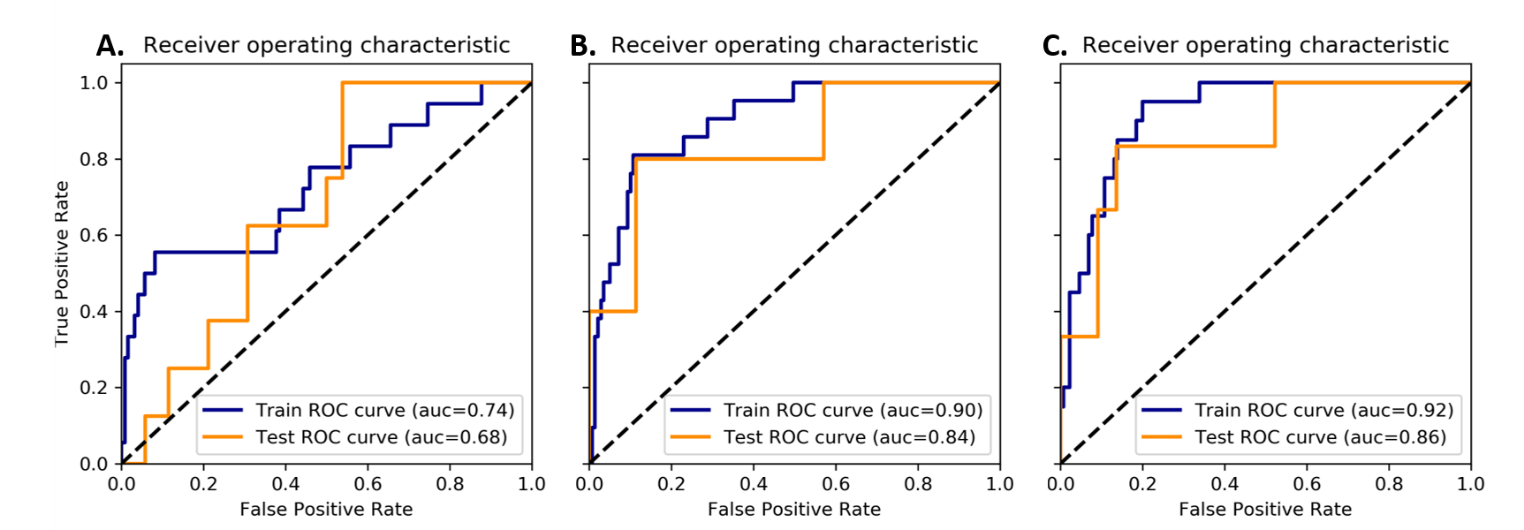
The feature reduction algorithm reduced the feature space to 19 IVD features and 22 vertebral features. When using only IVD features, a receiver operating characteristic area under curve (ROC-AUC) of 0.84, accuracy of 0.82, and recall of 0.83 were observed in the test set. For vertebral features only, the corresponding metrics were ROC-AUC = 0.64, accuracy = 0.63, and recall = 0.55. When vertebral and IVD features were combined, the corresponding metrics increased to ROC-AUC = 0.86, accuracy = 0.84, and recall = 0.83. The receiver operating characteristic curves are shown in Figure 2. The receiver operating characteristics for the training and test sets were similar, and therefore our model did not overfit to training data.Discussion
The results heavily suggest that IVD features have more relevance in predicting clinically relevant LBP. Using only vertebral features resulted in inferior classifier performance. Furthermore, combining features from both ROIs only slightly increased performance when compared to using IVD features only. Indeed, a recent genetic study has shown strongly statistically significant genetic correlation between IVD problems and back pain5.While our results show promise in using texture analysis and machine learning in predicting pain from T2-weighted images, further investigations are required. Specifically, we aim to increase the amount of analyzed data considerably to ensure good generalization, and to investigate deep learning approaches. In addition, using more MRI contrasts such as T1 or short-TI inversion recovery (fat suppression) and combining imaging phenotypes such as Modic of Pfirrmann scoring with textural features could further improve the results.
Conclusion
This preliminary work shows that texture analysis combined with a logistic regression classifier pipeline may be used to predict pain from T2-weighted MR images. Thus, there may be a connection between quantitative MRI features and clinical symptoms in LBP.Acknowledgements
Support from Technology Industries of Finland Centennial Foundation and Jane and Aatos Erkko Foundation is gratefully acknowledged.References
1. Balagué F, Mannion AF, Pellisé F, Cedraschi C. Non-specific low back pain. Lancet. 2012;379:481–491.
2. Carragee EJ. Persistent Low Back Pain. N Engl J Med. 2005;352:1891–1898.
3. Chou D, Samartzis D, Bellabarba C, Patel A, Luk KDK, Kisser JMS, et al. Degenerative Magnetic Resonance Imaging Changes in Patients With Chronic Low Back Pain. Spine. 2011;36(21):43–53.
4. Jensen MC, Brant-Zawadzki MN, Obuchowski N, Modic MT, Malkasian D, Ross JS. Magnetic Resonance Imaging of the Lumbar Spine in People Without Pain. N Engl J Med. 1994;331(2):69–73.
5. Freidin MB, Tsepilov YA, Palmer M, Karssen LC, Suri P, Aulchenko YS, Williams FMK. Insight into the genetic architecture of back pain and its risk factors from a study of 509,000 individuals. Pain. 2019;160(6):1361-1373.
Figures