2654
Deep learning fat-suppressed images for musculoskeletal diseases1Department of Radiology, Juntendo University, Tokyo, Japan, 2Department of Radiology, The University of Tokyo, Tokyo, Japan, 3Faculty of Health Sciences Graduate School of Human Health Sciences, Tokyo Metropolitan University, Tokyo, Japan, 4Department of Radiology, Juntendo University Nerima Hospital, Tokyo, Japan, 5Department of Radiology, Toho University, Tokyo, Japan
Synopsis
Fat-suppressed MR images of the musculoskeletal system help the visualization of T2-prolonged lesions, such as tumors, infections/inflammations, and trauma, with better contrast, while also contributing to the qualitative diagnosis of fatty lesions.However, the addition of a fat-suppressing sequence to clinical routine is time-consuming. Increasing the imaging time may lead to deterioration of the image quality due to body movement.In this study, we generated fat-suppressed images through post-processing by using deep learning. The images were generated using U-Net, with T1WIs and T2WIs as input. The generated images were very similar to Dixon images that were used as targets.
INTRODUCTION
Fat-suppressed T2WIs clearly depict infections, inflammatory lesions, tumors, and fluid retention in spinal bones, contributing to better diagnosis. So far, various fat-suppressed T2WIs have been proposed, such as Dixon and STIR. However, the generation of fat-suppressed T2WIs is still time-consuming. Recently, machine learning has attracted considerable attention. The breakthrough technology in machine learning is deep learning based on convolutional neural network (CNN), and this technology has various applications in the medical field, including disease classification, segmentation, and image correction.In this study, we aimed to generate fat-suppressed T2WIs from T2WIs and T1WIs by using deep learning.METHODS
All imaging for 113 cases with T2-elongated lesions was performed on a 3T MRI scanner (Magenetom Prisma, Skyra, Siemens, Germany) with T1WI and Dixon T2WI (in-phase, water image). T1WIs, T2WIs, and Dixon images (fat-sat T2WI) from 113 clinical cases were used for deep learning. All data were divided into 75% (85 cases) for training, 9% (10 cases) for validation, and 16% (18 cases) for testing. Data augmentation increased the training data to 19,467 images.U-Net model was employed as the CNN model. Two major changes were made in the original method of U-net. Specifically, two inputs and stride were used instead of MaxPooling to compress the image size. The network was programmed using neural network console version 1.50 (https://dl.sony.com/console/), and the training was performed on a Windows PC with GPU NVIDIA RTX1070.The qualitative and quantitative estimation of generated images was performed on three images extracted from each case with the T2 elongated lesion on Dixon images.The qualitative assessment of generated images was performed as a visual assessment by two radiologists with 5 grades.Peak signal-to-noise ratio (PSNR), structural similarity index (SSIM), and dice coefficients were used for the overall quantitative evaluation of the images. As a regional assessment, the contrast-to-noise ratios (CNRs) between the vertebral lesion and the bone marrow was calculated by ROI analysis. As statistical analysis, the CNRs for the generated and Dixon images were compared using a paired two-tailed t-test.If the resulting probability value (P) from the test was less than 0.05, it was regarded as statistically significant.RESULTS
Image generation with deep learning succeeds with high probability if there is no misalignment between T1WIs and T2WIs.Figure 1 shows the ground truth (fat-sat T2WI) and generated image of a representative case with degenerative change. The depiction of the T2 high signal lesion in a generated image resembles that in a Dixon image.Qualitative evaluation showed no differences in the degree of lesion visualization and suppression of fat signal between Dixon and the generated images.The average values of PSNR, SSIM, and dice coefficient were 34.61 ± 1.53, 0.90 ± 0.02, and 0.93 ± 0.04 (mean ± SD), respectively. Moreover, there were no differences in CNR with ROI analysis (P = 0.496, Table 1).DISCUSSION
The U-Net CNN model adopted in this study succeeded in removing fat signals from T2WIs.The model could suppress the signals of adipose tissue in the bone and in other soft parts of the body, while improving the contrast between the lesion and the surrounding area. One of the greatest advantages of the method explained herein is that it can be used to generate fat-suppressed T2WIs from past images. Every day, clinical practitioners face the challenge of being unable to have fat-suppressed T2WIs when attempting to identify a disease that could not be anticipated before imaging. Although images generated using our approach cannot completely replace fat-suppressed T2WIs, it is expected to be greatly useful in such clinical situations.This method can be used for other body parts as well. In fact, fat-suppressed T1WIs is also useful for evaluating the female pelvis. In the future, we will consider applying the method to other body parts.However, this study has some limitations.Training images were insufficient to cover all pathologies of the spine (Figure 2). In particular, no images were available for metal devices, fluid retention, bleeding after spinal surgery, etc.In the future, we plan to improve the CNN model by collecting training data for various disease states and magnetic fields.CONCLUSION
We succeeded in generating fat-suppressed T2WIs using deep learning. The collection of additional data with various pathologies and magnetic fields for training the model is required.Acknowledgements
No acknowledgement found.References
1. Goldfarb JW et al. Water–Fat Separation and Parameter Mapping in Cardiac MRI via Deep Learning With a Convolutional Neural Network. Magnetic Resonance Imaging. 2019 ;50:655-665.2.
2. Ma J et al. Dixon Techniques for Water and Fat Imaging.Magnetic Resonace Imaging. 2008 ;28:543-583.
3.Maas et al. Uniform fat suppression in hands and feet through the use of two-point Dixon chemical shift MR imaging. Ragiology. 1999 ;210:189-93.
4. Ronneburger et al. U-Net: Convolutional Networks for Biomedical Image Segmentation. Lecture Notes in Computer Science, 2015 ;9351:234-241.
Figures
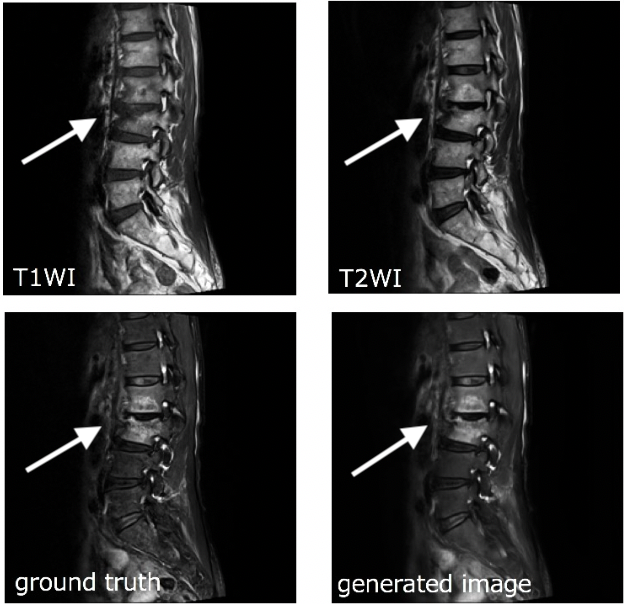
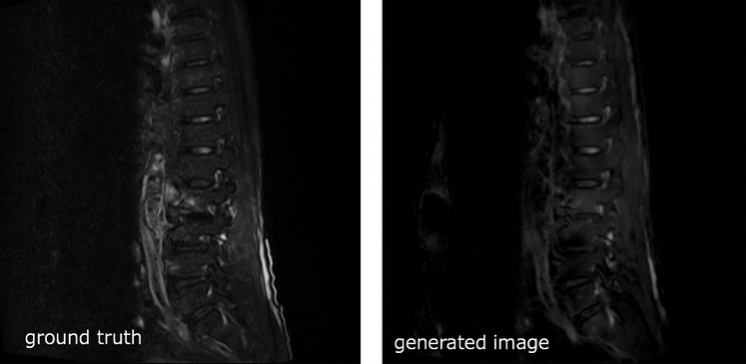
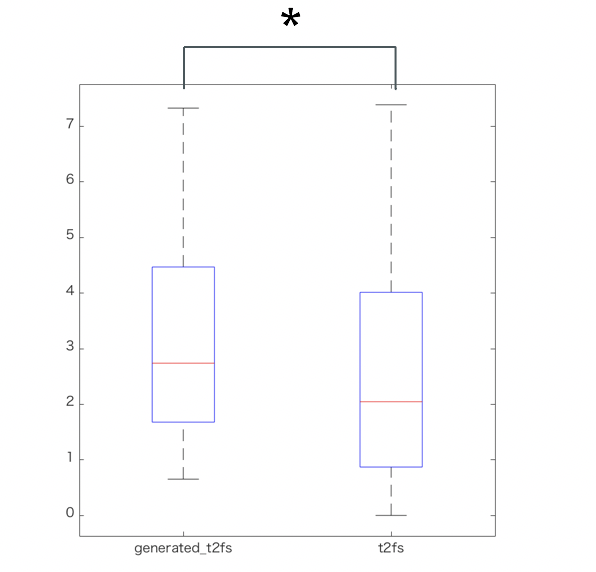
Table 1 shows the ROI examination. Based on the the paired two-tailed t-test, asterisk = P < 0.05