2649
Segmentation and 3D Anatomical Renderings of Pelvic MRI Allow Quantitative Analysis of Lower Urinary Tract Anatomy
Lucille E Anzia1, Cody J Johnson1, Diego Hernando1, Wade A Bushman2, Shane A Wells1, and Alejandro Roldán-Alzate3
1Radiology, University of Wisconsin Madison, Madison, WI, United States, 2Urology, University of Wisconsin Madison, Madison, WI, United States, 3Mechanical Engineering, University of Wisconsin Madison, Madison, WI, United States
1Radiology, University of Wisconsin Madison, Madison, WI, United States, 2Urology, University of Wisconsin Madison, Madison, WI, United States, 3Mechanical Engineering, University of Wisconsin Madison, Madison, WI, United States
Synopsis
Previous anatomic studies of the lower urinary tract predominantly utilize ultrasound and computed tomography. We present a novel method for measuring bladder wall volume (BWV), bladder wall thickness (BWT) and prostate volume (PV) using 30 (14 male) patients aged 30-39. Through MRI segmentation of the bladder and prostate in Mimics software, 3D models were quantified for BWV and PV. 3-matic was used to measure BWT. There were no significant differences in BWV or BWT between males and females (p=0.52,0.25). Mean PV was 28.7cm3 (16.7-47.8cm3). Non-significant variations in BWT were observed regionally. Future directions will use this methodology across age groups.
Introduction
Prior studies have shown that anatomic changes that occur with aging lead to lower urinary tract symptoms (LUTS) in men and women.1,2 Studies using ultrasound (US) and computed tomography (CT) show increased bladder wall thickness (BWT) correlates with overactive bladder in women and benign prostatic hyperplasia (BPH)/LUTS in men.1-13 In previous studies, BWT and bladder volume were quantified through localized measurements on a 2D plane1,2,6-13 and mathematical estimation.1,8 The use of MRI to examine lower urinary tract anatomy is more limited.14,15 We present a novel method for analyzing lower urinary tract anatomy using MRI and report the normative values for BWT, bladder wall volume (BWV) and prostate volume (PV) in young, asymptomatic men and women.Methods
With IRB approval and following a HIPAA compliant protocol, 30 pelvic MRIs (14 male) of subjects age 30-39 [mean 35.2±3.21 years (males), 35.1±2.68 (females) and 35.2±2.89 years (entire population)] were retrospectively analyzed. The MRIs were performed either on a 3T scanner (Discovery MR 750, GE Healthcare, Waukesha, WI) using a 32-channel surface coil (NeoCoil, Pewaukee, WI) or 1.5T scanner (MR450) with an 8-channel surface coil. The fast-spin echo T2-weighted acquisitions were performed at the University of Wisconsin Health system between June 1, 2017 and May 31, 2018 in subjects without known LUTS/bladder outlet obstruction (BOO) and for indications unrelated to the lower urinary tract. Patients below age 30, above age 39 or with an MRI without complete coverage of the bladder/prostate were excluded.MR images were uploaded into the design software “Mimics” (Materialise, Belgium). The bladder lumen, bladder wall and prostate (males) were reconstructed by segmentation (Figure 1) to create an organ ‘mask’, and then converted into a 3D model (Figure 2). BWV and PV were recorded from the 3D model. BWT was manually measured at 1) the anterior bladder wall (Figure 3) and 2) the site of maximum thickness. Each site was measured three times and averaged.
Each bladder and prostate 3D model and the corresponding center of gravity of the bladder were exported into 3-matic (Materialise, Belgium) for further manipulation and quantification. A thickness gradient was applied to the bladder wall structure (Figure 4) and the computational median BWT was recorded. The bladder was divided along a plane intersecting the center of gravity into six pairwise halves: the anterior, posterior, dome, base, left and right sidewalls (Figure 4). The median BWT of each half was recorded. Then, each BWT parameter was analyzed for mean, median and range values and the difference between male and female cohorts was quantified (Table 1).
Results
Mean BWV was similar for men and women (24.7cm3 vs 22.8cm3, p=0.52). The manually measured mean and maximum anterior BWT were also similar for men and women (3.98mm vs 3.58mm, p=0.36 and 5.24mm vs 4.76mm, respectively, p=0.31). From the 3D model, mean BWT was 2.46mm in males and 2.14mm in females (p=0.25). Regional BWT values of anterior, posterior, dome, base, left and right were similar for men and women (2.61mm vs 2.44mm, 2.22mm vs 1.81mm, 2.47mm vs 2.03mm, 2.40mm vs 2.12mm, 2.65mm vs 2.13mm and 2.22mm vs 2.11mm, respectively, p=0.09-0.69). Mean prostate volume was 28.7cm3 (16.7-47.8cm3) for males.Discussion
We introduced a novel MR methodology that can be used to quantify multiple anatomic parameters (BWV, BWT and PV) of the lower urinary tract in men and women. We found that young, healthy subjects without LUTS have similar bladder anatomy on both 2D images and 3D renderings.8,16 Importantly, changes to the these anatomic parameters are relevant in the clinical setting and can be seen in over-active bladder17, under-active bladder18 and BOO12,13,19. Our method has several advantages, notably the ability to measure bladder and prostate anatomy three dimensionally, allowing assessment of each organ regionally and as a volume without ionizing radiation. While previous studies have focused on the anterior wall, our methods provide an opportunity to observe fluctuations in thickness of the entire bladder wall, which may have important clinical implications.There is potential for variability from manual segmentation and measurement, which we mitigated by limiting measurements to a single investigator. Future studies will assess intra- and inter-reader variability. Further, manual segmentation is labor intensive and dependent on the anatomic expertise of the investigator. An automated method may save time and improve consistency. Lastly, we did not control for bladder volume which has been shown to correlate with BWT.12
Conclusion
Pelvic MRI with segmentation and 3D anatomical renderings provide a novel method for quantifying clinically relevant parameters of the lower urinary tract including BWV, BWT and PV. Here, we demonstrate the ability to collect these values in young, healthy subjects. Future studies will collect and compare bladder wall thickness, bladder wall volume and prostate volume values in male and female cohorts throughout the lifespan.Acknowledgements
The authors would like to thank the University of Wisconsin Summer Program for Undergraduate Urology Research (SPUUR) for their contributions to this study.References
- Fananapazir G, Kitich A, Lamba R, et al. Normal reference values for bladder wall thickness on CT in a healthy population. Abdom Radiol. 2018;43:2442–2445.
- Güzel Ö, Aslan Y, Balcı M, et al. Can Bladder Wall Thickness Measurement Be Used for Detecting Bladder Outlet Obstruction? Urology. 2015;86:439–444.
- Wei JT, Calhoun E, Jacobsen SJ. Urologic Diseases in America Project: Benign Prostatic Hyperplasia. J Urol. 2005;173:1256–1261.
- Mirone V, Imbimbo C, Longo N, et al. The Detrusor Muscle: An Innocent Victim of Bladder Outlet Obstruction. Eur Urol. 2007;51:57–66.
- Keqin Z, Zhishun X, Jing Z, et al. Clinical Significance of Intravesical Prostatic Protrusion in Patients with Benign Prostatic Enlargement. Urology. 2007;70(6):1096–1099.
- Franco G, De Nunzio C, Leonardo C, et al. Ultrasound Assessment of Intravesical Prostatic Protrusion and Detrusor Wall Thickness—New Standards for Noninvasive Bladder Outlet Obstruction Diagnosis? J Urol. 2010;183:2270–2274.
- Ahmed A, Bedewi M. Can Bladder and Prostate Sonomorphology Be Used for Detecting Bladder Outlet Obstruction in Patients with Symptomatic Benign Prostatic Hyperplasia? Urology. 2016;98:126–131.
- Hakenberg OW, Linne C, Manseck A, et al. Bladder wall thickness in normal adults and men with mild lower urinary tract symptoms and benign prostatic enlargement. Neurourol Urodyn. 2000;19:585–93.
- Bright E, Pearcy R, Abrams P. Automatic evaluation of ultrasonography-estimated bladder weight and bladder wall thickness in community-dwelling men with presumably normal bladder function. BJU Int. 2012;109:1044–1049.
- Lee H, Choo M, Kim M, et al. Changes in bladder wall thickness and detrusor wall thickness after surgical treatment of benign prostatic enlargement in patients with lower urinary tract symptoms: a preliminary report. Korean J Urol. 2014;55:47–51.
- Deirmentzoglou S, Giannitsas K, Perimenis P, et al. Correlation of Ultrasound-estimated Bladder Weight to Urodynamic Diagnoses in Women with Lower Urinary Tract Symptoms. Urology. 2012;80(11):66–70.
- Oelke M, Höfner K, Wiese B, et al. Increase in detrusor wall thickness indicates bladder outlet obstruction (BOO) in men. World J. Urol. 2002;19:443-452.
- Manieri C, Carter SSC, Romano G, et al. The diagnosis of bladder outlet obstruction in men by ultrasound measurement of bladder wall thickness. J Urol. 1998;159:761–765.
- Zhang X, Liu Y, Yang Z, et al. Quantitative Analysis of Bladder Wall Thickness for Magnetic Resonance Cystoscopy. IEEE Trans Biomed Eng. 2015;62(10):2402-2409.
- Ategçi YZ, Aydoldu Ö, Karaköse A, et al. Does Urinary Bladder Shape Affect Urinary Flow Rate in Men with Lower Urinary Tract Symptoms? Sci. World J. 2014.
- Williams AM, Simon I, Landis PK, et al. Prostatic Growth Rate Determined from MRI Data: Age‐Related Longitudinal Changes. J Androl. 1999;20(4):474–480.
- Abou-Gamrah A, Fawzy M, Sammour H, et al. Ultrasound assessment of bladder wall thickness as a screening test for detrusor instability. Arch Gynecol Obs. 2014;289(5):1023–1028.
- Rademakers KLJ, Gommert, Van Koeveringe A, et al. Ultrasound detrusor wall thickness measurement in combination with bladder capacity can safely detect detrusor underactivity in adult men. World J Urol. 2017;35(1):153–159.
- Farag F, Elbadry M, Saber M, et al. A novel algorithm for the non-invasive detection of bladder outlet obstruction in men with lower urinary tract symptoms. Arab J Urol. 2017;15(2):153–158.
Figures
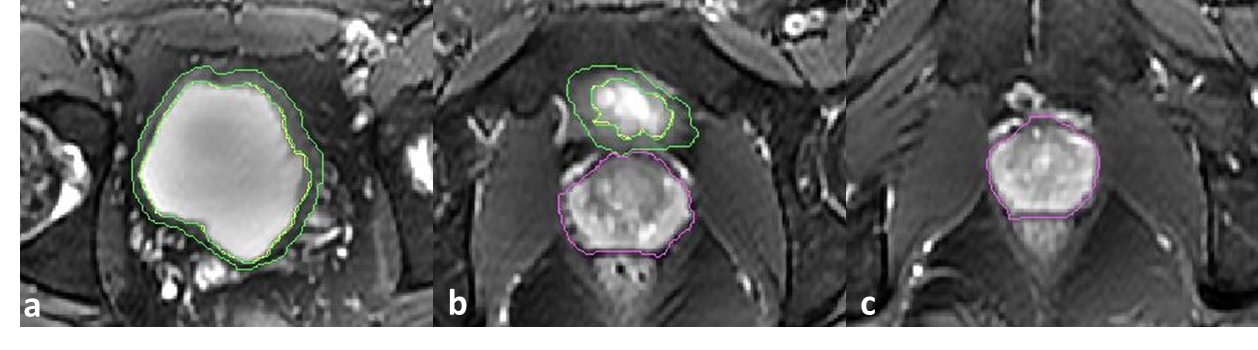
Figure 1: Moving superiorly to inferiorly (1a to 1c), axial slices of an age 33 male subject. Segmentation of the bladder wall is outlined in green, the prostate in purple.
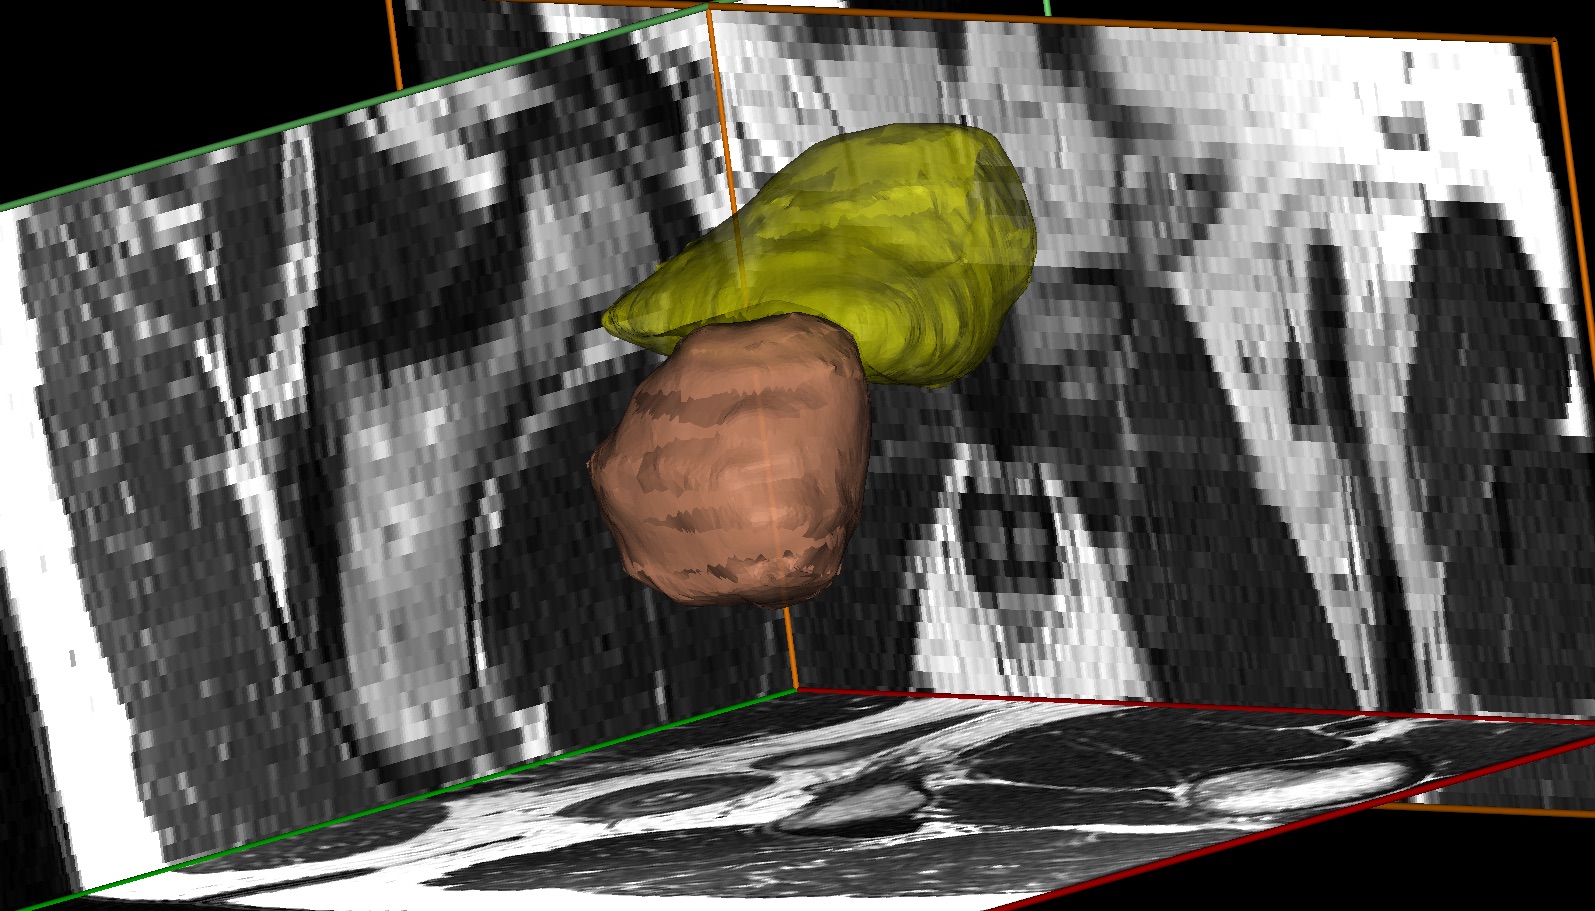
Figure 2: The 3D reconstruction of a male bladder and prostate made using Mimics software. Image is shown from a right posterolateral view. The wall of the bladder is shown in yellow, the prostate in orange. The background shows the corresponding MR imaging in each plane.
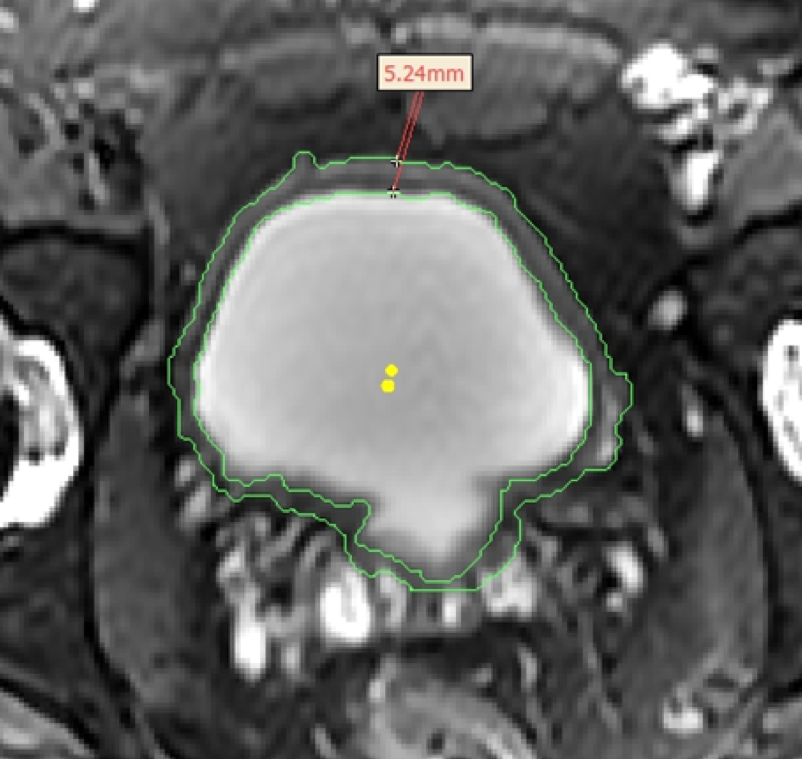
Figure 3: Axial view of an age 33 male bladder exemplifying a manual measurement of the anterior bladder wall thickness (shown in red). The area measured between the two points is 5.24mm.
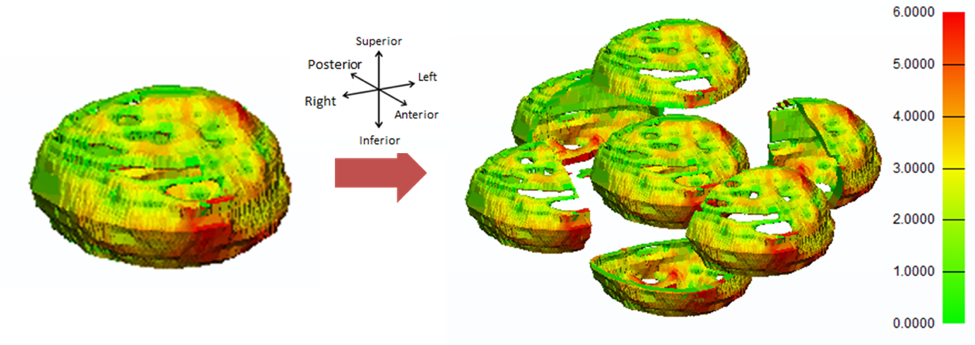
Figure 4: Age 39 male bladder wall and its divisions into both anterior/posterior, dome/base and left/right halves. Division and subsequent computation performed using 3-matic software. Gradient shows thinnest areas in green, through a medium thickness (yellow) to the thickest areas (6mm and above) in red.
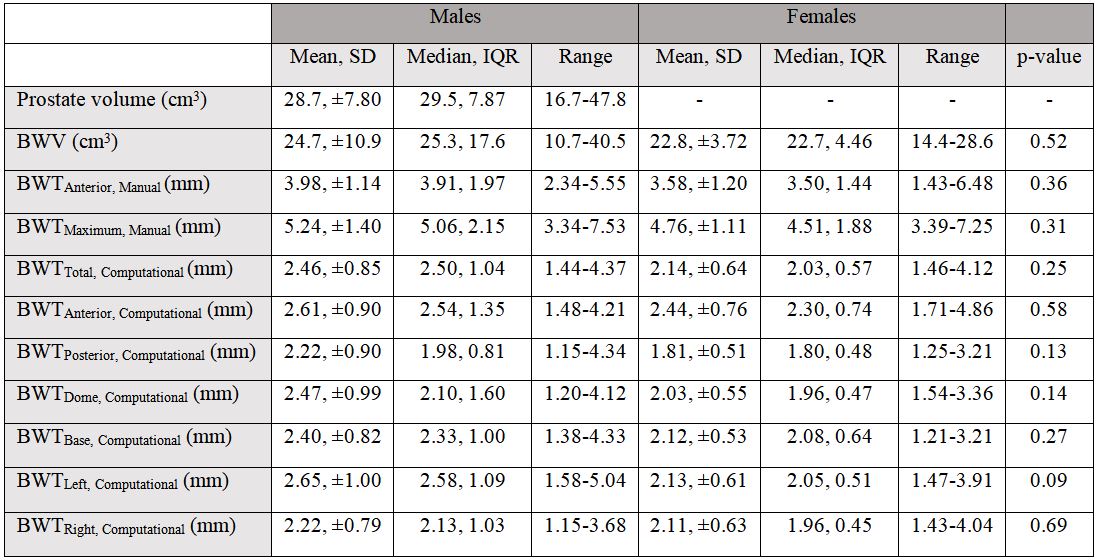
Table 1: Measurements of lower urinary tract parameters in males (n= 14) and females (n=16) aged 30-39. P-values represent tests for significance between the male and female populations. A p-value less than 0.05 is considered significant. A subscript stating “manual” indicates that the value was measured by-hand by the researcher. In contrast, “computational” implies the value was computer software generated.