2646
3D amide proton transfer MR imaging of kidney: a feasibility study1The First Affiliated Hospital of Dalian Medical University, Dalian, China, 2Philips Healthcare, Beijing, China
Synopsis
MRI imaging is a radiographic imaging technology widely used in human body. The application of MRI at the molecular level had became a hot research topic in the near future. 3D amide proton transfer weighted(APTw) MR imaging is a new contrast-agent-free MRI technique that addresses the need for a more confident diagnosis in oncology[1,2]. The APTw was widely used in the nervous system. Recently, The APTw was gradually applied to the abdomen[3,4]. At present, there is no related research reported on renal APT imaging.
Purpose
To evaluate measurement reproducibility of 3D amide proton transfer (APT) imaging in healthy kidney.Materials and Methods
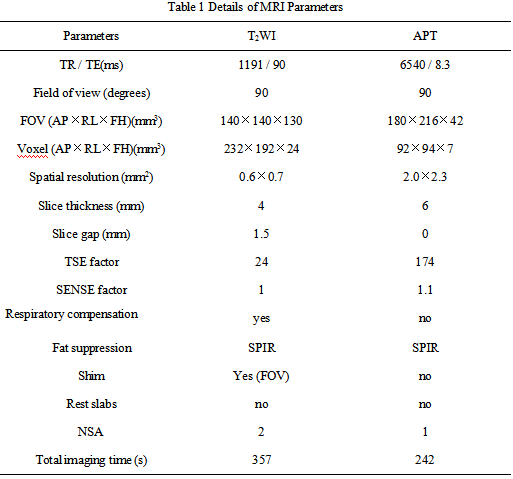
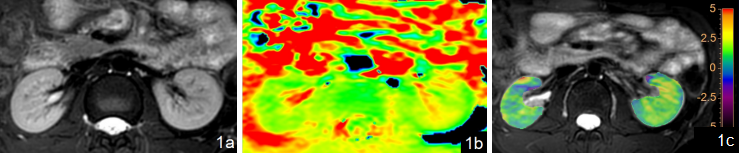
Fifteen young healthy volunteers (median age 26 (22–35) years; 8 males, 7 females) were recruited and underwent 3D APT imaging ofbilateral kidney on a 3.0T MR scanner (Ingenia CX, Philips). A extra T2w TSE sequence was scanned to confirm the absence of any visible lesions. The scanning parameters were detailed in Table 1. With reference to fusion of T2w images and APT images by using intelli space portal, circle ROIs were manually placed on renal cortex and medulla in three slices of APTw images (the largest axial slice of kidney and its adjacent (6mm) upper and lower slices) by two radiologists independently (Figure 1). ROI sizes for cortex and medulla are 10 mm2 and 30 mm2, respectively. The average APTw values were calculated to minimize measurement bias. The consistencies of renal cortex and medulla APTw measurements between the two radiologists were tested using intra-class correlation coefficients (ICC) in SPSS 22.0 (IBM). The measurement data of senior doctors were selected for follow-up statistical analysis. The value between unilateral renal cortex, medulla and bilateral renal mesothelial medulla were compared byMann-Whitney U test.Results
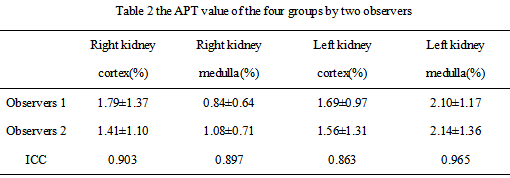
The MTRasym measured in the four regions (right renalcortex, right renal medulla, left renalcortex, left renal medulla) from all the subjects were (1.79±1.37)%; (0.84±0.64)%; (1.69±0.97)%; (2.10±1.17)% by radiologist 1, and (1.41±1.10)%; (1.08±0.71)%; (1.56±1.31)%; (2.14±1.36)% by radiologist 2, respectively (mean value ± standard deviation). ICC values of MTRasym on right renal cortex, right renal medulla, left renal cortex, left renal medulla were 0.903, 0.897, 0.863 and 0.965, respectively (Table 2). Right kidney cortex was significantly higher than that of Right kidney medulla (P=0.001). Left kidney medulla was significantly higher than that of Left kidney cortex (P=0.001). There was significant difference between the APT value of Left kidney medulla and Right kidney medulla (P=0.002).Conclusion
APT imaging is proven to yield reproducible quantitative measurements on healthy kidneys in different regions, with excellent agreements between independent observers. In addition, we found that the difference of apt value between two renal medulla needs to be designed and calibrated.Acknowledgements
No acknowledgements found.References
1. Li B, Sun H, Zhang S, et al. Amide proton transfer imaging to evaluate the grading of squamous cell carcinoma of the cervix: A comparative study using 18F FDG PET [J]. J Magn Reson Imaging: 2019, 50(1): 261-268.
2. Takayama Y, Nishie A, Sugimoto M, et al. Amide proton transfer (APT) magnetic resonance imaging of prostate cancer: comparison with Gleason scores [J]. MAGMA: 2016, 29(4): 671-679.
3. Lawu BKH, King AD, Ai QY, et al. Head and Neck Tumors: Amide Proton Transfer MRI [J]. Radiology: 2018, 288(3): 782-790.
4. He YL, Li Y, Lin CY, et al. Three-dimensional turbo-spin-echo amide proton transfer-weighted mri for cervical cancer: A preliminary study [J]. J Magn Reson Imaging: 2019, Mar 12.
5. Nishie A, Asavama Y, Ishigami K, et al. Amide proton transfer imaging to predict tumor response to neoadjuvant chemotherapy in locally advanced rectal cancer [J]. J Gastroenterol Hepatol: 2019, 34(1): 140-146.
Figures