2644
Application of the Free-Breathing 3D Turbo Gradient Spin Echo pCASL Sequence to Assess Renal Perfusion in Patients with Diabetic Nephropathy1Department of Radiology, Hua Dong Hospital, Fudan University, Shanghai, China, 2MR Application Development, Siemens Shenzhen Magnetic Resonance Ltd., Shenzhen, China, 3MR Application Predevelopment, Siemens Healthcare, Erlangen, Germany
Synopsis
In this study, we aimed to compare the renal blood flow (RBF) values obtained with the 3D Turbo Gradient Spin Echo (TGSE) pCASL sequence with glomerular filtration rates (GFRs) measured using single-photon emission computed tomography (SPECT) for nuclide nephro-dynamic imaging to assess renal perfusion in patients with diabetic nephropathy. Our study demonstrated that the RBF values were well correlated with GFR, indicating that the 3D-TGSE pCASL sequence could be used as an alternative - method for the prediction of early diabetic nephropathy.
Introduction
Diabetes is the most common cause of chronic kidney disease (CKD). Previous reports [1] showed a significant decrease in renal perfusion in patients with stage 3 diabetes-induced CKD. Serum creatinine provides an estimate of the glomerular filtration rate (GFR) as a clinical screening marker but is only a rough estimate of overall bilateral renal injury. Arterial spin labeling (ASL) is a non-invasive imaging technique that uses magnetically labeled water particles as tracers in arterial blood to generate a pixel-wise perfusion map, which could reflect renal perfusion more comprehensively. In the present study, we used a prototype pseudo-continuous ASL (pCASL) sequence with a 3D Turbo Gradient Spin Echo (TGSE) data acquisition module [2] to evaluate renal perfusion in patients with diabetic nephropathy. We also compared the diagnostic performance of the 3D-TGSE pCASL sequence with the reference GFR method.Methods
This study was approved by our ethics committee. Informed consent was obtained from all participants. Between August 2018 and October 2019, 25 patients (16 males and 9 females, mean age, 55.6 years) diagnosed with diabetic nephropathy were included in this study. All patients underwent magnetic resonance imaging (MRI) examinations followed by routine single-photon emission computed tomography (SPECT) within 24 hours. MRI examinations were performed on a 3T MRI scanner (MAGNETOM Prisma, Siemens Healthcare, Erlangen, Germany). A prototype free-breathing 3D TGSE pCASL sequence with a post-labeling duration of 1500 ms was performed in a coronal orientation with the following parameters: repetition/echo time (TR/TE) = 6000/20.8 ms, voxel size = 4.7 × 4.7 × 6.0 mm3, FOV=300 × 150 mm2, number of slice = 12, acquisition duration = 4 mins, and 6 s. Renal blood flow (RBF) maps were generated inline with 3D motion correction after data acquisition. According to the SPECT results, patients were divided into mild (n=14, GFR ≥60 ml/min/1.73m2) and moderate-severe (n=11, GFR <60 ml/min/1.73m2) groups. In the initial part of the study, data from the two groups were analyzed using a one-way ANOVA procedure. In the second step, the correlation between GFR and RBF were evaluated using the Pearson correlation.Results
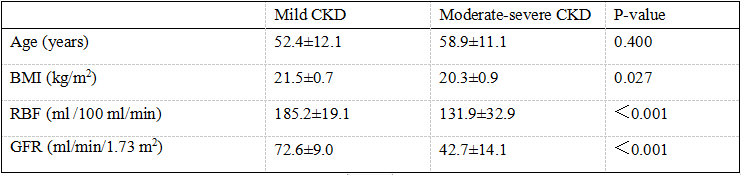
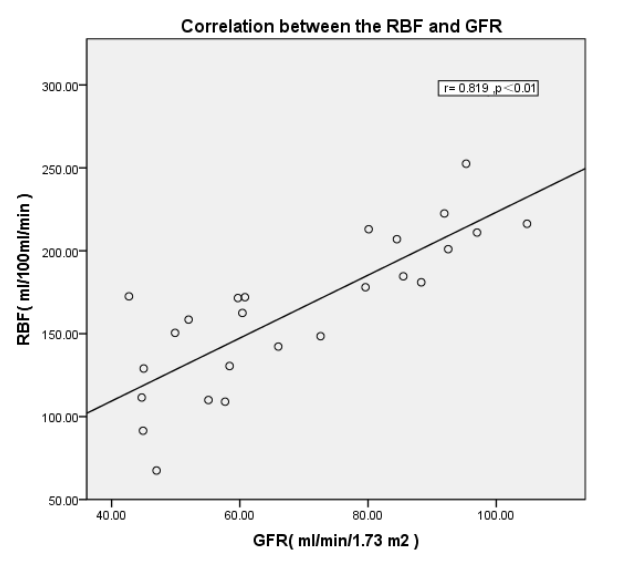
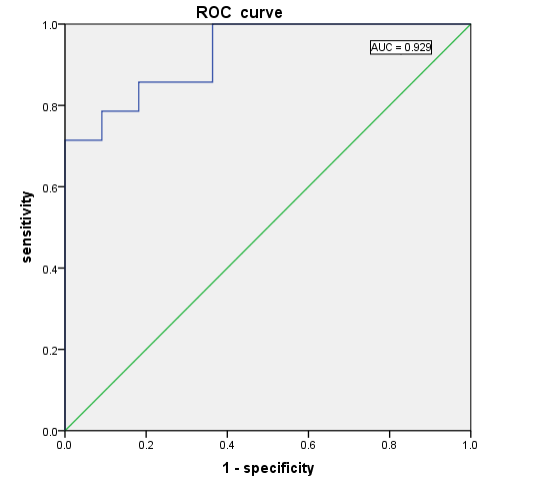
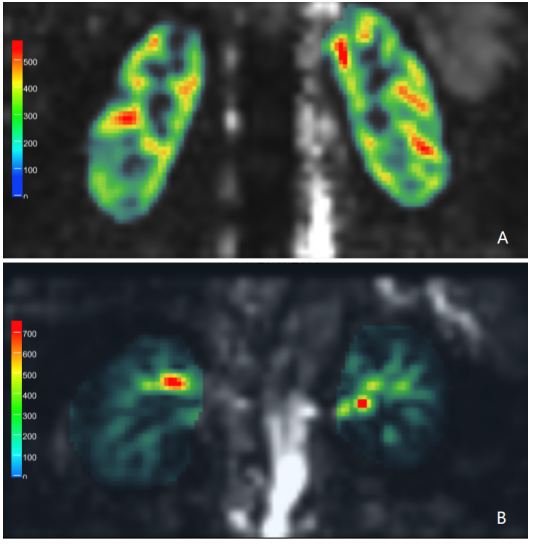
RBF was significantly higher in the mild CKD group compared with the moderate-severe CDK group (p<0.001) (Table 1). The RBF values obtained with the pCASL sequence and GFR values measured with SPECT were well correlated (r=0.819, p <0.01) (Figure 1). The area under the curve (AUC) of the receiver operating characteristic (ROC) curve was 0.929 for RBF in being able to distinguish the mild CKD group from the moderate-severe CKD group (Figure 2). Representative RBF maps of the mild and severe CKD patients are shown in Figure 3.Discussion
The current routine methods for evaluating CKD, including serum creatinine and proteinuria, are not sensitive for detecting early, mild CKD. Recent studies have demonstrated that ASL could detect differences in renal perfusion between healthy volunteers and CKD patients at different stages of disease [3] and early hemodynamic changes in diabetic nephropathy [4]. In this study, we used a newly developed free-breathing 3D-TGSE pCASL sequence, in combination with 3D motion correction, to evaluate renal perfusion in CKD patients. The results of this study demonstrated a significant positive correlation between RBF and GFR as measured by nuclide nephro-dynamic imaging as opposed to creatinine and cystatin C as used for comparisons in other studies. Using this alternative GFR measurement method as the reference method showed that the use of the free-breathing 3D-TGSE pCASL sequence to measure RBF adds to the previous literature.Conclusions
In conclusion, the free-breathing TGSE pCASL sequence with a 3D motion correction is a feasible method for the assessment of the RBF in diabetic nephropathy. It has the potential to be an alternative to nuclide nephro-dynamic imaging in predicting early diabetic nephropathy.Acknowledgements
References
[1].Li, L.P., et al., Evaluation of Renal Blood Flow in Chronic Kidney Disease Using Arterial Spin Labeling Perfusion Magnetic Resonance Imaging. Kidney Int Rep, 2017. 2(1): p. 36-43.
[2]. Günther M, Oshio K, Feinberg DA (2005) Single-Shot 3D Imaging Techniques Improve Arterial Spin Labeling Perfusion Measurements. Magn Reson Med 54:491-498
[3].Selby, N.M., et al., Magnetic resonance imaging biomarkers for chronic kidney disease: a position paper from the European Cooperation in Science and Technology Action PARENCHIMA. Nephrology Dialysis Transplantation, 2018. 33(suppl_2): p. ii4-ii14.
[4].Brown, R.S., et al., The utility of magnetic resonance imaging for noninvasive evaluation of diabetic nephropathy. Nephrology Dialysis Transplantation, 2019.
Figures