2641
Reliability of Water-Lipid Separation in the Kidney Measured by Accelerated In Vivo Magnetic Resonance Spectroscopic Imaging at 3 T1School of Health Sciences, Purdue University, West Lafayette, IN, United States, 2Department of Radiology and Medical Imaging, Prince Sattam bin Abdulaziz University, Al Kharj, Saudi Arabia, 3Department of Radiology and Imaging Sciences, Indiana University School of Medicine, Indianapolis, IN, United States, 4Department of Radiology, Memorial Sloan Kettering Cancer Center, New York, NY, United States, 5Department of Radiology, School of Medicine, Acıbadem Mehmet Ali Aydinlar University, Istanbul, Turkey, 6Center for Neuroradiological Applications and Research, Acıbadem Mehmet Ali Aydinlar University, Istanbul, Turkey, 7Department of Radiology, University of California Los Angeles, Los Angeles, Los Angeles, CA, United States, 8Weldon School of Biomedical Engineering, Purdue University, West Lafayette, IN, United States
Synopsis
MRS could be useful for characterization of the renal cell carcinoma by detecting lipid content. However, single-voxel MRS cannot show the distribution of lipids for heterogeneous tumors. We propose a fast MRSI sequence to map the distribution of lipid metabolites within a clinically acceptable time frame at 3T. The proposed MRSI technique provided high-quality data with reproducible quantitative outputs. The coefficient of variance for the quantified fat fraction was less than 1%.
Introduction
Proton magnetic resonance spectroscopy (1H-MRS) is a non-invasive technique that has been used successfully to characterize various metabolic disorders and malignancies in the brain, breast, liver, and prostate via estimations of lipids, choline, and other metabolites.1 As for the kidney, the feasibility of renal MRS has been reported in healthy volunteers, and patients with renal cell carcinoma (RCC).2 Due to the lipid-rich tumor cells of RCC, differentiation from other histological subtypes could be feasible by the detection of intracellular lipid contents. This suggests that MRS could be useful for RCC characterization and tumor grading. However, renal MRS remains technically challenging. Although single-voxel MRS can differentiate these lipid peaks in the kidney, their distribution within heterogeneous tumors cannot be mapped. Conventional magnetic resonance spectroscopic imaging (MRSI) overcomes this by providing spatially resolved spectra over many voxels, but it requires a long acquisition time. In this work, our major goal was to investigate the feasibility of a renal high-resolution density-weighted concentric ring trajectory (DW-CRT) metabolite cycling MRSI acquisition in healthy volunteers with the intent to establish the signature of the lipid composition of healthy renal tissues, which will be used as a future tool for non-invasive characterization of RCC.Methods
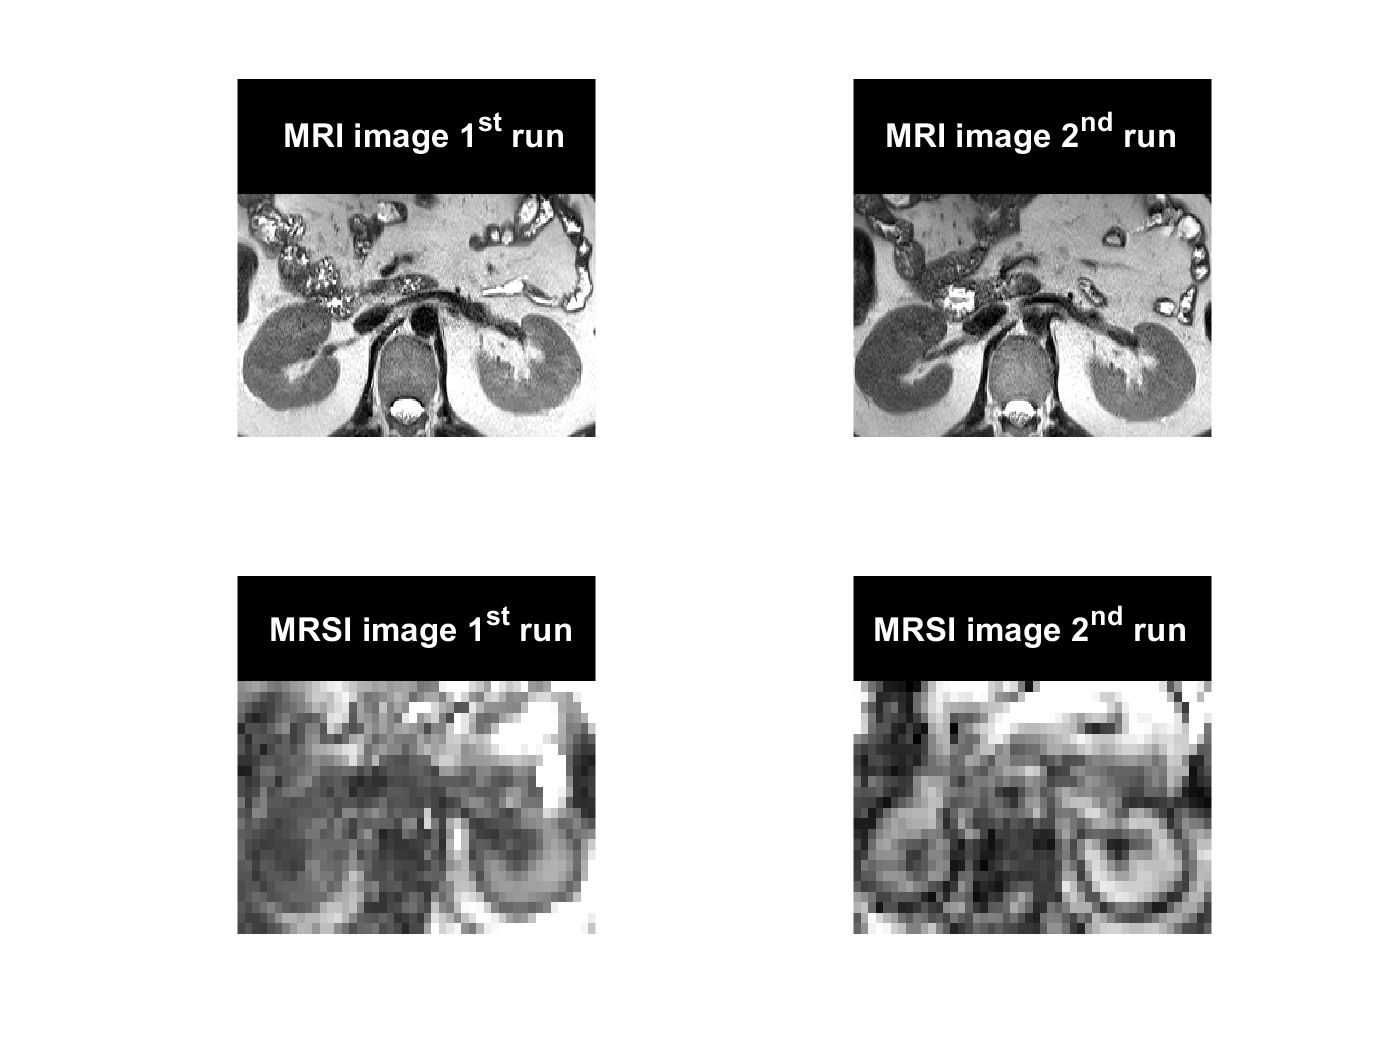
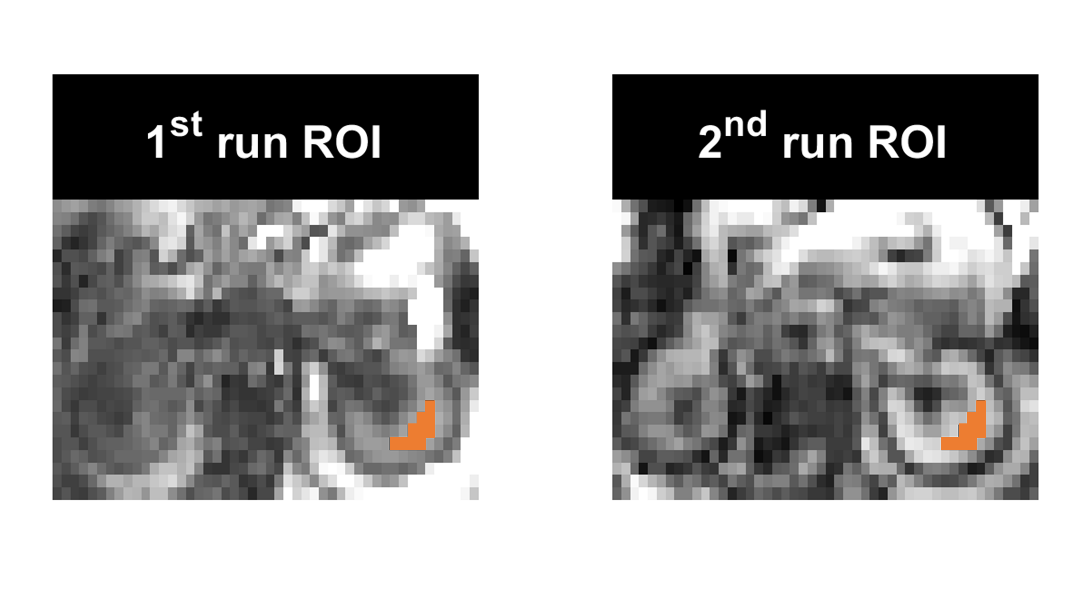
In-vivo test-retest scans were performed on five healthy volunteers (four males, and one female; age: 31 ± 5 years) using a Siemens Prisma 3 Tesla scanner (Siemens Healthineers, Germany). The volunteers were asked to lie on a spine coil in a head-first supine position, and a flexible (18-channel body) coil was placed above the abdominal region. After a short break outside of the scanner, the repeat scan was acquired using the same scanning protocol. The acquisition protocol included two sequences, 1) a high-resolution structural MRI sequence [TE/TR: 80 ms/1.5 s, FA: 150°, 128 averages, resolution: 0.9×0.9×4 mm3, FOV: 280x280 mm2, echo train length: 88], and 2) a density-weighted concentric ring trajectory (DW-CRT)3 metabolite cycling FID-MRSI acquisition [FOV: 240×240 mm2, matrix size: 48×48, slice thickness: 10 mm, acquisition delay: 4 ms, repetition time: 1 s, TA: 192 s. DW-CRT was prescribed using a Hanning-window and the following parameters: points-per-ring: 64, temporal samples = 512, extractable voxel resolution = 5×5×10 mm3, number of rings = 24, spatial interleaves = 4, time acquire = 96 s and spectral bandwidth = 1250 Hz. To enhance B0 homogeneity, the left kidney area was shimmed before acquiring the MRSI data. MRSI data was acquired from an axial slice that showed the same anatomy, marked by the kidney hilum (Figure 1). For assessing the quantification reliability, a region of interest (ROI) covering the medulla anatomy of the left kidney was used (Figure 2). Voxel-wise spectral fitting was performed using LCModel2 to get information on each lipid component. Finally, the repeatability reproducibility of the fat fraction (FF= fat signal/total signal) was used to evaluate the reliability of the MRSI outcomes.Results
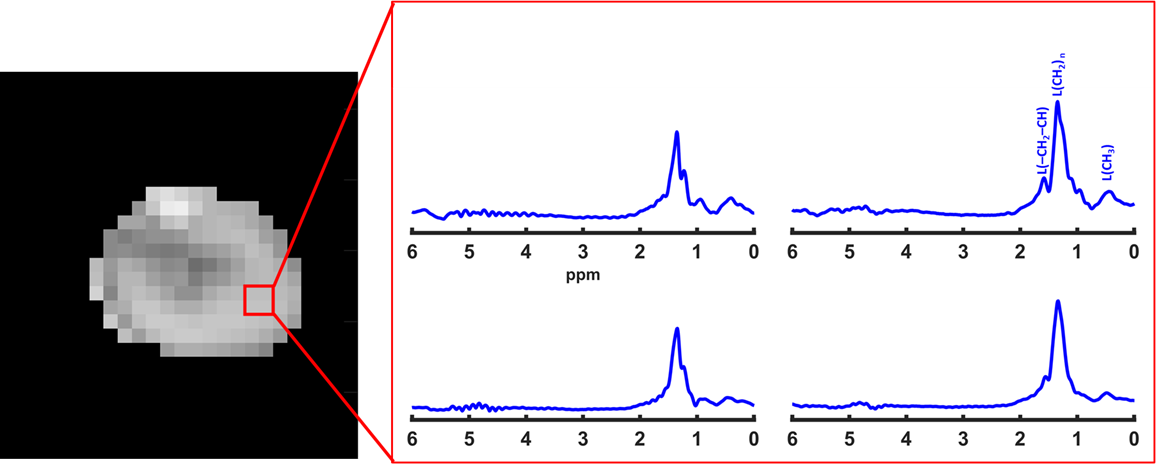
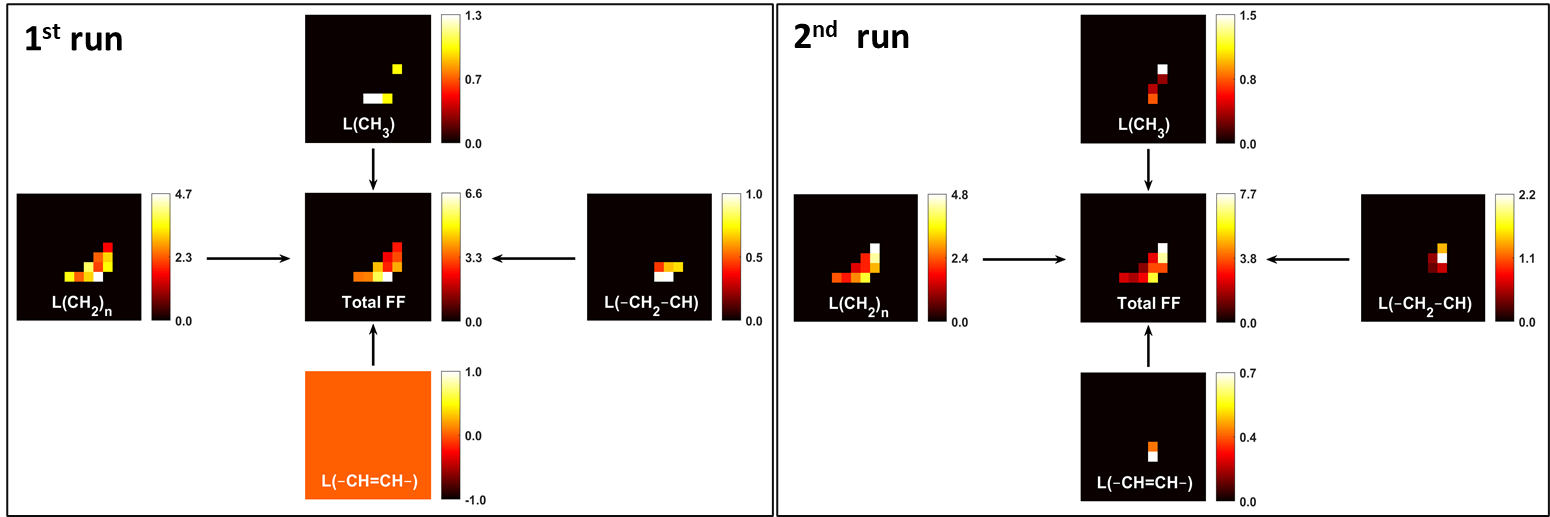
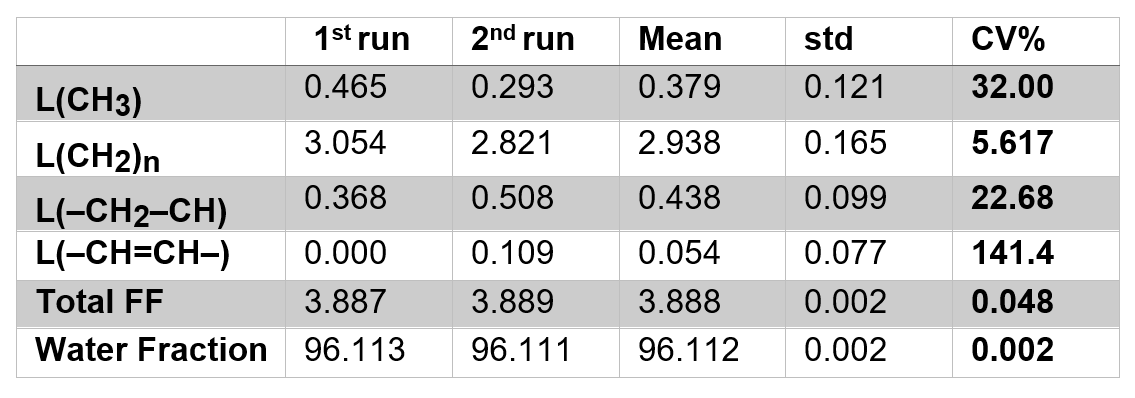
In addition to producing images representing the structural distribution (Figure 1), MRSI provided high spectral resolution (Figure 3). The measured spectral linewidth was 24.5 ± 0.4 Hz. The differentiated lipid peaks are labeled in Figure 3. the fitted peak information was used to generate separate maps for each lipid component (Figure 4). Table 1 summarizes the reproducibility results from one subject represented through the coefficient of variance (CV%). In addition to the total FF, reproducibility evaluation was performed for each lipid component (Figure 3). The coefficient of variance of the proposed MRSI acquisition scheme was less than 1 % for FF. However, the CV of each lipid component varied due to a suboptimal choice of basis set used for LCModel fitting.Discussion and Conclusion
The results show that our proposed MRSI sequence can generate separate high-resolution lipid distribution maps in a short scan time (~3 min). The high degree of reproducibility of water and fat fraction supports the future application of this technique for non-invasive characterization of renal malignancy.Acknowledgements
Supported by the Indiana CTSI, funded in part by grant #UL1TR001108 from the NIH, NCATS, CTS Award.References
1. Shah N, Sattar A, Benanti M, Hollander S, Cheuck L. Magnetic Resonance Spectroscopy as an Imaging Tool for Cancer: A Review of the Literature. J Am Osteopath Assoc 2006;106(1):23–27.
2. Süllentrop F, Hahn J, Moka D. In Vitro and In Vivo (1)H-MR Spectroscopic Examination of the Renal Cell Carcinoma. Int J Biomed Sci. 2012;8(2):94–108.
3. Steel A, Chiew M, Jezzard P, Voets NL, Plaha P, Thomas MA, Stagg CJ, Emir UE. Metabolite-cycled density-weighted concentric rings k-space trajectory (DW-CRT) enables high-resolution 1 H magnetic resonance spectroscopic imaging at 3-Tesla. Scientific reports. 2018 May 17;8(1):7792.
4. Provencher SW. Estimation of metabolite concentrations from localized in vivo proton NMR spectra. Magnetic resonance in medicine. 1993 Dec;30(6):672-9.
Figures