2639
Improved Diffusion-Weighted Imaging of Rat Kidney Using Interleaved Multishot EPI with 2D Navigators1School of Biomedical Engineering, Guangdong Provincial Key Laboratory of Medical Image Processing, Southern Medical University, Guangzhou, China, 2Department of Radiotherapy, Cancer Center, Guangdong Provincial People's Hospital & Guangdong Academy of Medical Science, Guangzhou, China, 3School of Medicine, Guangdong Provincial People's Hospital , South China University of Technology, Guangzhou, China, 4Institute of Electrical Engineering, Chinese Academy of Sciences, Beijing, China, 5Laboratory of Biomedical Imaging and Signal Processing, The University of Hong Kong, Hong Kong SAR, China, 6Department of Electrical and Electronic Engineering, The University of Hong Kong, Hong Kong SAR, China
Synopsis
This work aimed to improve rat kidney diffusion-weighted imaging (DWI) by using interleaved multishot echo planar imaging (EPI) with 2D navigators. The data of shots were combined to reconstruct the final images by using the IRIS processing pipeline. The in vivo rat imaging results show that the multishot EPI approach obtained renal diffusion-weighted images with higher resolution and less geometric distortion, compared single-shot EPI. The DWI of rat kidney can be significantly improved by 2D navigated multishot EPI.
Introduction
Diffusion-weighted imaging (DWI) techniques applied in kidney provide promising results to differentiate pathological from normal tissues in renal tumors, renal artery stenosis and transplant rejection1. DWI in kidney mainly relies on single-shot EPI (ss-EPI) which is insensitive to motion. However, the imaging resolution of ss-EPI is generally low because of limited acquisition window. In addition, ss-EPI based kidney DWI may suffer from severe geometric distortion caused by local field inhomogeneity2. Recently, the interleaved multi-shot EPI (ms-EPI) technique3, which separates the acquisition of the whole k-space into multiple k-space segments, was shown to be able to achieve high-resolution DWI of the brain. The purpose of the study is to assess the feasibility of using interleaved ms-EPI to improve the DWI of rat kidney at 7T Bruker system.Methods
All experiments were performed under Institutional Review Board approval. The 2D navigated ms-EPI sequence4 was implemented on 7T Bruker MRI scanner. The acquisition bandwidth of navigator echo was adjusted to match the distortion of image echo5. Both ss-EPI and 2D navigated 4-shot EPI were performed with the following parameters: TR 3000 ms, TE 65.9 ms for ss-EPI, TE 28 ms for ms-EPI, b value of 500 s/mm2, 1.5-mm slice thickness, 5 slices, 0.43 mm × 0.57 mm in plane resolution, 55 × 55 mm2 field of view, 15 diffusion directions, number of repetition 2, scan time 1 min 48 s for ss-EPI, and 7 min 25 s for ms-EPI. The T2-weighted images are acquired as anatomical reference with the following parameters: TR/TE 3000 ms/40 ms, 1.5-mm slice thickness, 5 slices, 0.36 mm × 0.36 mm in plane resolution, 55 × 55 mm2 field of view, number of average 4, RARE factor 8, scan time 3 min 36 s. Respiratory trigger was used to minimize the effect of respiratory motion.Ms-EPI images were offline reconstructed using the approach of image reconstruction using image-space sampling function (IRIS)4, mean diffusivity (MD) and fractional anisotropy (FA) were calculated for comparison. All the processes were implemented in Matlab R2016b (Mathworks Inc., Natick, MA, USA).
Results
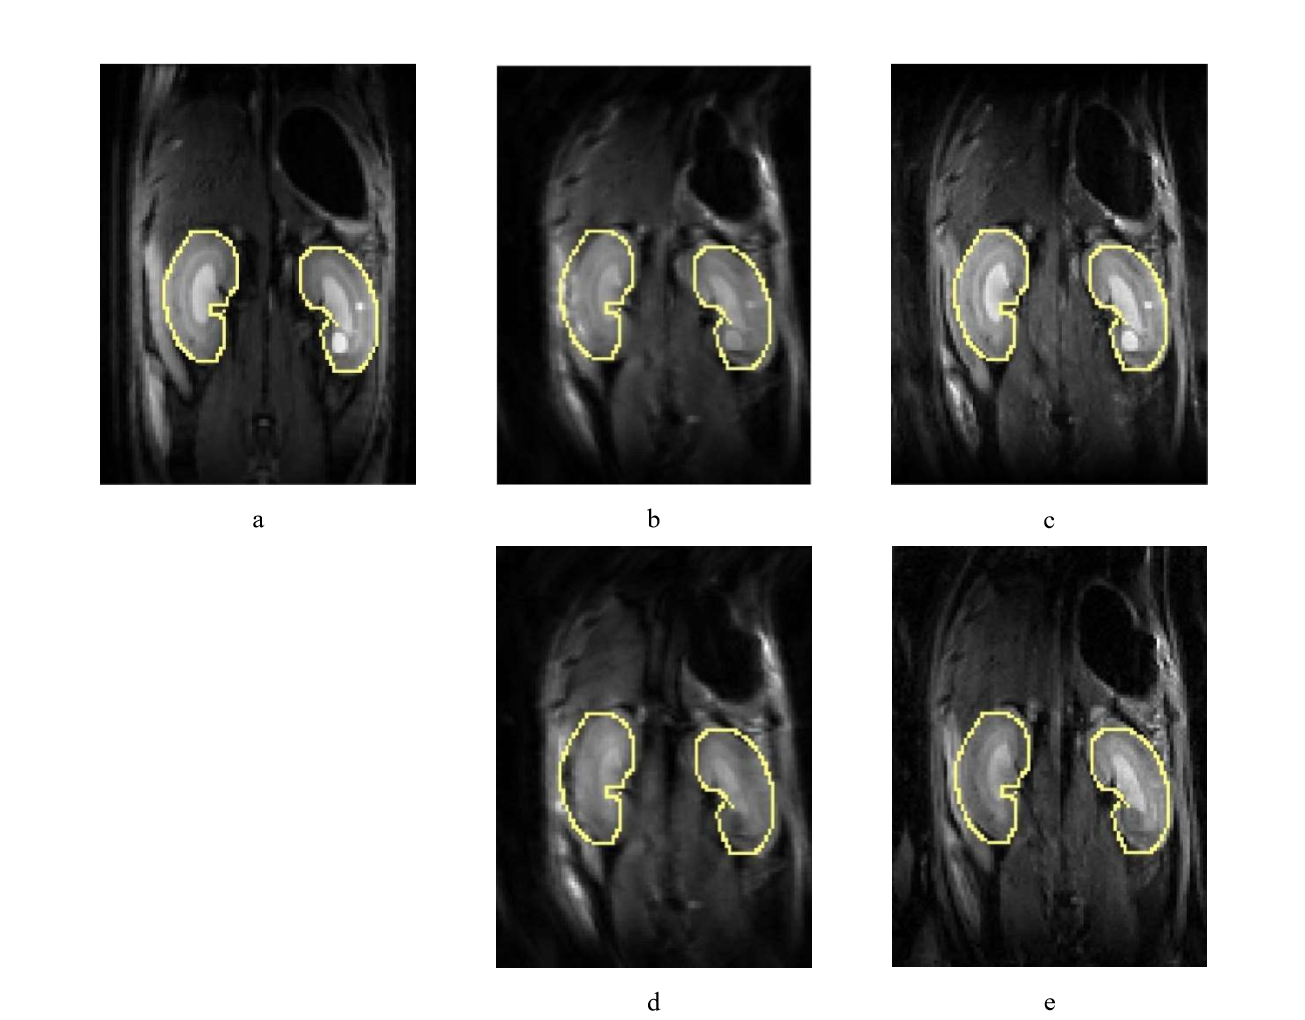
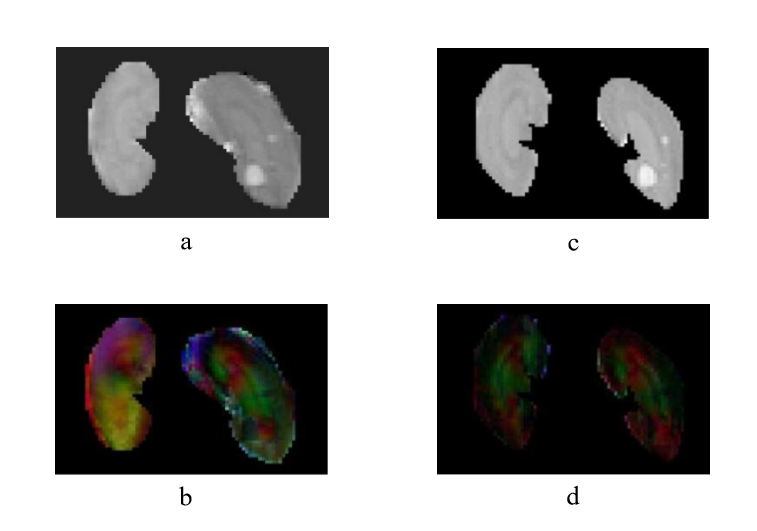
Figure 1 compares the DWI results of ss-EPI (Figure 1b, d) and ms-EPI (Figure 1c, e) of rat’s kidney at b values of 0 (Figure 1b, c) and 500 s/mm2 (Figure 1d, e). The kidney edges, the margin between different renal layers and the abnormal lesions were better defined in diffusion-weighted images of ms-EPI than those in the images of ss-EPI. With regard to geometric distortion, the kidney edge in ms-EPI images was in better agreement with the reference edges of kidney in T2-weighted image, compared with the kidney edge in ss-EPI images.The results of corresponding MD and color-encoded FA maps are presented in Figure 2. The MD map of ms-EPI was substantially sharper than that of ss-EPI. There was a notable difference between left and right kidneys in the FA maps, while left and right kidneys in the FA maps of ms-EPI showed similar appearance.
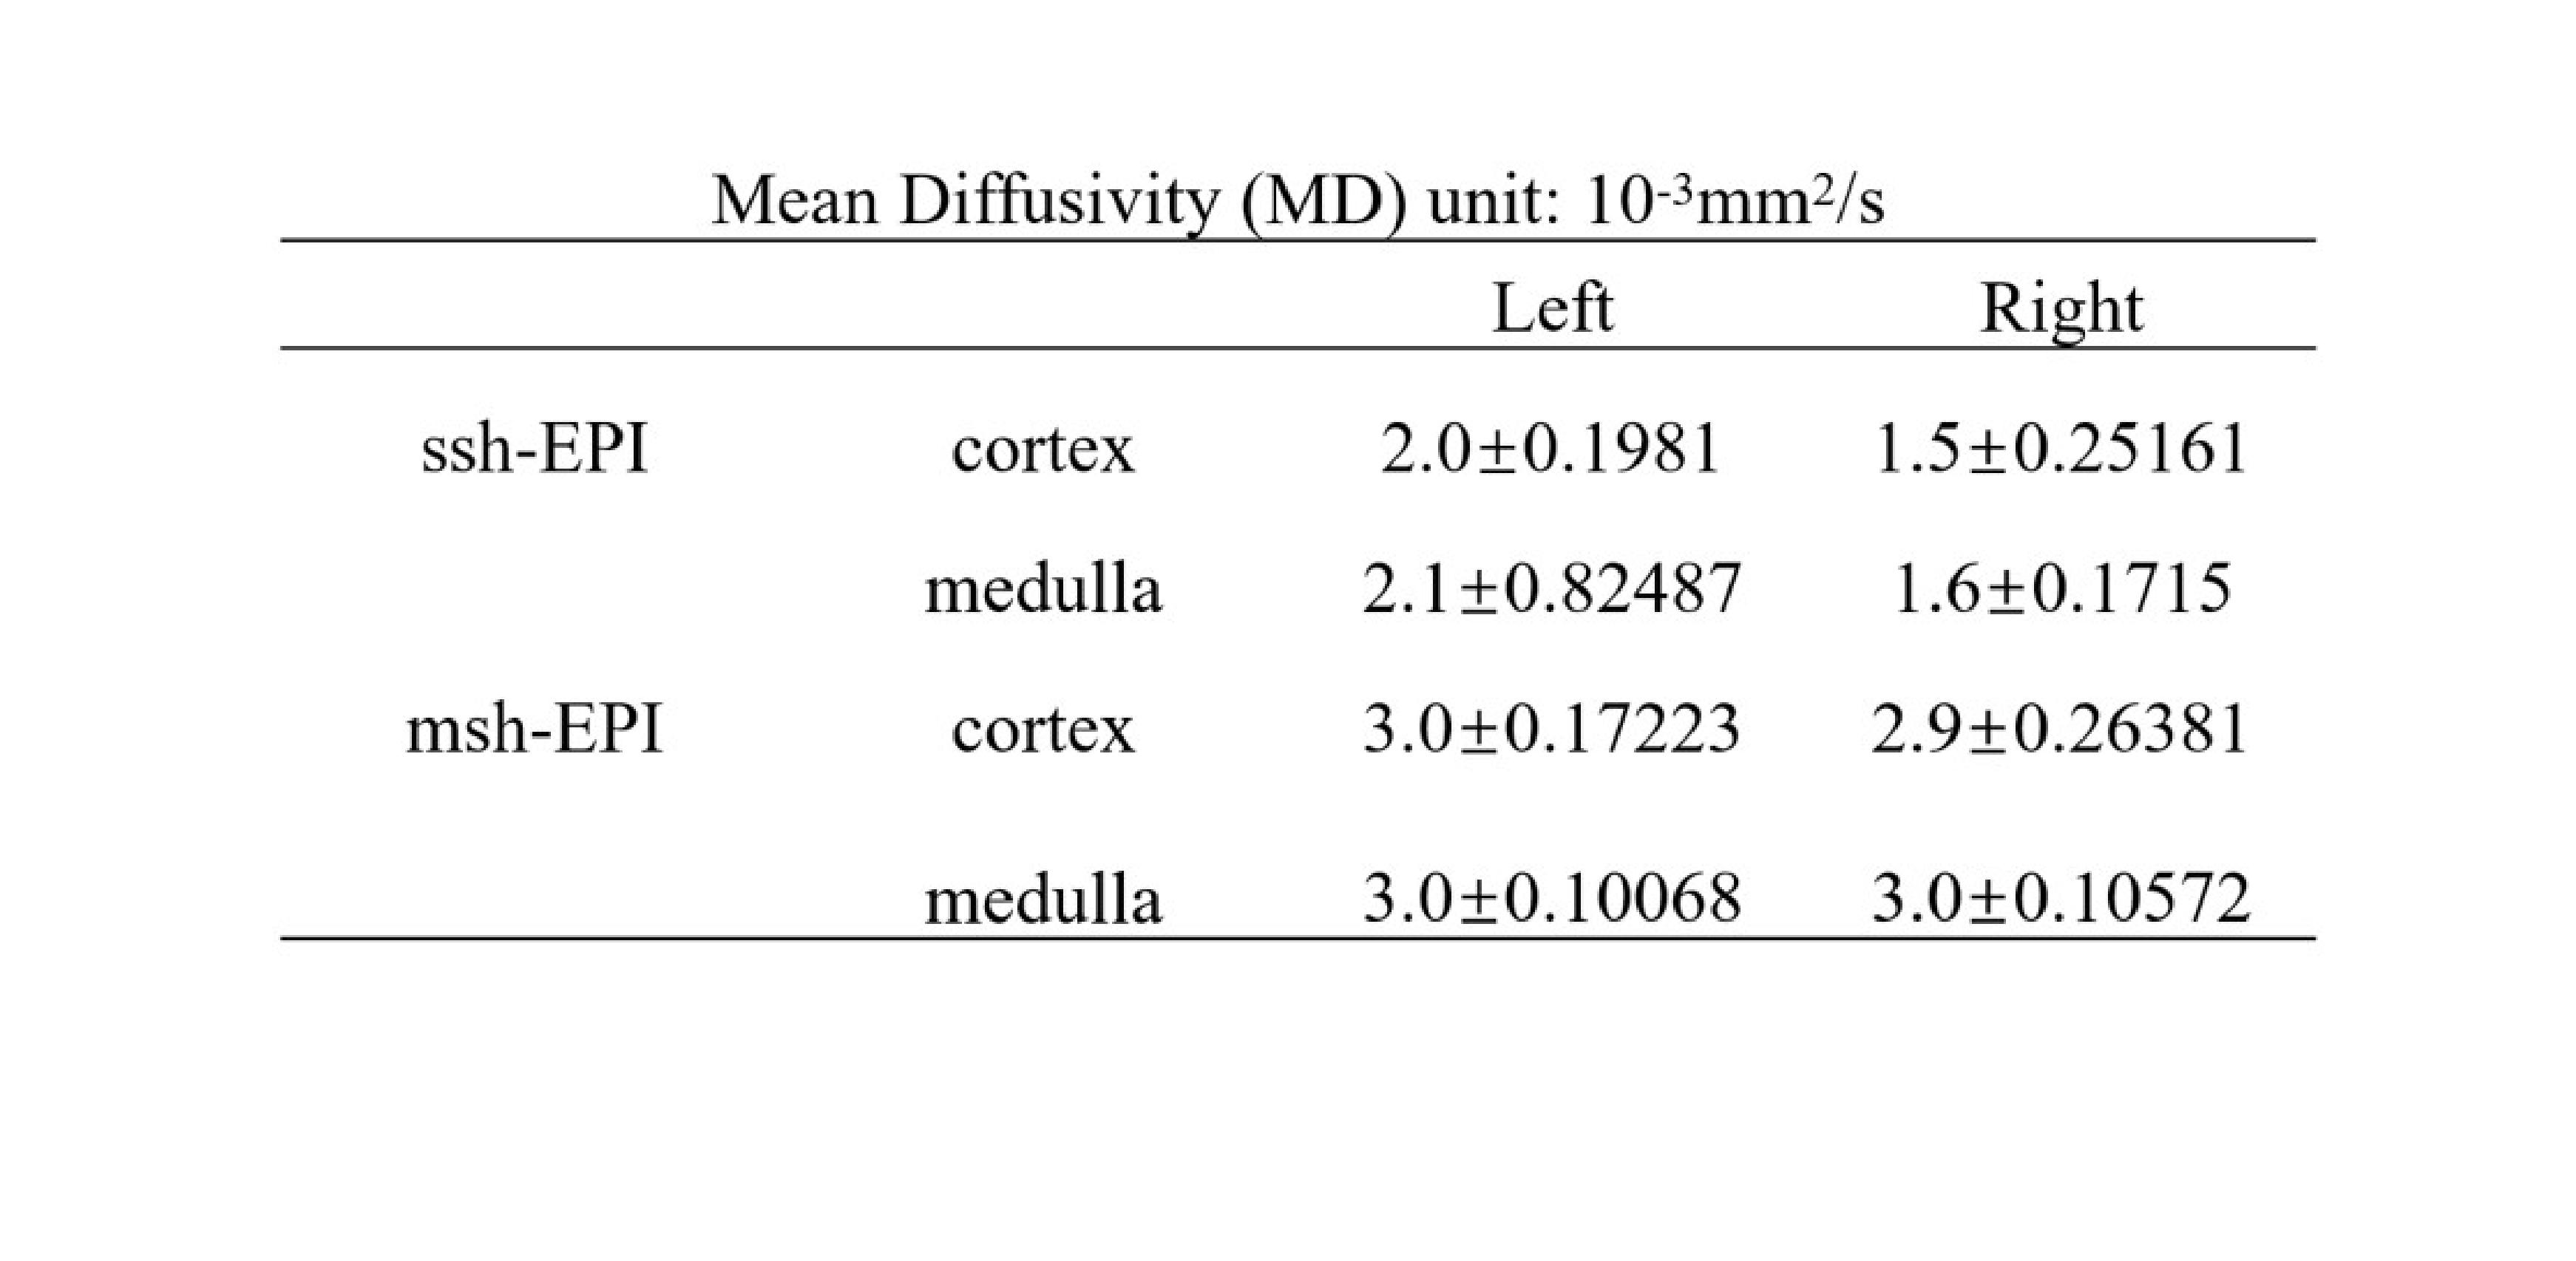
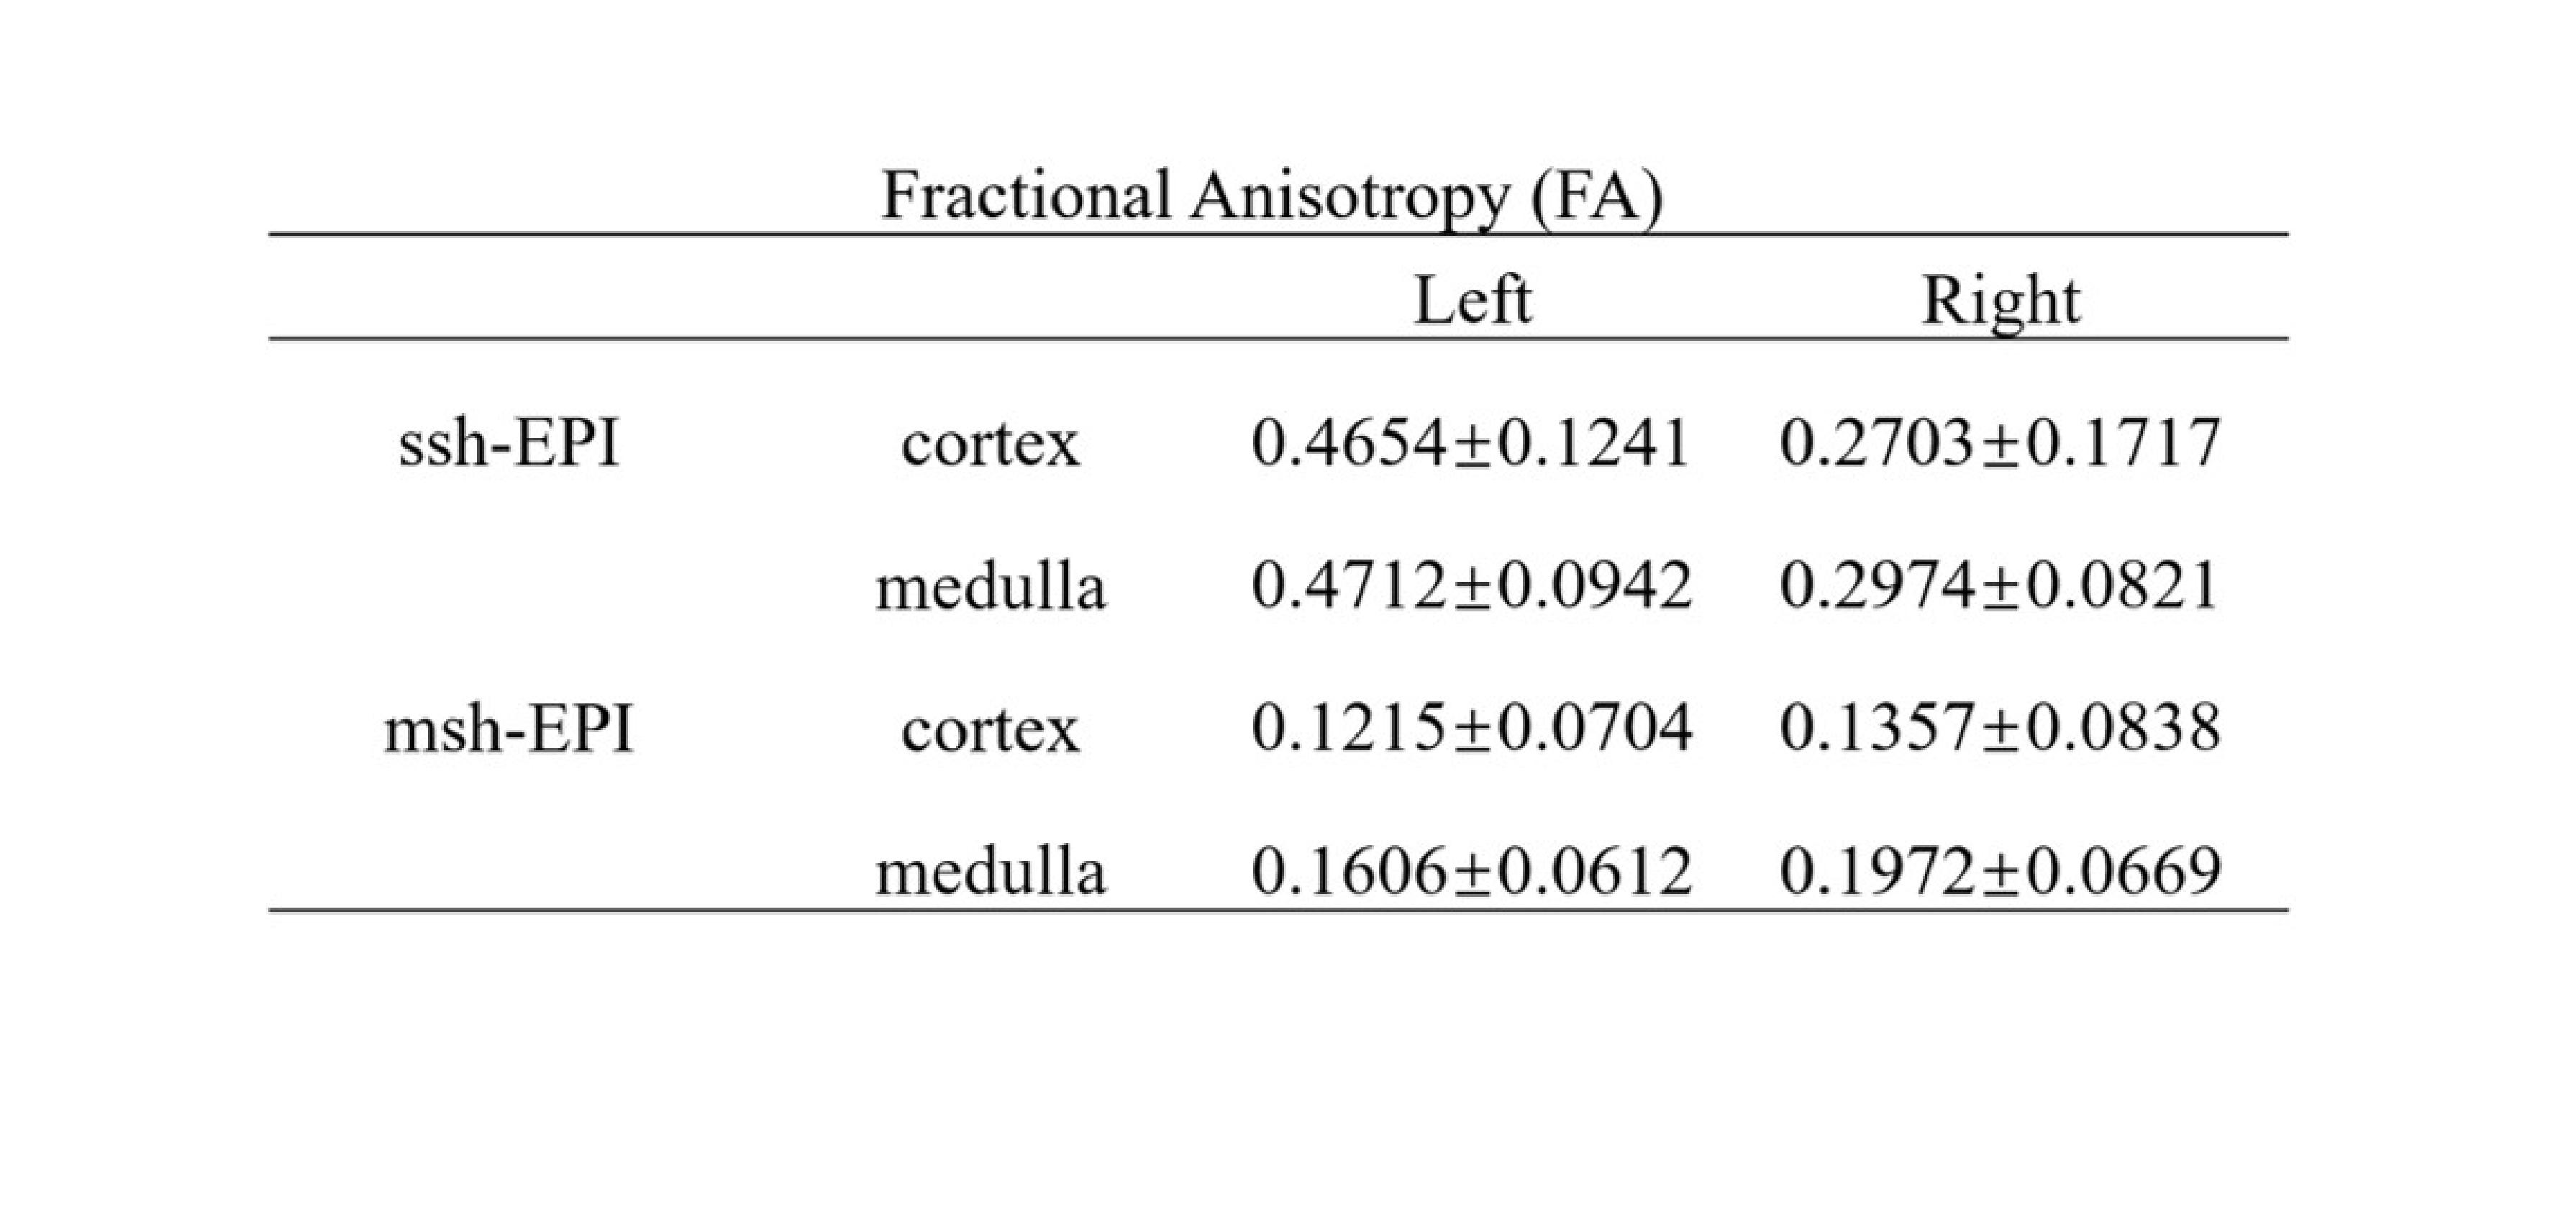
Table 1 and Table 2 summarize the mean and standard deviation of MD and FA values in the cortex and medulla of left and right kidneys, respectively. For ss-EPI, the mean MD values and FA values in both the cortex and medulla of the right kidney were lower than those of the left kidney. In contrast, ms-EPI yielded very close mean MD values and FA values between the left and right kidneys for both the cortex and medulla. In addition, the standard deviation of MD and FA measurements in the medulla from ms-EPI were smaller in than those from ss-EPI.
Discussion
In this work, we implemented 2D navigated ms-EPI sequence on a 7T Bruker scanner and validated its effectiveness on improving the DWI for rat kidney. Compared with ss-EPI, the improvements of DWI resolution in ms-EPI is because the signal acquisition duration of each k-space segment in ms-EPI shorter and thus it is less affected by the T2* decay of MR signal. The reduced geometric distortion in ms-EPI is because of the increased effective bandwidth along PE direction in ms-EPI than that in ss-EPI.The increased quality of DWI in rat kidneys implies improved robustness and reliability of diffusion-related quantitative metrics such as MD and FA. For ss-EPI, the large MD and FA difference between left and right kidneys are probably because of different geometric distortions caused by field inhomogeneity. In contrast, ms-EPI is less affected by field-inhomogeneity-caused image distortion than ss-EPI. As a result, ms-EPI obtains diffusion-related metrics which are comparable between left and right kidneys.
Conclusion
The ms-EPI technique can obtain rat kidney diffusion-weighted images with increased resolution and reduced distortion. Thus, ms-EPI has potential to improve the robustness and reliability of quantitative diffusion-related measures for the characterization of renal tissues in diseases.Acknowledgements
No acknowledgement found.References
1. Friedli I, Crowe LA, Viallon M, Porter DA, Martin P, de Seigneux S, Vallée J. Improvement of renal diffusion-weighted magnetic resonance imaging with readout-segmented echo-planar imaging at 3T. MAGN RESON IMAGING. 2015;33:701-708.
2. Ma X, Zhang Z, Dai E, Guo H. Improved multi-shot diffusion imaging using GRAPPA with a compact kernel. NEUROIMAGE. 2016;138:88-99.
3. Anderson AW, Gore JC. Analysis and correction of motion artifacts in diffusion weighted imaging. MAGN RESON MED. 1994;32:379-387.
4. Jeong H, Gore JC, Anderson AW. High-resolution human diffusion tensor imaging using 2-D navigated multishot SENSE EPI at 7 T. MAGN RESON MED. 2013;69:793-802.
5. Liu W, Zhao X, Ma Y, Tang X, Gao J. DWI using navigated interleaved multishot EPI with realigned GRAPPA reconstruction. MAGN RESON MED. 2016;75:280-286.
Figures