2638
A reproducibility study on the changes of R2’ in quantitative evaluation of acute renal injury1Peking University, Beijing, China, 2Fudan University, Shanghai, China, 3Department of Radiology, Peking University First Hospital, Beijing, China, 4Academy for Advanced Interdisciplinary Studies, Peking University, Beijing, China
Synopsis
Recent studies have demonstrated that a novel MRI imaging sequence termed psMASE, together with hemodynamic response imaging, is able to effectively distinguish different severities of acute renal injury. In this study, we performed repeated scanning to verify the repeatability of the psMASE strategy.
Introduction
Our recent studies have demonstrated that psMASE, as a novel MRI imaging sequence, combined with gas challenge, can quantitatively measure R2' signals in real time1. Meanwhile, the different degrees of acute renal injury can be identified by the change of R2’ value (dR2’) before and after gas challenge2. For further clinical applications, it is necessary to verify the reproducibility of this method. Here, we performed repeated scanning at a one-week interval over a 30-day period, then Bland-Altman analysis was used to verify the consistency of dR2' in each group.Methods
MRI MethodsAnimal experiments were performed in accordance with the guidelines and approval of the Animal Care and Use Institutional Committee. The experimental subjects were 24 New Zealand white rabbits that were divided into four groups. The mild, moderate and severe acute renal injury models were created by injecting 20,000, 40,000 and 60,000 doses of microspheres. The operation procedure used to prepare animal models were described in the previous article3. Each group was scanned after surgery using the psMASE sequence with alternating room air and carbogen mixture1. The detailed scan parameters were: FOV=150×150 mm², matrix size=70×70, repetition time= 2000 ms, TE1/TE2/TE3/TE4 = 60/80/100/120 ms, echo space = 20 ms, τ = -10/0/10 ms, slice thickness = 5 mm, SENSE factor = 2. After psMASE sequence, a T2w sequence was applied to identify the injured area with the following parameters: FOV=140×120 mm², matrix size = 140×140, TR=3000 ms, TE=80 ms, echo space = 20 ms, slice thickness = 5 mm, SENSE factor = 2. All subjects were scanned at a one-week interval.
Statistical analyses
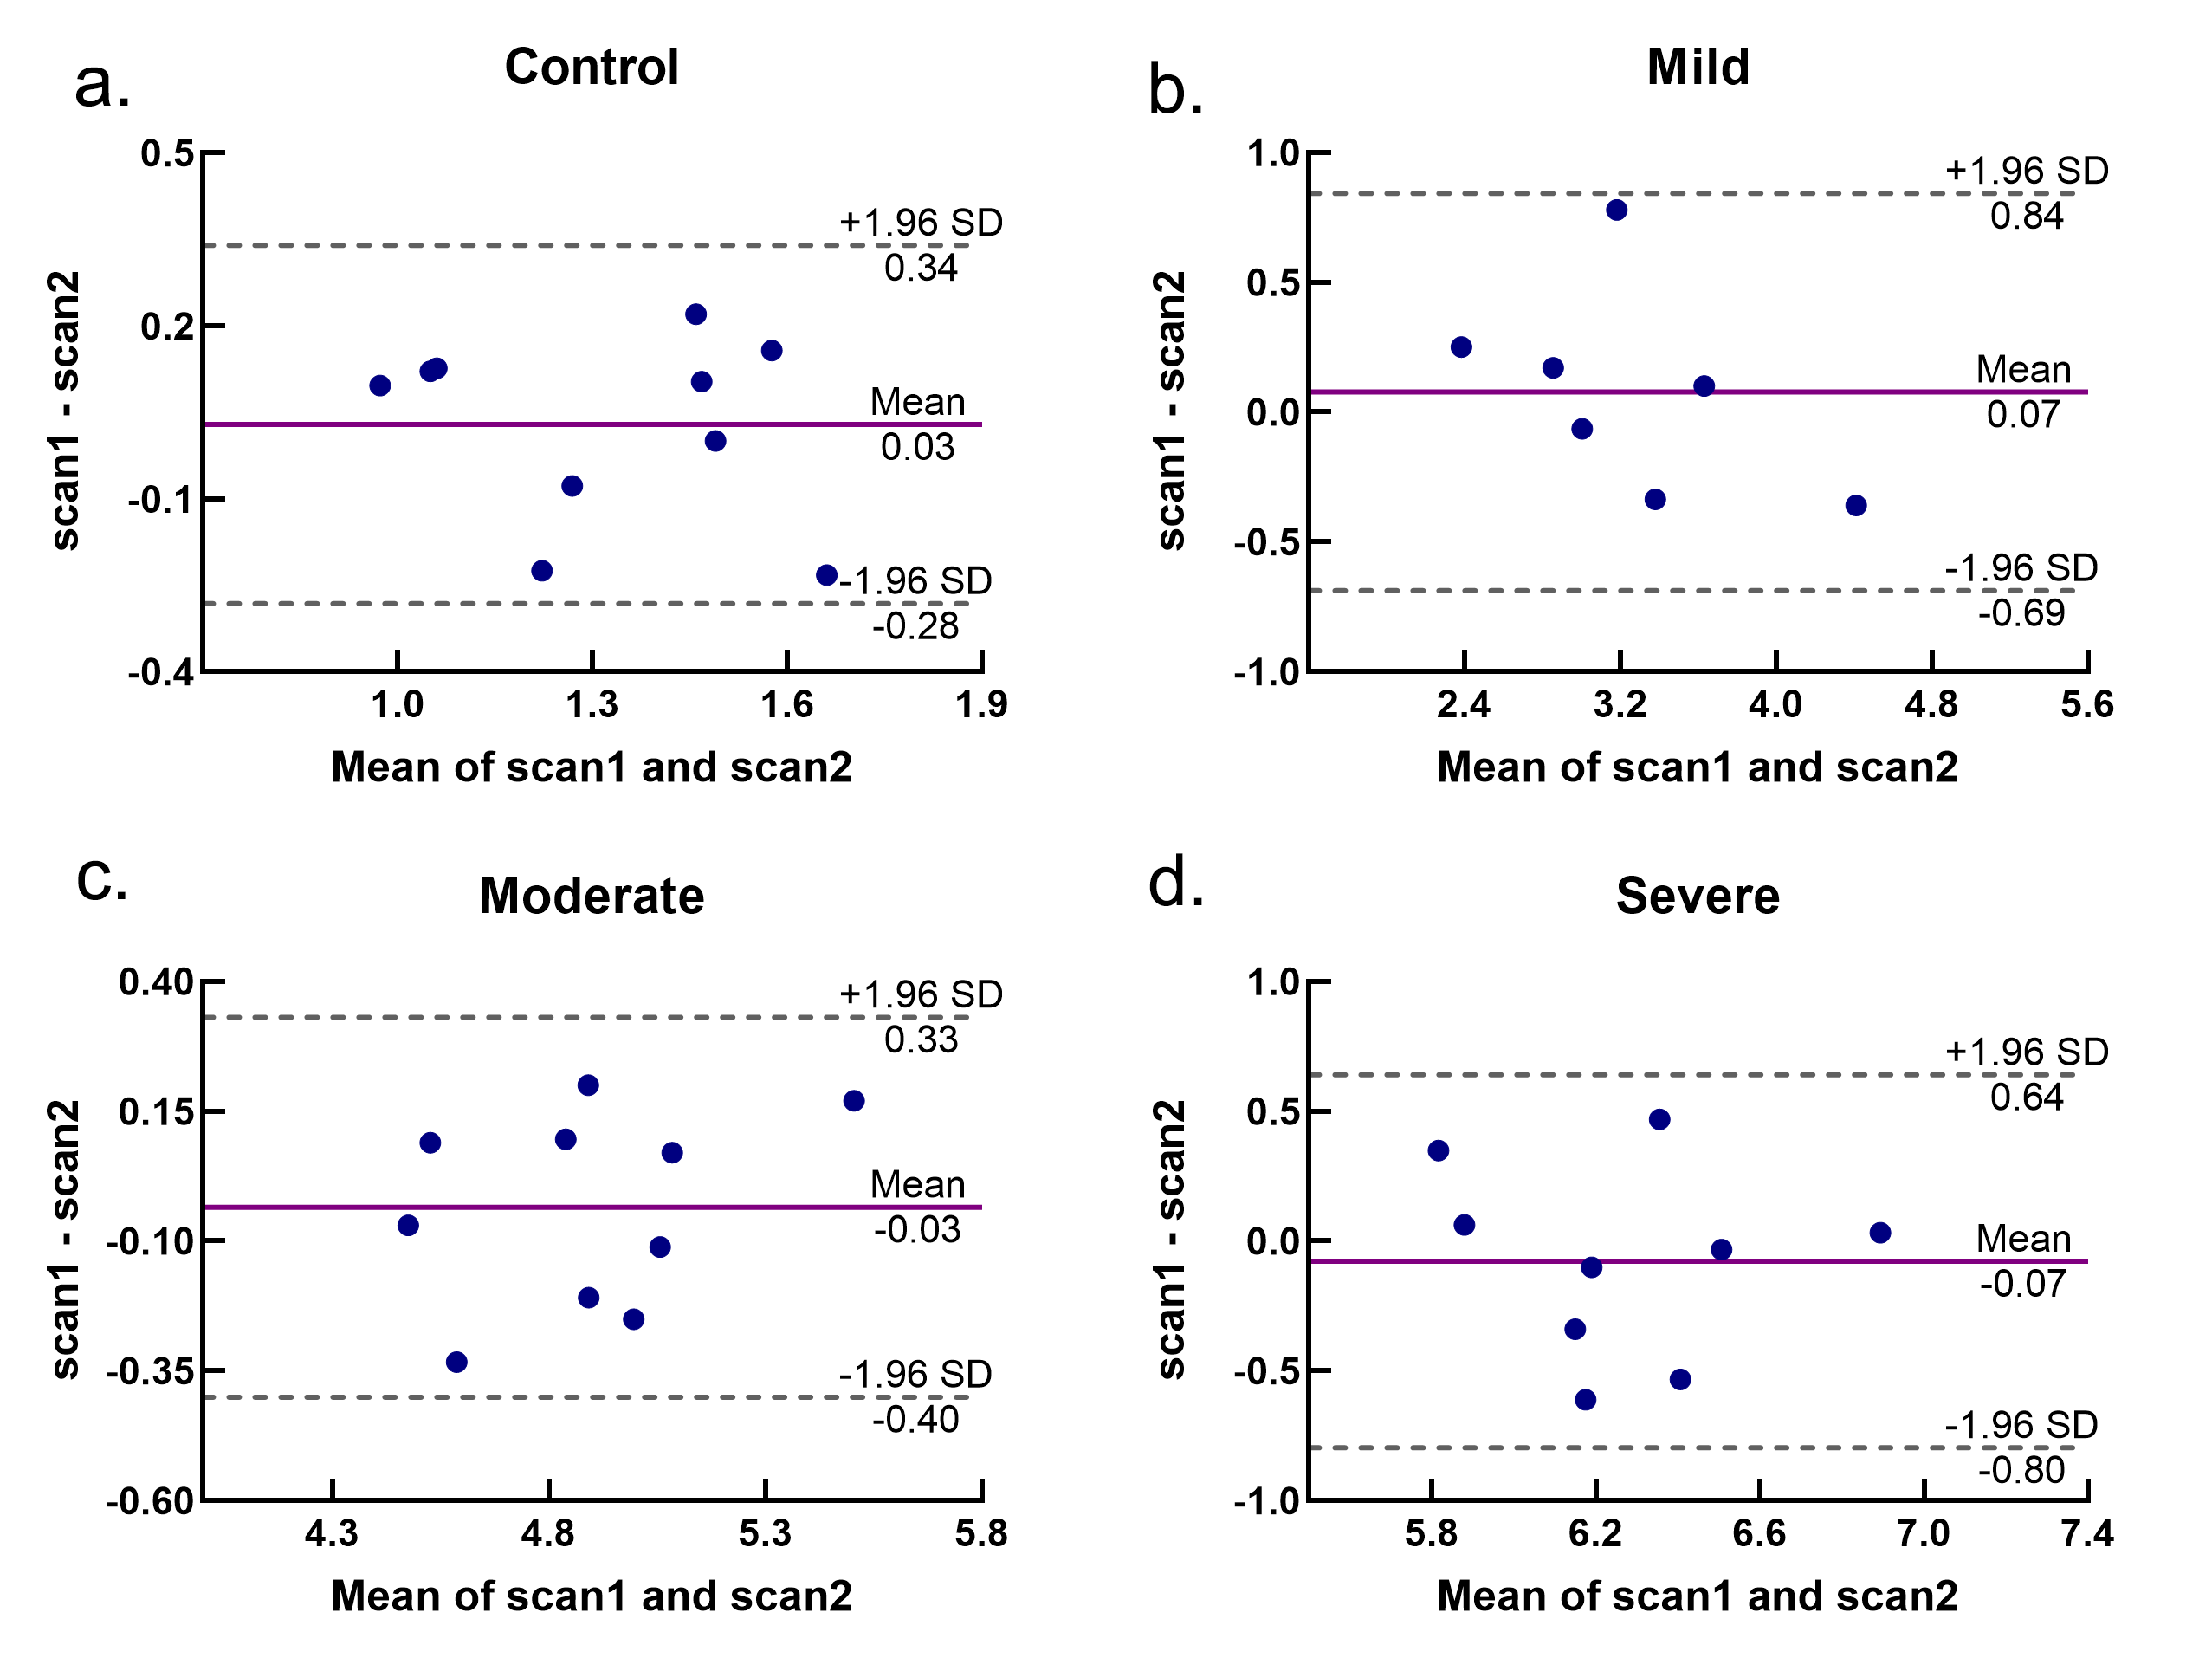
R2' map was generated according to the previous method1, with in-house software programed with MATLAB R2019a (MathWorks Inc., Natick, MA, USA). Then, the difference of R2’ between before and after gas challenge was calculated. Because of the time interval between two scans, the shape of the kidney was changed. Thus, the boundaries of the injured area and the whole kidney were marked by radiologists with more than five years' experience according to the scan results of T2w. The mean value of dR2’ in the injured area was calculated for a Bland-Altman analysis, including scatter plots and repeatability coefficients (RC). The RCs give the expected range of repeat measurements for 95% of subjects. Bland-Altman analysis was performed by Prism 8 (GraphPad Software Inc., San Diego, CA, USA).
Results
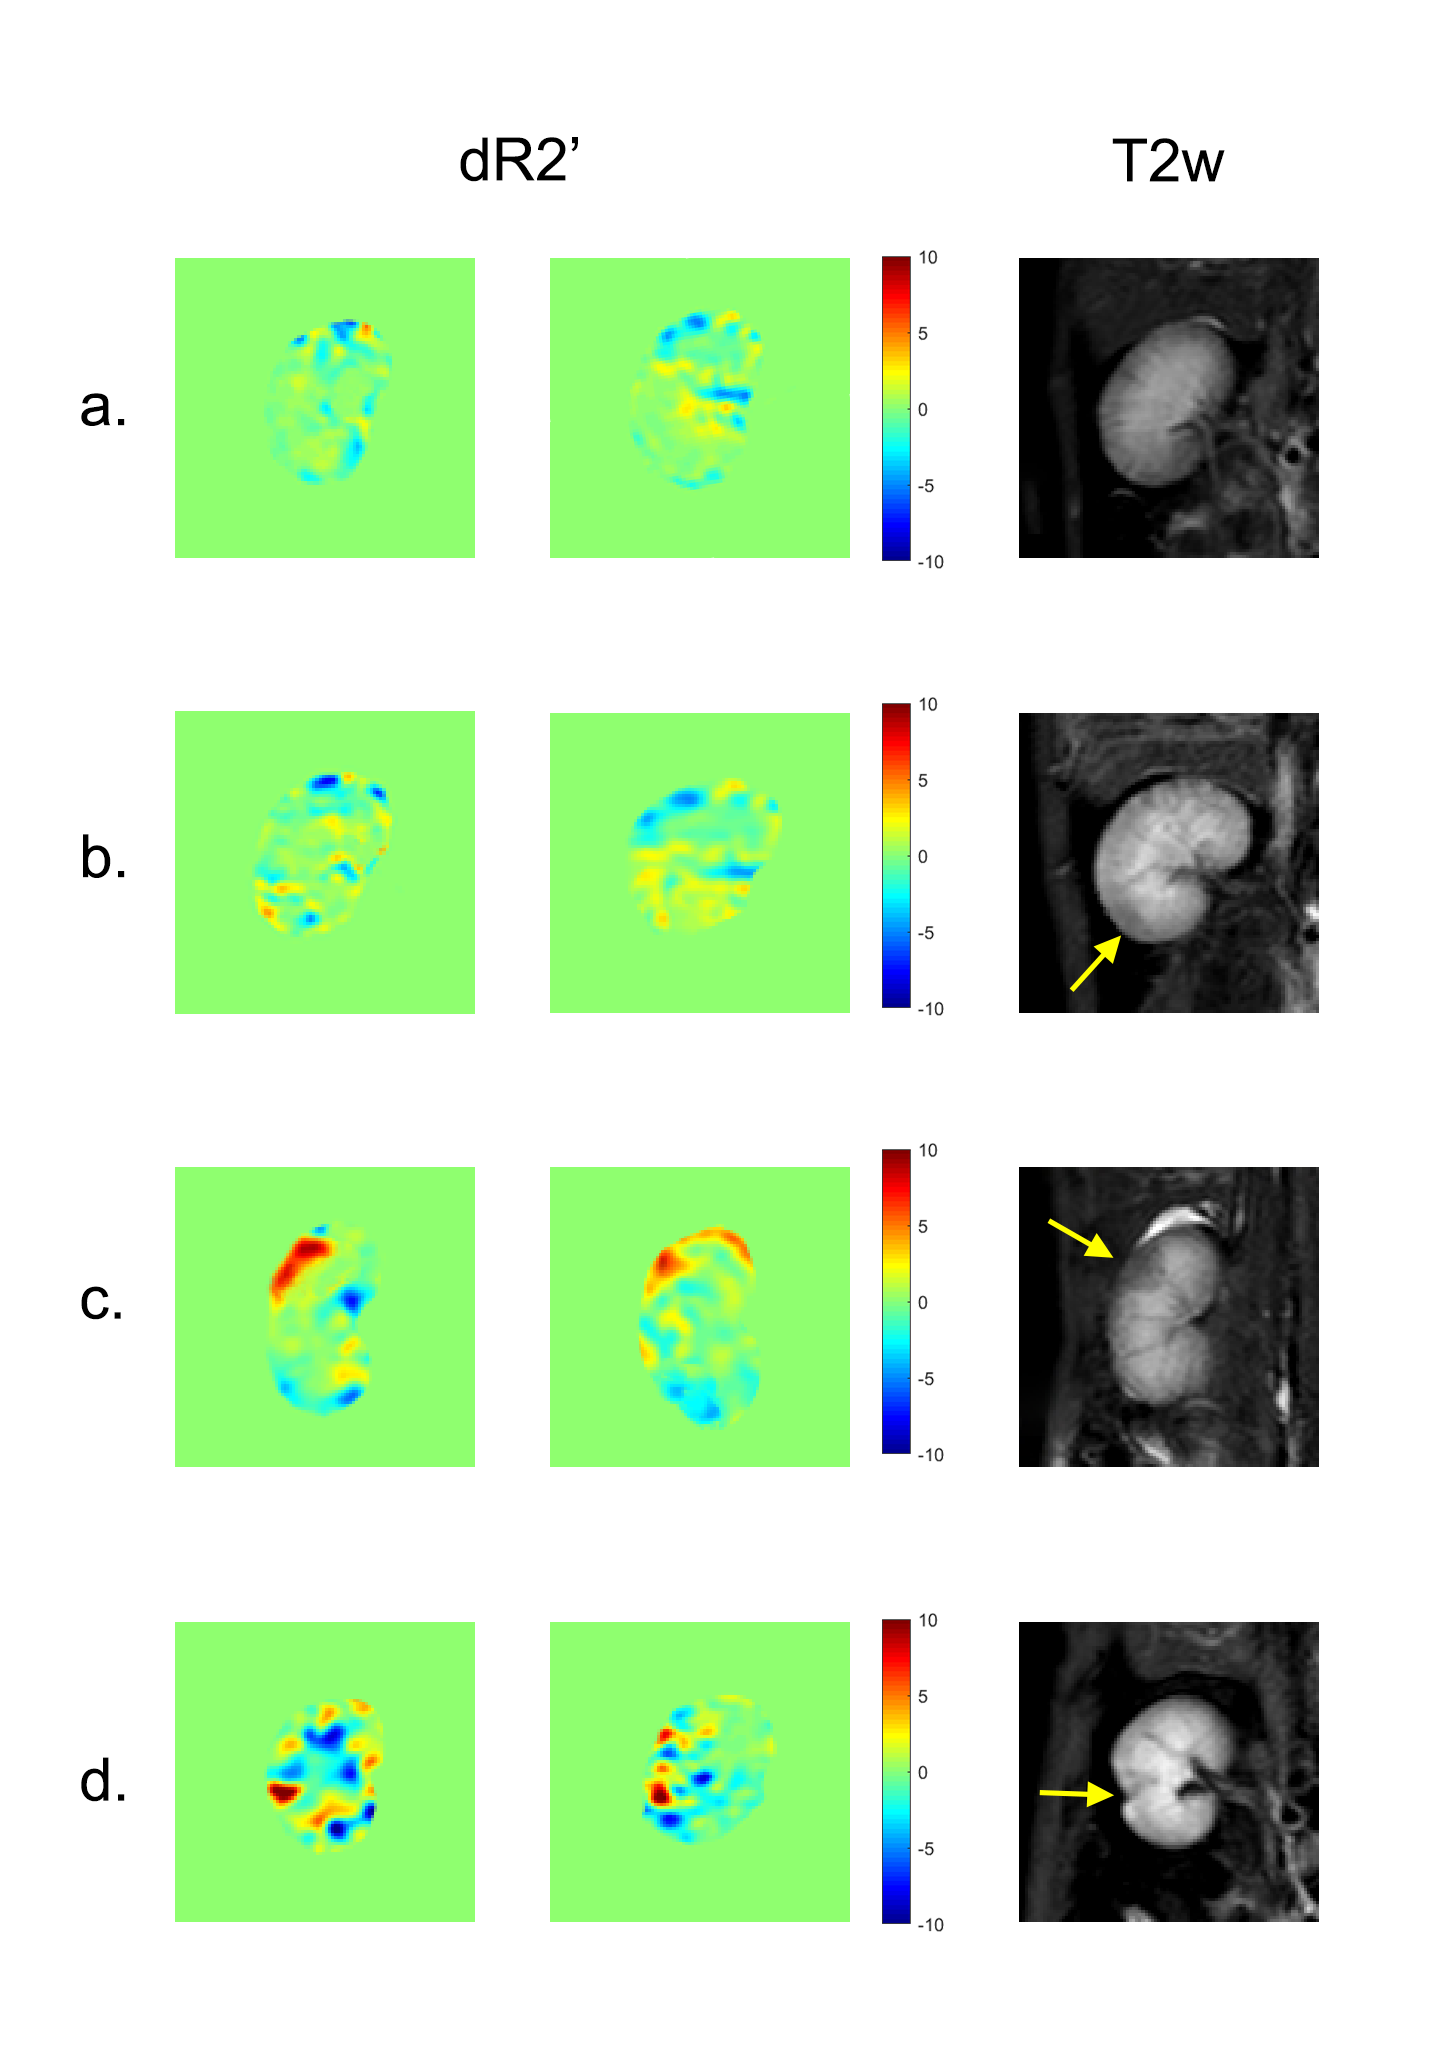
There were more than one affected area in some subjects, thus the selected injured areas in mild, moderate and severe groups were 7, 10 and 9 respectively. The typical lesions in each group are shown in Figure 1, with dR2’ maps and yellow arrows indicating the most affected area identified in T2w scan. Bland-Altman analysis results are shown in Figure 2. RCs for different degrees of injury varied from for control group, 20.0-26.7% for mild group, 6.77-8.32% for moderate group and 10.4-12.8% for severe group. Wilder range of 95% confidence limits were observed in mild group and control group, while the moderate group had the best consistency.Discussion
We repeated the psMASE strategy with gas challenge to verify the reproducibility. The differences between consistencies in each group might be affected by magnetic field inhomogeneity and motion artifact, but they're still within the range of repeatability. Therefore, the evaluation of dR2' value for acute kidney injury model has a good consistency, which further provides strong evidence for further clinical application.Acknowledgements
No acknowledgement found.References
1. Chengyan Wang , Bihui Zhang, et al. Hemodynamic response to respiratory challenge evaluated by dynamic R2’ imaging: application for acute renal ischemia caused by microsphere-induced renal artery embolism. ISMRM 2018
2. Weizheng Gao, Chengyan Wang, et al. The changes of R2’ in quantitative evaluation of acute renal injury: Preliminary animal study. ISMRM 2019
3. Kong H, Wang C, Gao F, et al. Early assessment of acute kidney injury using targeted field of view diffusion-weighted imaging: An in vivo study[J]. Magnetic resonance imaging, 2019, 57: 1-7.
Figures