2637
The reproducibility of DWI and BOLD in Early Diagnosis of Acute Kidney Injury in Animal Models1Peking University, Beijing, China, 2Fudan University, Shanghai, China, 3Peking University First Hospital, Beijing, China
Synopsis
Early diagnosis of acute kidney injury (AKI) has clinical importance. Blood oxygen level-dependent (BOLD) imaging and diffusion-weighted imaging (DWI) showed its priority in diagnosis of AKI in the early phase. However, the reproducibility of these methods remains unknown. In this study, we present repeated measurements of the DWI and BOLD renal MR imaging and further compared the quantitative results in terms of reproducibility.
Introduction
Acute kidney injury (AKI) is a common and serious problem affecting millions of lives[1]. Early diagnosis of acute kidney injury (AKI) has clinical importance. Blood oxygen level-dependent (BOLD) imaging and diffusion-weighted imaging (DWI) showed its priority in the diagnosis of AKI in the early phase[2]. However, the reproducibility of these methods remains unknown. There’s an urgent need for the reproducibility validation before large-scale clinical studies.Methods
The Institutional Animal Care and Use Committee approved all procedures and protocols in this study. Twenty New Zealand white rabbits (male, 3.09 ± 0.58 kg) underwent unilateral AKI surgery-induced by the injection of microsphere through the renal artery under the guidance of DSA. All the rabbits were given a standard rabbit diet and tap water. The animals were raised separately under the same conditions.All the MRI experiments were performed on a 3 T whole-body scanner (Philips Medical Systems, Best, The Netherlands). MRI scans were performed in 1 hours after the AKI procedure. For both BOLD and DWI sequences, two consecutive scans were obtained for reproducibility analysis. BOLD images were obtained with a multi-echo gradient-echo (GE) sequence: repetition time (TR) = 500 msec, echo times (TEs) = 4.6, 9.2, 13.8, 18.4, 23.0, 27.6, 32.2, 36.8 msec, flip angle = 25°, field of view (FOV) = 150 × 150 mm2, matrix size = 135 × 135, voxel size = 1.12 × 1.12 mm2, number of excitations (NEX) = 1. DWI was performed with a spin-echo echo-planar imaging (SE-EPI) sequence: TR = 3000 msec, TE = 65 msec, FOV = 150 × 150 mm2, matrix size = 128 × 128, NEX = 2. The diffusion gradient b values of 0 and 1000 s/mm2 were used.
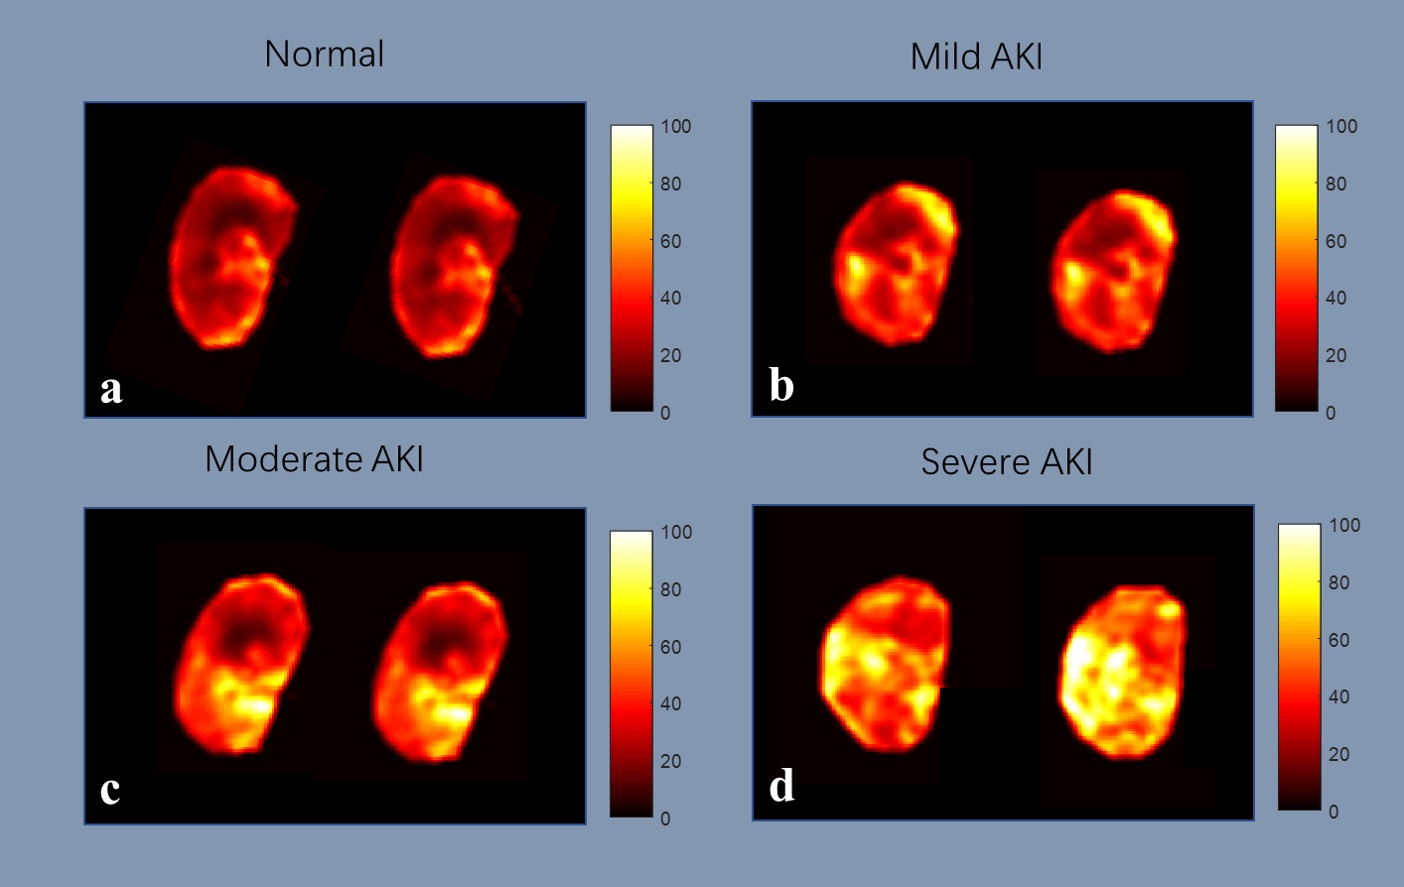
Image Analysis To calculate the R2* maps, mono-exponential fitting was performed through the multi-echo data according to the equation below:
S = S0 exp(-TE/T2*)
R2* = 1/T2*
To calculate the ADC maps, a mono-exponential model was used according to the equation below:
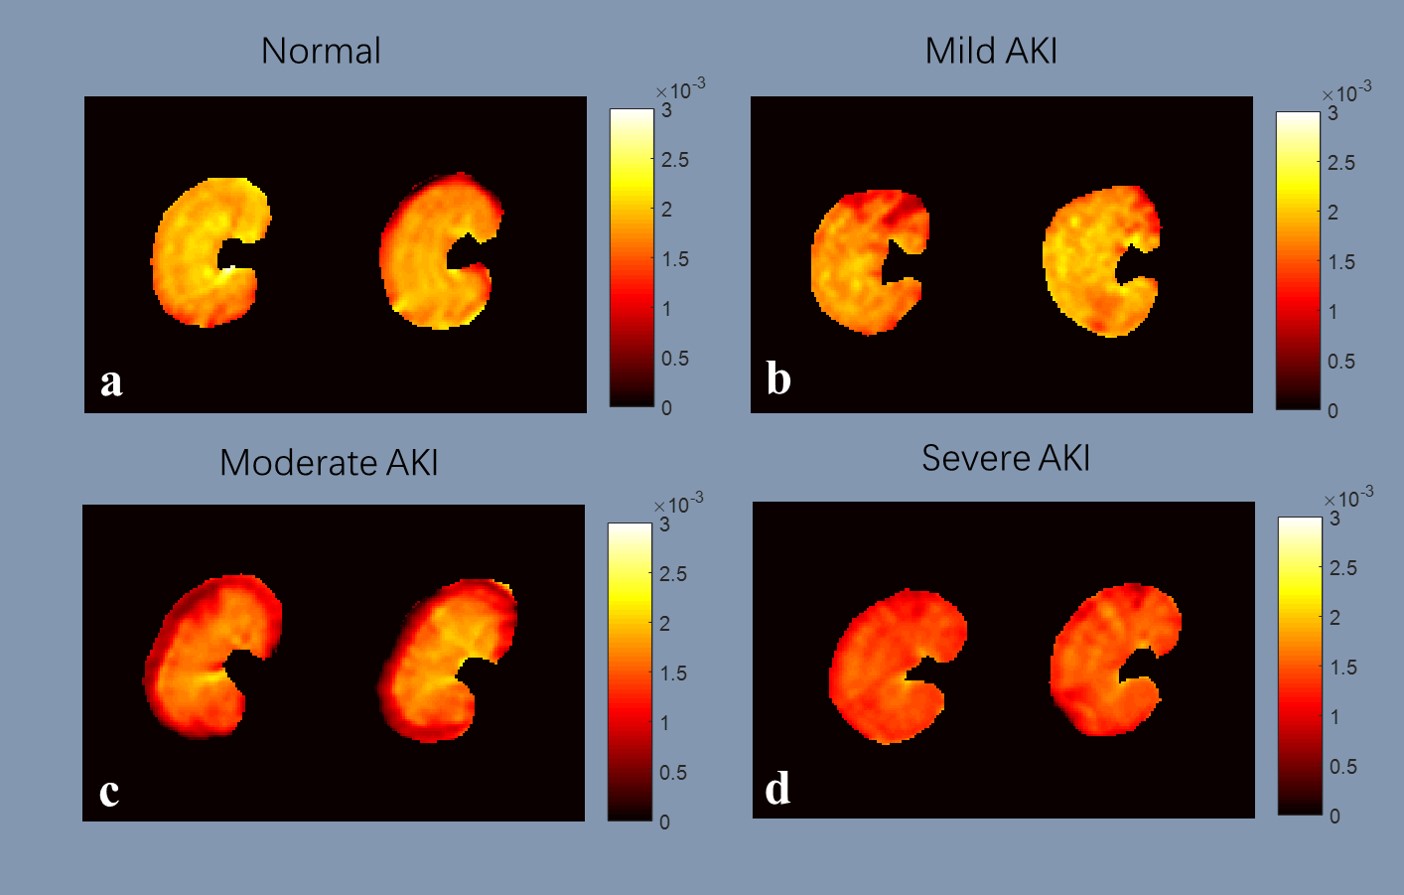
ADC = (lnS1000 - lnS0)/1000
Where is the signal intensity for a b value of 1000 s/mm2, is the signal intensity for a b value of 0 s/mm2. Lesion contours were delineated on BOLD images by a radiologist and saved as binary masks.
The delineated masks were loaded and multiplied with the corresponding R2* map and ADC map, and the mean and standard deviation of R2* and ADC values were calculated. All the calculations were performed using Matlab (MathWorks, Natick, MA).
Results
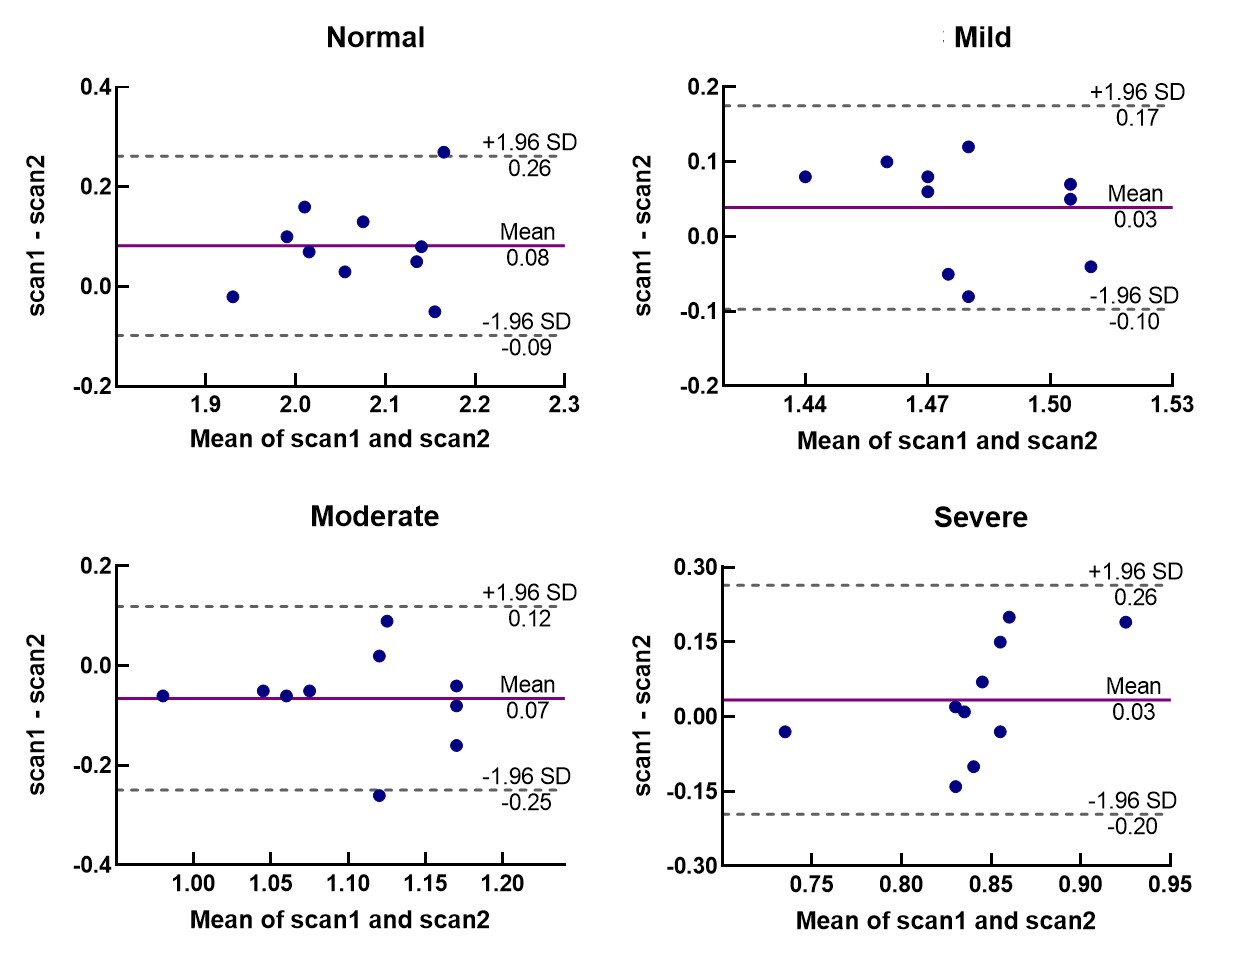
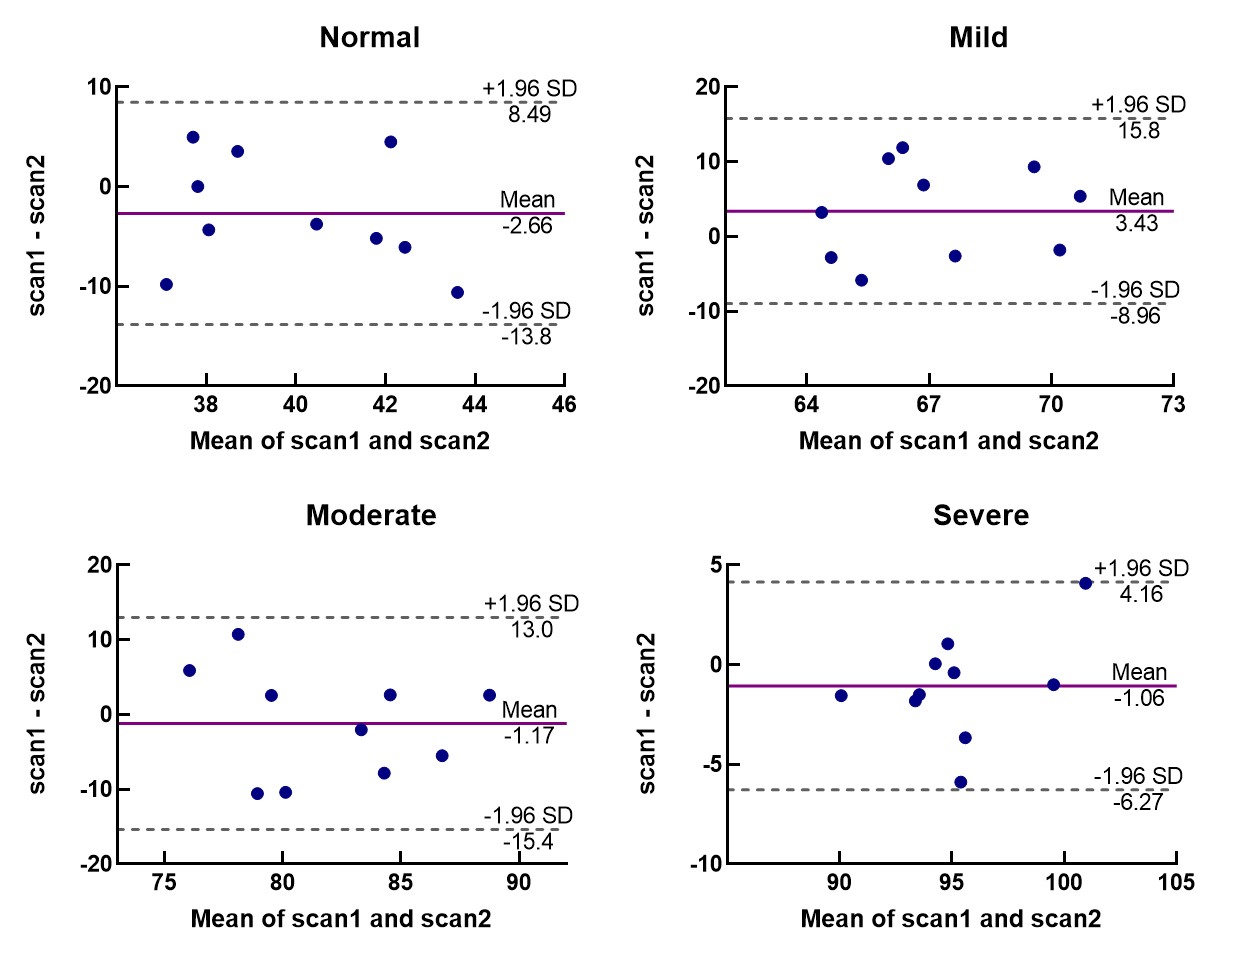
An overview of the obtained ADC and R2* maps are presented in Fig 1 and Fig 2. The Bland-Altman plots, including limits of agreement, are shown for ADC (Fig 3) and R2* (Fig 4). Wider 95% confidence limits were observed for measurement reproducibility of ADC values, especially in the severe group compared with other groups (Fig 3.).Discussion and Conclusion
We present repeated measurements of the DWI and BOLD renal MR imaging and further compared the quantitative results in terms of reproducibility. The variability in ADC and R2* measurements is likely multifactorial. Signal intensity might be influenced by magnetic field inhomogeneity, due to trapped air in the stomach and bowel. A large difference between cortex and medulla increases sensitivity to an ROI setting. Physiological variability in renal blood flow might also play a role. In conclusion, DWI and BOLD showed comparable and acceptable reproducibility in different AKI groups. As the first step to large scale studies, we have determined the reproducibility of renal quantitative MRI.Acknowledgements
No acknowledgement found.References
[1] KELLUM J A, LAMEIRE N, ASPELIN P, et al. Kidney disease: improving global outcomes (KDIGO) acute kidney injury work group. KDIGO clinical practice guideline for acute kidney injury [J]. 2012, 2(1): 1-138.
[2] ZHANG B, WANG Y, WANG C, et al. Comparison of blood oxygen level‐dependent imaging and diffusion‐weighted imaging in early diagnosis of acute kidney injury in animal models [J]. 2019,
Figures