2634
T2* Relaxation Time as an Imaging Biomarker for Monitoring Liver Arterial Blood Supply After Partial Hepatectomy1Tianjin First Center Hospital, Tianjin, China, 2MR Collaboration, Siemens Healthcare, Beijing, China
Synopsis
The value of effective T2 (T2*) relaxation time in monitoring changes in liver arterial blood supply after partial hepatectomy was investigated using a rat model. Ten rats received a 30% hepatectomy, and the other ten received a 70% hepatectomy. Before and after the surgery, all animals underwent T2* mapping at multiple time points. Liver T2* relaxation times were measured and compared between different groups at each time point. The results indicated that T2* relaxation time can be used to monitor changes in liver arterial blood supply after partial hepatectomy.
Introduction
Partial hepatectomy is often used to treat liver tumors and is performed on living liver donors[1]. Residual liver regeneration is closely related to patient prognosis. Hypoxia may reduce the ability of the residual liver to regenerate[2-3]. Therefore, the accurate assessment of the hepatic oxygen supply is very important for estimating liver regeneration capacity. T2* relaxation time is a sensitive indicator for assessing the changes in oxygen pressure within tissue[4-5]. In the liver, oxygen is provided by the hepatic artery. Thus, the T2* relaxation time of liver parenchyma may reflect the changes in blood supply from the hepatic artery. In this study, we aimed to investigate the value of liver T2* relaxation time for monitoring changes in liver arterial blood supply after partial hepatectomy using a rat model.Methods
Twenty rats were divided into two groups; the animals in one group received 30% hepatectomies, and the other group received 70% hepatectomies. All animals underwent MR examinations on a 3T MRI scanner (MAGNETOM Prisma, Siemens Healthcare, Erlangen, Germany) with an 8-channel experimental animal coil (Chenguang, Shanghai, China). The MR examinations were conducted at multiple time points: baseline, and 1 hour, 1 day, 2 days, 3 days, 5 days, 7 days, 14 days and 21 days after surgery. Liver T2* mapping was acquired using a multi-echo gradient echo sequence with repetition time (TR) = 400ms and 6 echo times (TEs) in the range of 2.46 to 15.01 ms, with an echo interval of 2.51ms and 4 signal averages. T2* parametric maps were inline generated after data acquisition using MapIt software (Siemens Healthcare, Erlangen, Germany). Liver T2* relaxation times were compared between the two groups and different time points using the paired-sample t-test.Results
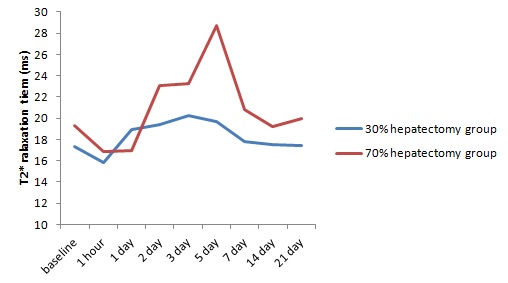
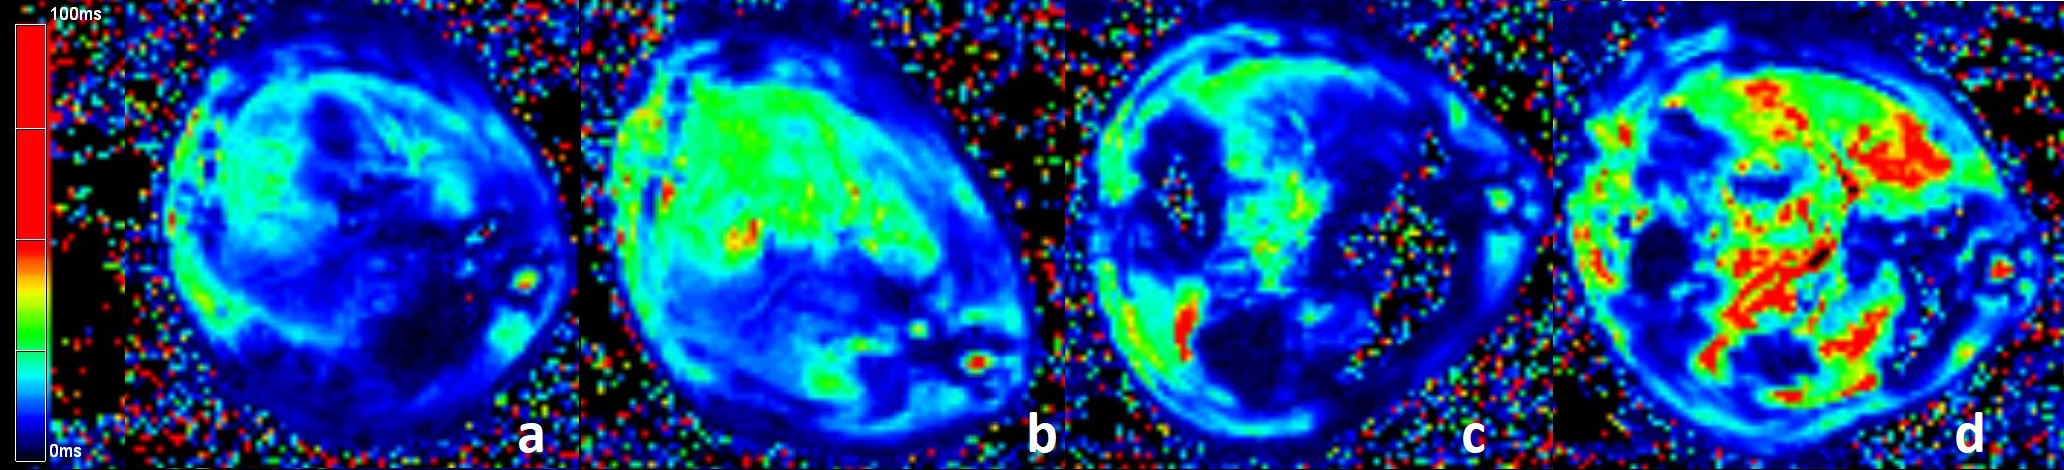
After surgery, the liver T2* relaxation times of the two groups initially decreased below the baseline, subsequently increased above the baseline, and finally returned to baseline (Figure 1). There were significant differences between the two groups in the mean liver T2* relaxation times at 2 days and 5 days after surgery (P<0.05, Table 1, Figure 2). In the 30% hepatectomy group, mean liver T2* relaxation times at 2 days, 3 days, and 5 days after surgery were significantly higher than at baseline, and mean liver T2* relaxation times was significantly higher at 1 day than 1 hour post-surgery (P<0.05, Table 2). In the 70% hepatectomy group, T2* relaxation times were significantly higher at 3 days post-surgery than at baseline (P<0.05); there were no significant differences in liver T2* relaxation times between adjacent time points (all P>0.05, Table 2). Due to surgical errors, one rat in the 30% hepatectomy group died, and three rats in the 70% hepatectomy group died.Discussion
In the 30% hepatectomy group, mean liver T2* values were highest at 3 days after surgery. In the 70% hepatectomy group, mean liver T2* values were highest at 5 days after surgery. In both groups, mean liver T2* values returned to baseline at 7 days, and remained steady from 7 days to 21 days after surgery. The results demonstrated that liver T2* relaxation times decreased immediately after partial hepatectomy, subsequently increased gradually and exceeded the baseline, and finally returned to baseline. These changes were consistent with normal regulatory processes. Immediately after surgery, the decrease in liver arterial blood supply may be due to vessel constriction and blood loss caused by surgery. Over time, the residual liver receives the blood supply of the entire liver, leading to an increase in the blood supply. As the liver regenerates and the body adjusts, the liver blood supply gradually returns to normal. These findings highlight the potential value of T2* for monitoring changes in liver arterial blood supply.Conclusion
The results of this study indicate that liver T2* relaxation times may reflect the changes in liver arterial blood supply after hepatectomy. Liver T2* relaxation times differed at only 2 days and 5 days after surgery between the two groups representing different percentages of hepatectomy. It may be useful to evaluate changes in the liver arterial blood supply at these two time points.Acknowledgements
No.References
[1] Clavien PA, Oberkofler CE, Raptis DA, et al. What is critical for liver surgery and partial liver transplantation: size or quality [J]. Hepatology. 2010;52(2):715-729.
[2] Van den Broek MA, Olde Damink SW, Dejong CH, et al. Liver failure after partial hepatic resection: definition, pathophysiology, risk factors and treatment[J]. Liver Int. 2008;28(6):767-780.
[3] Dold S, Richter S, Kollmar O, et al. Portal hyperperfusion after extended hepatectomy does not induce a hepatic arterial buffer response (HABR) but impairs mitochondrial redox state and hepatocellular oxygenation[J]. PLoS One. 2015;10(11):e0141877.
[4] Thulborn KR, Waterton JC, Matthews PM, et al. Oxygenation dependence of the transverse relaxation time of water protons in whole blood at high field[J]. Biochim Biophys Acta. 1982;714(2):265-270.
[5] Prasad PV, Edelman RR, Epstein FH. Noninvasive evaluation of intrarenal oxygenation with BOLD MRI[J]. Circulation.1996;94(12):3271-3275.
Figures