2633
Assessing Liver Changes after 30% and 70% Partial Hepatectomy Using T1 and T2 mapping1Tianjin First Central Hospital, Tianjin, China, 2MR Collaboration, Siemens Healthcare, Ltd, Beijing, China
Synopsis
T1 and T2 mapping of rats with 30% and 70% partial hepatectomy (PH) were compared, and trends were similar with some differences, indicating liver changes after PH in the 70% PH group was more active. The results suggested that T1 and T2 mapping are potential to assess liver regeneration after PH.
Synopsis
We enrolled nine and seven rats to undergo 30% and 70% partial hepatectomy (PH), respectively. All the rats underwent MRI examinations to obtain T1 and T2 mapping at baseline before surgery, and at 2h, day 1, day 2, day 3, day 5, day 7, day 14, and day 21 after surgery. We drew the trend charts of the T1 and T2 values and compared the T1 and T2 values in two groups across different time points. The trend charts of the T1 and T2 values were similar with some differences, indicating that liver regeneration in the 70% PH group was more active than that in the 30% PH group. The results suggested that T1 and T2 mapping are practical techniques to assess liver regeneration after PH.Introduction
Partial hepatectomy (PH) is an important treatment method for patients with liver tumors and is an important step in living donor liver transplantation (LDLT)1. Thus, evaluation of liver regeneration after PH is critical for determining the prognosis in patients with liver tumors as well as for liver donors and recipients. T1 and T2 parameters form a fundamental basis for generating the contrast of MRI, reflecting various properties of tissues such as macromolecular composition, water content, and other features. T1 and T2 mapping are emerging techniques that quantitatively analyze tissue T1 and T2 properties and allow for the precise investigation of tissue content and changes it undergoes2-4. In this study, we aimed to explore the value of T1 and T2 mapping in the assessment of liver changes in two groups of rats after 30% and 70% PH.Methods
A total of sixteen male Sprague-Dawley rats were enrolled and underwent 30% (n=9) and 70% (n=7) PH. All the rats underwent MRI examinations on a MAGNETOM Prisma 3T MR scanner (Siemens Healthcare, Erlangen, Germany) with an 8-channel animal coil (Chenguang, Shanghai, China). MR images were acquired before PH as a baseline, and subsequently at 2h, day 1, day 2, day 3, day 5, day 7, day 14, and day 21 after surgery. The T1 map was acquired using a 3D gradient echo sequence with the volumetric interpolated breath-hold examination (VIBE) sequence with dual-flip-angle (FA) method. The sequence parameters were as follows: TR = 6.30 ms, TE = 2.88 ms, Flip angles = 3° and 12°, bandwidth = 300 Hz/px, FOV = 120 × 97.5 mm2, slice thickness = 3 mm, and voxel size = 0.6 × 0.6 × 3 mm3. T2 mapping was acquired using a multi-echo spin echo sequence, with the following parameters: TR = 2000 ms, 6 TEs = 13/26/39/52/65/76 ms, bandwidth = 201 Hz/px, FOV = 120 × 120 mm2, slice thickness = 3 mm, and voxel size = 0.5 × 0.5 × 3 mm3. Parametric T1 and T2 maps were generated inline after data acquisition by the MapIt software (Siemens Healthcare, Erlangen, Germany). Trend charts of the T1 and T2 values at different time points in the 30% and 70% PH groups were drawn. Student’s t test was used to compare the T1 and T2 values in the 30% and 70% PH groups at different time points using SPSS Statistics 19.0 (IBM Corp., Armonk/NY, USA). A P value < 0.05 was regarded to be statistically significant.Results
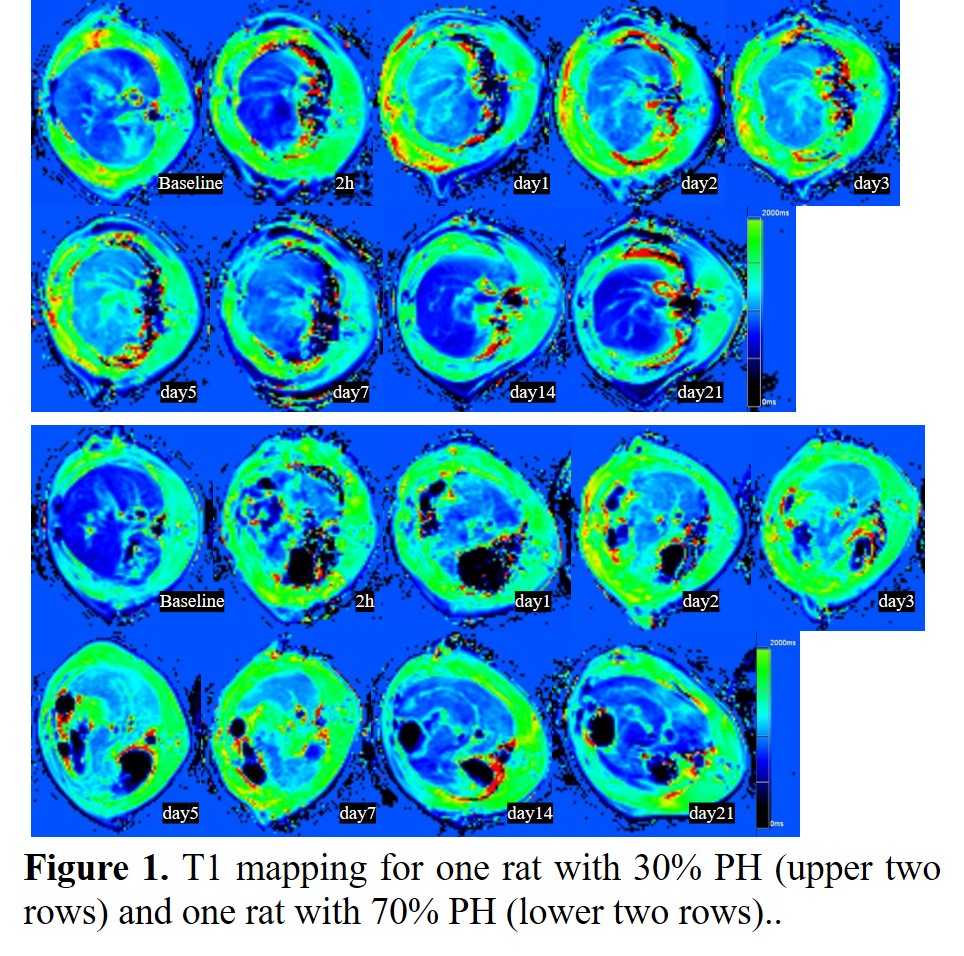
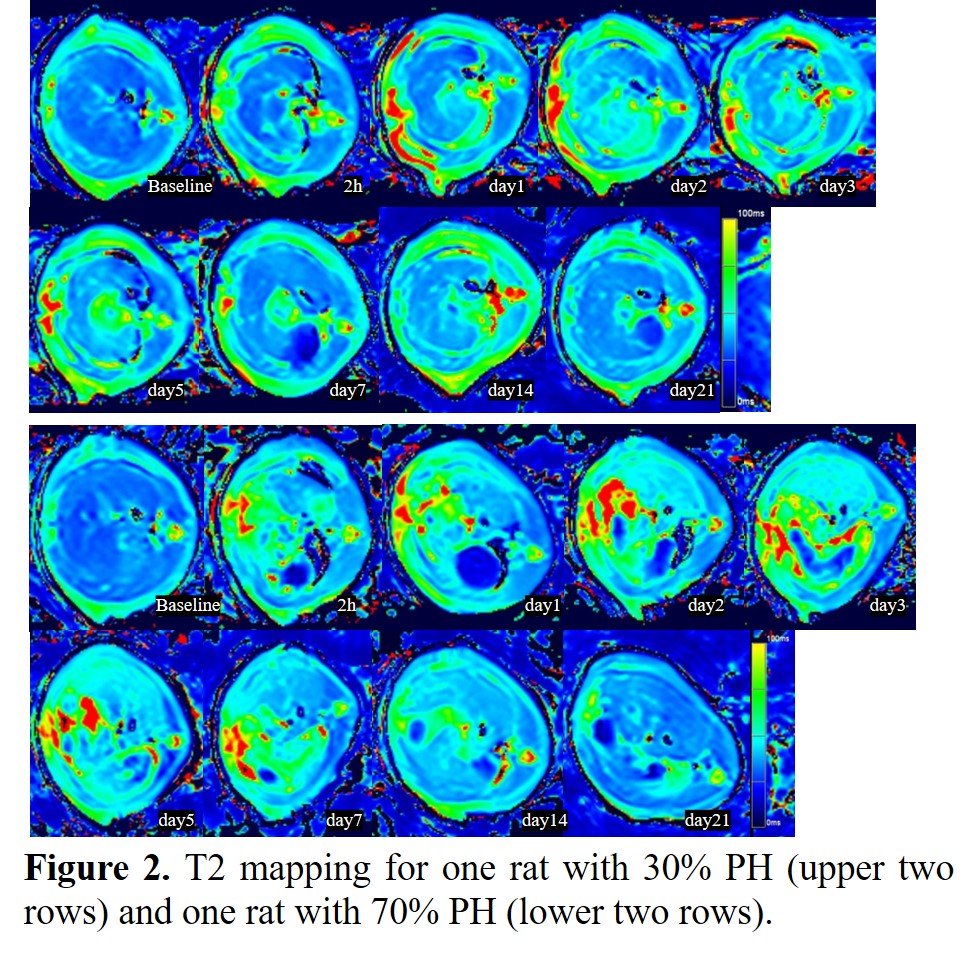
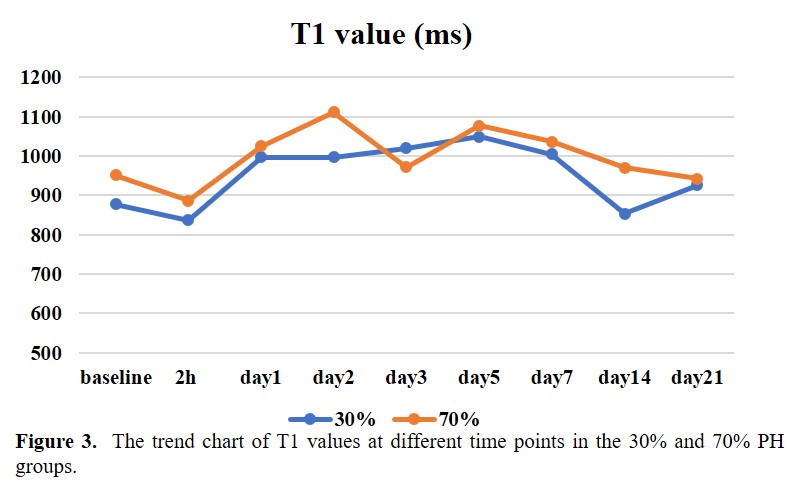
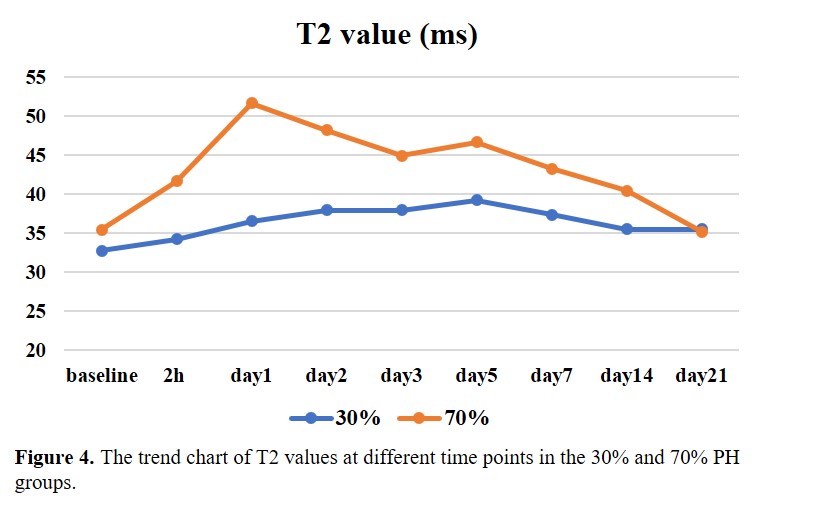
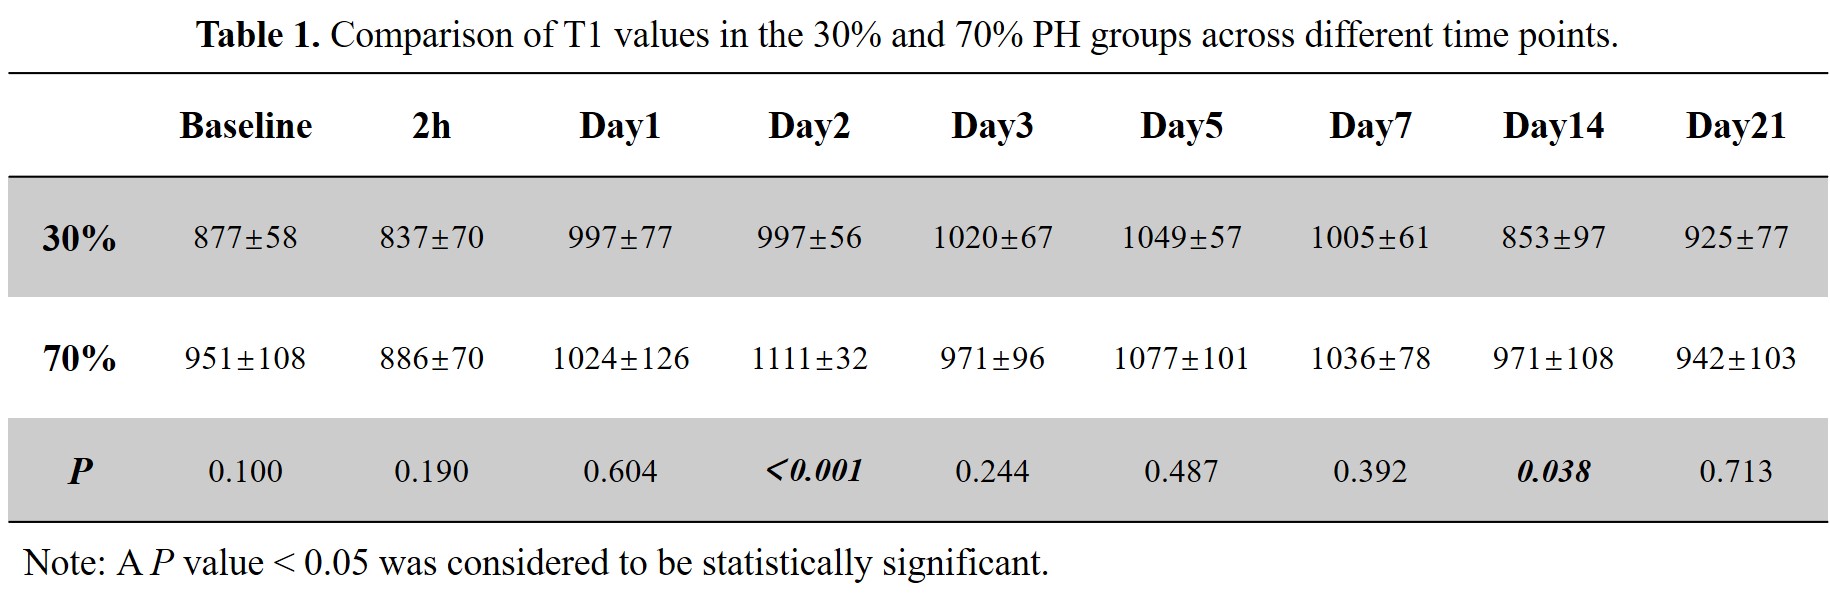
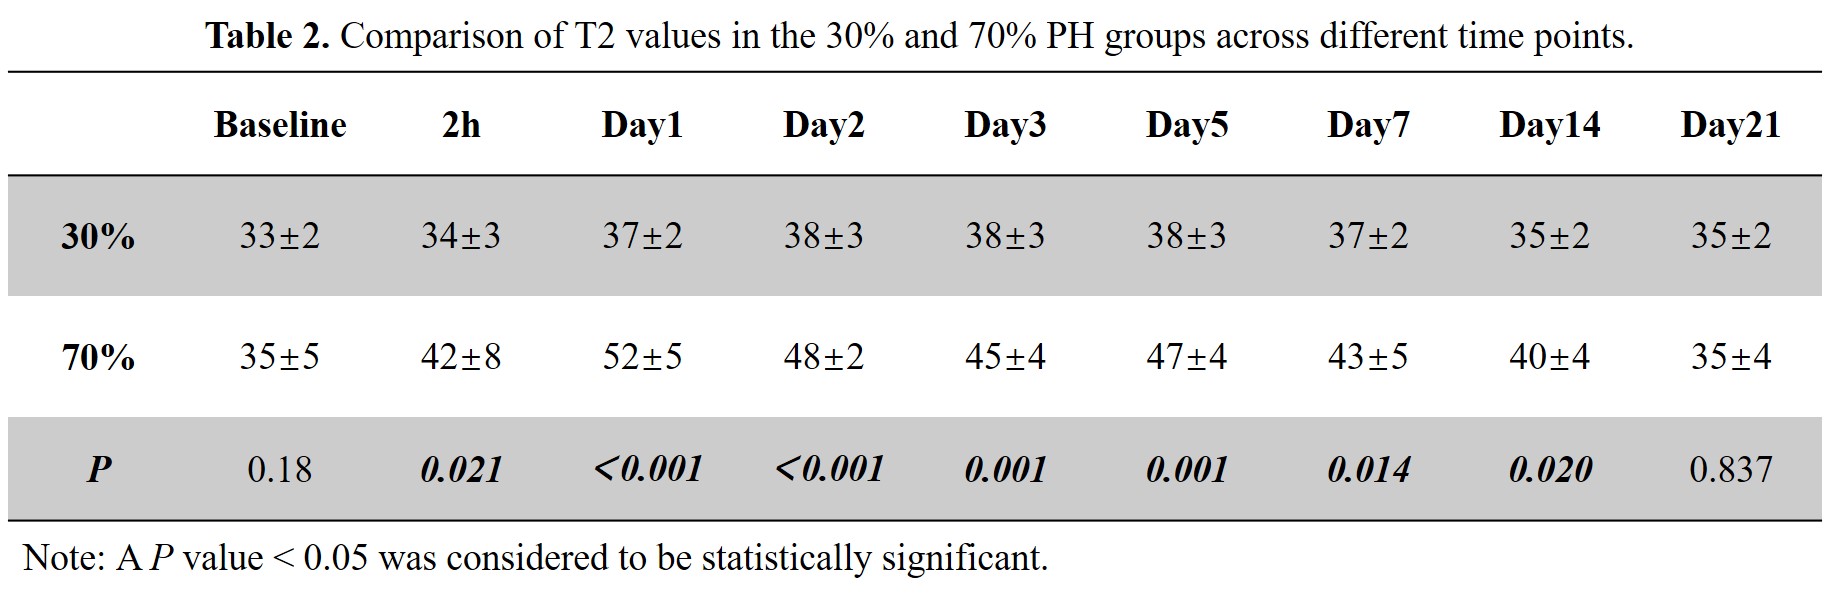
Example parametric mapping of T1 and T2 for one rat with 30% PH and one rat with 70% PH are shown in Figure 1 and 2. Trend charts of the T1 values and T2 values at different time points in 30% and 70% PH groups were shown in Figure 3 and 4. The changes in the T1 value were similar in the 30% and 70% PH groups, decreased at 2h, and increased at the following four time points before reaching a relative plateau and decreasing again at day 7. The 70% PH group, however, underwent a shape ebb at day 3, and the 30% PH group showed an increase from day 14 to day 21. The changes in the T2 values in the two groups increased at the first five time points before decreasing. The T1 values were statistically significantly higher in the 70% PH group at day 2 and day 14 (both P < 0.05) (Table 1). The T2 values were statistically significantly higher at 2h, on day 1, day 2, day 3, day 5, day 7, and day 14 (all P < 0.05) in the 70% PH group (Table 2).Discussion
Changes in the T1 values and T2 values across different time points represented activity trends in residual liver parenchyma that could help determine liver regeneration activity more intuitively. The T1 values were more stable between day 1 and day 7 in the 30% PH group than those in the 70% PH group, indicating more active liver regeneration in the 70% PH group. T2 values were higher in the 70% PH group than those in the 30% group, providing further evidence of the active changes in the process of liver regeneration.Conclusion
T1 and T2 mapping demonstrated the potential for assessing changes of residual liver parenchyma after PH, which indicate the activity of liver regeneration.Acknowledgements
No acknowledgement found.References
1. Clavien PA, Oberkofler CE, Raptis DA, et al. What is critical for liver surgery and partial liver transplantation: size or quality. Hepatology. 2010;52(2):715-729.
2. Eberhardt Christian, Wurnig Moritz C, Wirsching Andrea, et al. Prediction of small for size syndrome after extended hepatectomy: Tissue characterization by relaxometry, diffusion weighted magnetic resonance imaging and magnetization transfer. PLoS One. 2018;13(2):e0192847.
3. Sostman HD, Gore JC, Flye MW, et al. Time course and mechanism of alterations in proton relaxation during liver regeneration in the rat[J]. Hepatology. 1985;5(4):538-543.
4. Patrizio G, Pietroletti R, Pavone P, et al. An animal model for the study of liver regeneration by magnetic resonance imaging[J]. La Radiologia medica.1990;79(5):453-457.
Figures