2631
The value of texture analysis based on multiple high b-values DWI for evaluation of tumor heterogeneity in HCC patients1The First Affiliated Hospital of Dalian Medical University, Dalian, China, 2Philips Healthcare, Beijing, China
Synopsis
Previous studies have reported preliminary but promising results that high b‐value DWI has a remarkably high sensitivity in neuro or genitourinary malignancies. However, the value of high b-value DWI in liver remains controversial. In the current study, multiple high b-values DWI - based texture analysis was applied to evaluate tumor heterogeneity in hepatocellular carcinoma (HCC) patients. The results demonstrated that ultra-high b-value (b = 2000 and 3000 s/mm2) DWI images could offer more information in tumor heterogeneity evaluation compared to the conventional b-value (b = 800 s/mm2) DWI images based on texture analysis in HCC patients.
Introduction
Hepatocellular carcinoma (HCC) is the sixth most common cancer and ranks as the fourth cause of cancer-related death worldwide[1]. Hepatocarcinogenesis is a multistep process during which nodules undergo parallel, simultaneous, and progressive changes, including increased cell density, decreased cell differentiation, enlargement of nodules, and changes in nodule hemodynamics[2]. DWI is a functional MRI sequence that allows the characterization of biological tissues based on the diffusion properties of water molecules. This sequence provides indirect information about cell density and about the integrity of cell membranes in the area of interest[3]. Previous studies have reported preliminary but promising results that high b‐value DWI has a remarkably high sensitivity in neuro or genitourinary malignancies[4-6]. However, the value of high b-value DWI in liver remains controversial[7]. Texture analysis is a new image analysis method, which can quantify the distribution of signal intensity of voxels within the tumor to reflect tumor heterogeneity[8]. We hypothesize that it is feasible to evaluate tumor heterogeneity in HCC patients using texture analysis based on multiple high b-value DWI images.Materials and Methods
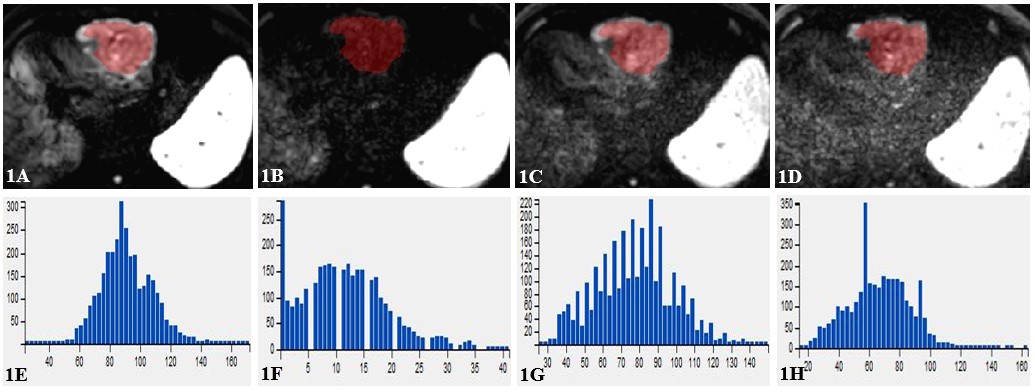
From May 2019 to September 2019, a total of 20 consecutive patients who were pathologically confirmed as HCC (17 male and 3 female, 56.20 ± 9.73 years old) underwent a preoperative MR imaging examination with multiple high b-value DWI sequence at our institution. All patients were examined with a 3.0 T MRI system (Ingenia CX, Philips Healthcare, Best, the Netherlands), including routine liver scanning (T1WI, T2WI, and dynamic contrast-enhanced MR imaging) and additional multiple b-values DWI sequence with b-values 800, 1200, 2000 and 3000 s/mm2 (denoted as b800, b1200, b2000 and b3000). Detailed MR scanning parameters were shown in Table 1. Texture analysis was performed on the multiple high b-value DWI images (b values = 800, 1200, 2000, 3000 s/mm2, respectively) by Omni-Kinetics software (GE Healthcare). The radiologist (with 5 years of experience in abdominal radiology), who was blinded to the clinical and histopathological information, reviewed the MR images and manually outlined the region of interests (ROIs) at the slice which included maximum lesion area on axial DWI images with b800, b1200, b2000 and b3000, respectively (shown in Figure 1). The texture parameters such as stdDeviation, Variance, MeanDeviation, RelativeDeviation, skewness, kurtosis, GreyLevelNonuniformity and RunLengthNonuniformity were derived from multiple high b-value DWI images. SPSS (version 20.0 for Windows, IBM Corporation, USA) was used for statistical analysis. The Wilcoxon test was used to compare above texture parameters between the conventional b-value (b800) group and high b-value (b1200, b2000 and b3000) group, respectively. P < 0.05 was considered to indicate statistical significance.Results
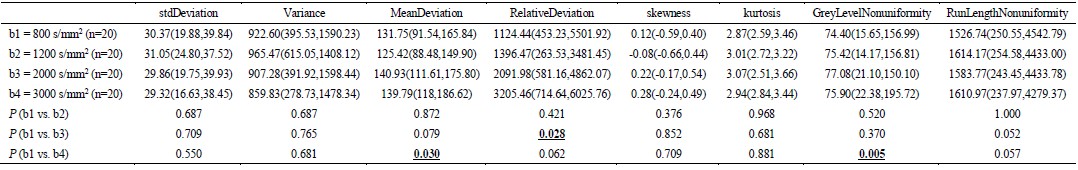
DWI image with b800 had lower RelativeDeviation [1124.44 (453.23, 5501.92)] than that of b2000 group [2091.98 (581.16, 4862.07)], P value was 0.028. Moreover, DWI image with b800 had lower MeanDeviation [131.75(91.54, 165.84)] and GreyLevelNonuniformity [74.40 (15.65, 156.99)] than those of b3000 group [139.79 (118.00, 186.62) and 75.90 (22.38, 195.72)], P value were 0.030 and 0.005, respectively. There were no significant differences for the remaining parameters between the other two groups (all P > 0.05, shown in Table 2).Discussion and Conclusion
Mean deviation is defined as average of the distances of each image value away from the mean of all values in ROI. Relative deviation refers to the mean deviation divided by the mean, which evaluates the degree of dispersion in a more sensitive way. The higher the mean deviation and relative deviation are, the lower the material homogeneity is. Grey Level Nonuniformity (GLN) measures the similarity of gray-level intensity values in the image, where a lower GLN value correlates with a greater similarity in intensity values. The RelativeDeviation in b2000 group was higher compared to b800 group. Meanwhile, the MeanDeviation and GLN in b3000 group were higher compared to b800 group. One convincing explanation is that ultra-high b-value DWI images may reflect tumor heterogeneity in HCC patients more accurately.In the current study, we found that ultra-high b values (b = 2000 and 3000 s/mm2) DWI images could offer more information in tumor heterogeneity evaluation compared to the conventional b-value (b = 800 s/mm2) DWI images based on texture analysis in HCC patients.
Acknowledgements
No acknowledgements found.References
[1] Siegel RL, Miller KD, Jemal A. Cancer statistics 2016. CA Cancer J Clin. 2016; 66:7–30.
[2] Kojiro M,Wanless IR, Alves V, et al; International Consensus Group for Hepatocellular Neoplasia The International Consensus Group for Hepatocellular Neoplasia. Pathologic diagnosis of early hepatocellular carcinoma: a report of the international consensus group for hepatocellular neoplasia. Hepatology. 2009, 49(2): 658–664.
[3] Rimola J. Heterogeneity of Hepatocellular Carcinoma on Imaging. Semin Liver Dis. 2019 Jul 2. doi: 10.1055/s-0039-1693512. [Epub ahead of print]
[4] Onishi S, Hirose T, Takayasu T, et al. Advantage of High b Value Diffusion-Weighted Imaging for Differentiation of Hemangioblastoma from Brain Metastases in Posterior Fossa. World Neurosurg. 2017,101:643-650.
[5] Agarwal HK, Mertan FV, Sankineni S, et al. Optimal high b-value for diffusion weighted MRI in diagnosing high risk prostate cancers in the peripheral zone. J Magn Reson Imaging. 2017, 45(1): 125-131.
[6] Hausmann D, Liu J, Budjan J, Reichert M, Ong M, Meyer M, Smakic A, Grimm R, Strecker R, Schoenberg SO, Wang X, Attenberger UI. Image Quality Assessment of 2D versus 3D T2WI and Evaluation of Ultra-high b-Value (b=2,000 mm/s2) DWI for Response Assessment in Rectal Cancer. Anticancer Res. 2018, 38(2): 969-978.
[7] Göya C, Hamidi C, Önder H, et al.Primary and Metastatic Liver Malignancy: Utility Low and High B Value (1600-2000) in 3 Tesla MRI. Hepatogastroenterology. 2015, 62(140): 962-5.
[8] Li H, Zhang J, Zheng Z, et al. Preoperative histogram analysis of intravoxel incoherent motion (IVIM) for predicting microvascular invasion in patients with single hepatocellular carcinoma. Eur J Radiol. 2018, 105: 65-71.
Figures