2629
Quantitative Assessment of Liver Function by using Gd-EOB-DTPA-Enhanced MRI: Hepatocyte Fraction1the Third People’s Hospital of Nantong, Nantong, China, 2Philips Healthcare, Shanghai, China
Synopsis
The purpose of this study was to assess the ability of hepatocyte fraction on Gd-EOB-DTPA-enhanced MRI for the quantitative evaluation of liver function. 69 patients with cirrhosis and 22 healthy volunteers with normal liver function who underwent Gd-EOB-DTPA enhanced MRI were collected in this study. T1 mapping images were obtained by using the Look-Locker sequences before and 20 minutes after Gd-EOB-DTPA administration, hepatocyte fraction (HeF) and KHep were measured. Our study showed that hepatocyte fraction (HeF and KHep vlaues) based on Gd-EOB-DTPA- enhanced T1 mapping MRI is an efficient diagnostic tool for the quantitative evaluation of liver function.
INTRODUCTION
Assessment of the liver function is an essential procedure for preventing hepatic failure and for the medical management of patients with hepatic dysfunction. Gadoxetic acid (Gd-EOB-DTPA) is a hepatocyte-specific contrast agent for MRI of the liver, uptake and metabolism of Gd-EOB-DTPA is related to hepatocyte function1. The purpose of this study is to evaluate the ability of hepatocyte fraction on Gd-EOB-DTPA-enhanced MRI for the quantitative evaluation of liver function.Our study based on a simple pharmacokinetic model2( Fig.1) and the ΔR1 values to calculate.R1(t) = 1 / T1(t) t: time after contrast injection (min)
ΔR1 = [ R1(t) - R1(0) ]
Hepatocyte fraction = ΔR1Hepatobilitary / (ΔR1Hepatobilitary+ΔR1BloodEES)
KHep = (ΔR1Hepatobilitary / ΔR1BloodEES) / t
PURPOSE
To assess the ability of hepatocyte fraction on Gd-EOB-DTPA-enhanced MRI for the quantitative evaluation of liver function.METHODS
69 patients who underwent Gd-EOB-DTPA enhanced MRI were collected in this prospective study, and classified in to 3 groups as follows: HBV-induced liver cirrhosis with Child-Pugh A (LCA), n=46; Child-Pugh B (LCB), n=21; Child-Pugh C (LCC), n=2. 22 healthy volunteers with normal liver function (NLF) were enrolled as control group. Look-Locker sequences with exactly the same scan parameters and geometry position (the level of porta hepatis) were performed pre and post-contrast at 20 minutes after Gd-EOB-DTPA administration. Two readers independently identified and measured hepatocyte fraction (HeF) and KHep, two regions of interest (ROIs) were sparsely placed in both lobes of the liver. Interreader agreement was evaluated by using intraclass correlation coefficient (ICC). One-way ANOVA was used to compare HeF and KHep among different groups. ROC curve analysis was performed to compare the diagnostic performance of HeF and KHep in discriminating NLF from LCA group and LCA from LCB+LCC group. Spearman correlation coefficient was used to analysis the correction between HeF, KHep and Child-Pugh scores.RESULTS
ICC of the two observers with HeF values was 0.988 (0.982-0.992), ICC of KHep values was 0.988 (0.979-0.991), interreader agreement was substantial to almost perfect.HeF and KHep values of different groups were shown in table 1 (Fig.2-4). HeF and KHep values of two readers progressively decreased from NLF, LCA to LCB+LCC group (P<0.05). HeF of LCB+LCC group was significantly different (P<0.05) in comparison with that of NLF group and LCA group. KHep showed significant difference (P<0.05) among the three groups.
Diagnostic performance for discriminating NLF group from LCA group were shown in table 2.
Diagnostic performance for discriminating LCA group from LCB+LCC group were shown in table 3.
Correlation between HeF, KHep values and Child-Pugh scores were shown in table 4.
DISCUSSION
Gd-EOB-DTPA can be specifically taken up by hepatocytes and excreted through the biliary tract, the intracellular transport mechanisms of Gd-EOB-DTPA are mediated by organic anion-transporting polypeptide 1 (OATP1), the reduced Gd-EOB-DTPA uptake may be either due to a decreased number of normal hepatocytes in cirrhotic liver or due to decreased expression of OATP1 or diminished OATP1 activity on the surface of hepatocytes3-4. Hepatocyte fraction was not affected by blood and extracellular extravascular space (EES)2, reflected the ability of hepatocytes uptake and were relevant to OATP1. Previous study showed that hepatocyte fraction was useful for the staging of liver fibrosis and liver function5-6. In our study, HeF and KHep values showed a constant decrease from NLF, LCA to LCB+LCC group, HeF and KHep of LCB+LCC group were significantly lower than those of NLF or LCA group, the areas under ROC curve of HeF and KHep values of two readers for differentiating NLF and LCA groups were 0.598 and 0.624, 0.789 and 0.802, respectively, those for discriminating LCA and LCB+LCC groups were 0.979 and 0.975, 0.926 and 0.915, HeF and KHep values of patients with cirrhosis were negatively correlated with Child-Pugh scores.CONCLUSIONS
Hepatocyte fraction based on Gd-EOB-DTPA- enhanced T1 mapping MRI is an efficient diagnostic tool for the quantitative evaluation of liver function.Acknowledgements
References
[1] Katsube T, Okada M, Kumano S, et al. Estimation of liver function using T1 mapping on Gd-EOB-DTPA-enhanced magnetic resonance imaging[J]. Invest Radiol, 2011, 46(4): 277-283.
[2] Dahlqvist Leinhard O, Dahlström N, Kihlberg J, et al. Quantifying differences in hepatic uptake of the liver specific contrast agents Gd-EOB-DTPA and Gd-BOPTA: a pilot study[J]. Eur Radiol, 2012, 22(3): 642-653.
[3] Tsuda N, Harada K, Matsui O. Effect of change in transporter expression on gadolinium-ethoxybenzyl-diethylene triamine pentaacetic acid-enhanced magnetic resonance imaging during hepatocarcinogenesis in rats [J]. J Gastroenterol Hepatol, 2011, 26(3): 568-576.
[4] Ba-Ssalamah A, Bastati N, Wibmer A, et al. Hepatic gadoxetic acid uptake as a measure of diffuse liver disease: Where are we? [J]. J Magn. Reson. Imaging, 2017, 45(3): 646-659.
[5] Pan S, Wang XQ, Guo QY. Quantitative assessment of hepatic fibrosis in chronic hepatitis B and C: T1 mapping on Gd-EOB-DTPA-enhanced liver magnetic resonance imaging[J]. World J Gastroenterol. 2018, 24(18): 2024-2035.
[6] Yoon JH, Lee JM, Kang HJ, et al. Quantitative assessment of liver function by using gadoxetic acid–enhanced MRI: hepatocyte uptake ratio[J]. Radiology, 2019, 290(1): 125-133.
Figures
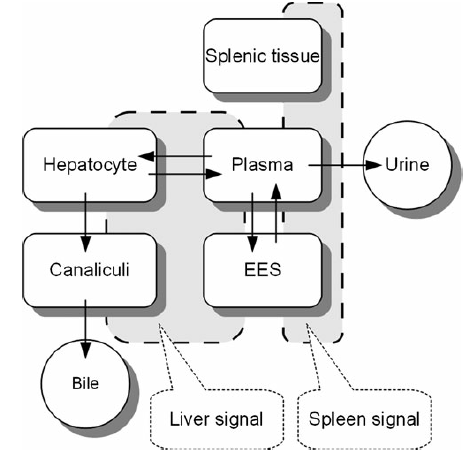
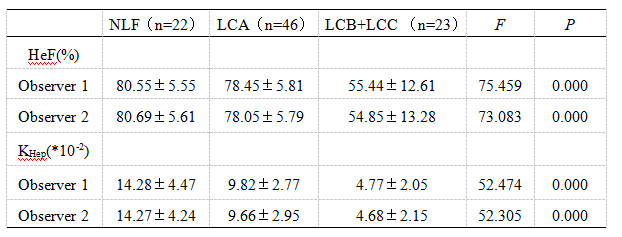
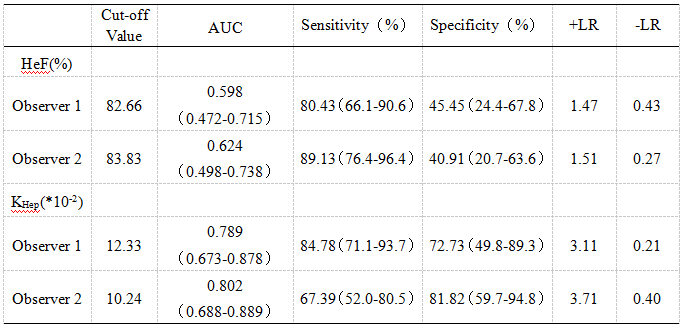
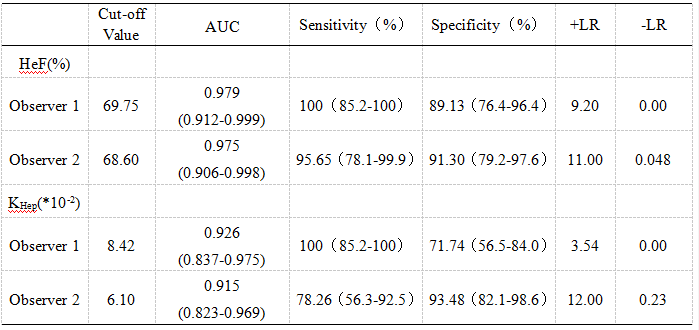
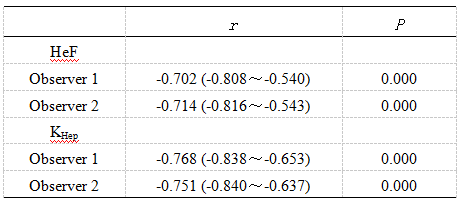
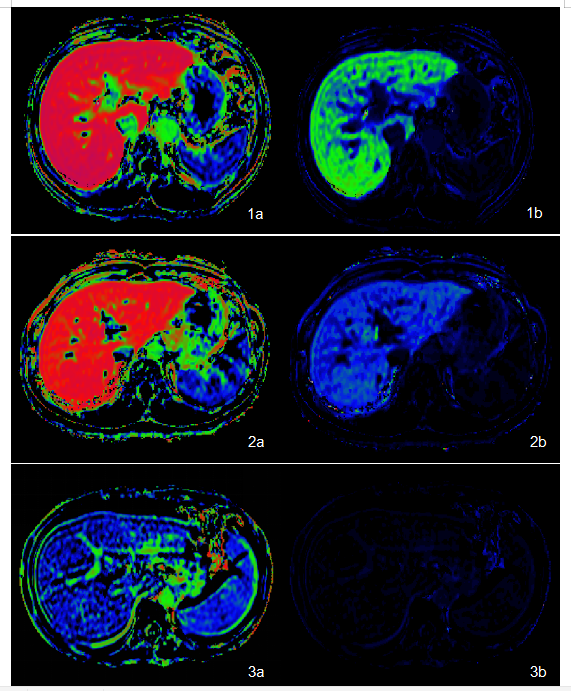
FIGURE 2. Hepatocyte Fraction map (1a) and K map (1b) in a 64-year-old man with NLF, HeF values of the two observers were 85.72% and 85.89%, respectively, KHep values were 16.75*10-2 and 17.00*10-2, respectively.
Hepatocyte Fraction map (2a) and K map (2b) in a 46-year-old man with LCA, HeF values were 80.28% and 78.35%, respectively, KHep values were 10.76*10-2 and 10.08*10-2, respectively.
Hepatocyte Fraction map (3a) and K map (3b) in a 37-year-old man with LCC, HeF values were 30.54% and 27.12%, respectively, KHep values were 3.17*10-2 and 2.51*10-2, respectively.