2628
T2 mapping quantitative imaging to evaluate pancreatic changes caused by benign and malignant low biliary tract obstruction
Xuedong Wang1, Ailian Liu1, Jiazheng Wang2, Ke Jiang2, and Anliang Chen1
1The first affiliated hospital of dalian medical university, DaLian, China, 2Philips Healthcare, China, Beijing, China
1The first affiliated hospital of dalian medical university, DaLian, China, 2Philips Healthcare, China, Beijing, China
Synopsis
T2 mapping is an effective sequence of MRI that enables quantitative assessment of diseases. However, currently there are few trials to confirm its feasibility in distinguishing pancreatic changes due to benign and malignant low biliary obstruction. In this experiment, we used T2 mapping to quantify these changes, and found that T2 mapping is feasible for evaluating the changes of pancreatic parenchyma due to benign and malignant low biliary obstruction. And the value of T2 mapping in malignant group is higher than that in benign group.
Introduction
T2 mapping plays an important role in diagnosis of diseases[1] due to its quantitative ability. So far, the application of T2 mapping has been applied to heart, nerve, bone joints and so on, however, seldom work has been reported about its application in pancreatic diseases. Therefore, this study aims to explore the application of T2mapping quantitative imaging in pancreatic changes after benign and malignant bile duct obstruction.Material and methods
Malignant group with 6 cases and benign group with 7 cases were enrolled in this retrospective study. The study was performed on a 3.0T MR scanner (Ingenia 3.0T CX; Philips Healthcare, Best, the Netherlands) with a 32-channel abdominal array coil.Scanning sequences: axial T2-weighted imaging (T2WI),T2 mapping And Diffusion-weighted imaging (DWI). Scanning parameters: T2WI: TR/TE= 4900/85ms, FOV=240x 240x 119mm3, voxel size 0.7x0.7x4mm3, scan time=2min48s;T2 mapping: TR/TE=1157/20ms, FOV=400 x319 x70mm3, voxel size 2.1 x2.62 x7mm3, scan time=1min58s;DWI: TR/TE= 3900/60ms, FOV=240x240x119 mm3, voxel size 3.0x3.0x4mm3, scan time=1 min 46s. All data were transferred to the IntelliSpace Portal, (Philips Healthcare). Two physicians with 3 years and 6 years of MRI diagnosis experience were employed to drawregion of interest(ROI) in the uniform areas of parenchymal signals in the head, body, and tail of the pancreas with dilated pancreatic ducts avoided.(Figure 1). The value of ROI drawn by the senior physician was taken as statistical analysis,and averagevalue of ROI for three times was taken as the follow-up statistical analysis. Intra-group correlation coefficient (ICC) was used to test the consistency of the measurement results of the two observers.The difference of parameters between the two groupswere performed by Mann-Whitney U test.Results
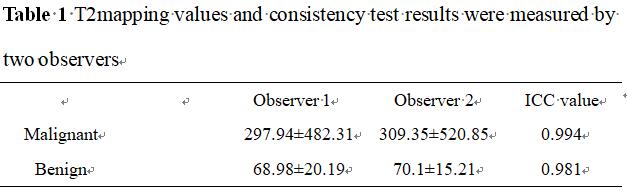
The consistency of data measured by two observers was good (ICC>0.75)( Table 1).T2 mapping value of pancreatic changes caused by malignant low biliary tract obstruction was higher than that of benign group with statistical difference (P<0.05)( Table 2). T2 mapping value were 90.065 as the differential diagnosis thresholds, the corresponding diagnostic sensitivity and specificity were 83.3% and 100%, and the AUC value were 0.857(Figure2).Discussion and Conclusion
In this study we illustrate the feasibility of T2 mapping in evaluating the parenchymal changes of the pancreascaused by benign and malignant low biliary tract obstruction.. Results shows that T2 value in malignat groupis significantly higher than that inthe benign group, which indicates that T2 mapping may be an effective tool fordiagnosis ofsuch pancreatic diseases.Acknowledgements
no acknowledgements foundsReferences
[1]Hamlin SA, Henry TS, Little BP, et al. Mapping the future of cardiac MR imaging: case-based review of T1 and T2 mapping techniques. Radiograohics. 2014;34(6):1594-1611.Figures
Table
1 T2mapping
values and consistency test results were measured by two observers
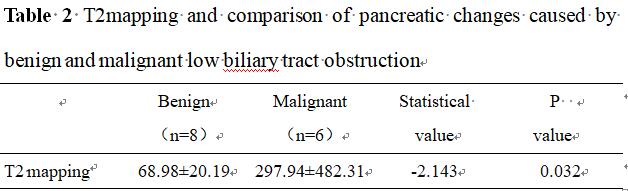
Table 2 T2 mapping and
comparison of pancreatic changes caused by benign and malignant low biliary
tract obstruction
Figure
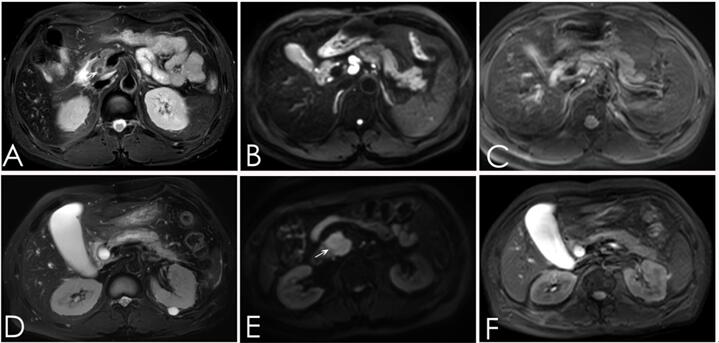
1:A-C: A:T2WI, B:DWI, C:T2 mapping; Male, 47 years old,calculi of common bile
duct; D-F:D:T2WI, E:DWI, F:T2 mapping, Male, 52 years old,carcinoma of head of
pancreas. The T2mapping values is 70.1 and 215.82, respectively.