2627
Quantitative assessment of the pancreas in subjects using DWI, IVIM, and 3D mDxion-quant: correlation with BMI, SAT, VAT and TAT1The first affiliated hospital of Dalian Medical University, Dalian, China, 2Philips Healthcare, Beijing, China
Synopsis
This study measured the quantitative imaging metrics of the pancreas and correlated ADC, sADC, D*,D, f, FF and R2* of pancreas with BMI, TAT, SAT and VAT. This study viewed that there was significant relationship between R2* and VAT, TAT (r=0.495, 0.533, respectively). And, ADC was related to SAT (r=0.460). These may illustrate the impact of different fat distribution on the function of pancreas.
Introduction
At present, pancreatic fibrosis and steatosis are important pathological processes of pancreatic injury repair caused by acute and chronic pancreatitis, pancreatic tumor and other diseases[1]. Novel quantitative MR imaging techniques such as DWI, IVIM, 3D mdixon-quant[2-3] can provide in vivo characterization of tissues and have the potential to be non-invasive biomarkers to diagnose certain solid organ pathologies. Quantitative imaging metrics can also be used to monitor the course of therapy in clinical trials. However, there are lack of data on normal quantitative metrics of the pancreas and correlation with obesity parameters (e.g. BMI(body mass index, BMI), TAT(total adipose tissue,SAT( subcutaneous adipose tissue) and VAT(visceral adipose tissue)).Materials and methods
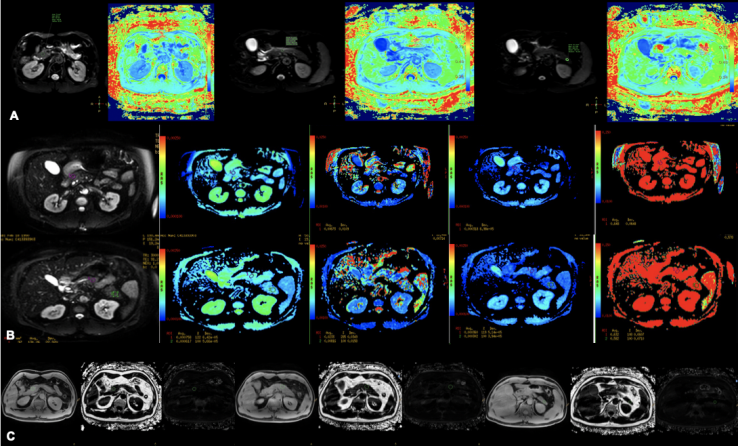
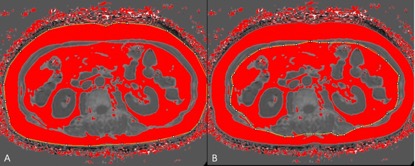
21 inpatients were included in this study, and underwent upper abdomen MRI scans (including 3D mDIXON-quant, DWI, IVIM) at 3.0T. Inpatients had the following characteristics: age range, 22-73 years (average, 53.90 ± 12,837years); BMI range, 18.73-35.75 kg/m2 (average, 24.18 ± 3.93 kg/m2); TAT range, 115.26-355.18 cm2 (average, 226.16 ± 68.90 cm2); SAT range, 48.80-191.44 cm2 (average, 104.72 ± 40.58 cm2); VAT range, 43.39 - 216.37 cm2 (average, 121.44 ± 51.75 cm2). 3D mDIXON-quant sequence scanning parameters:FOV=375mm, TR/TE=6.0/1.05ms, voxel size 2.3mm×1.8mm, slice thick 5.0/-2.5. DWI sequence scanning parameters:FOV=450mm, TR/TE=7700/74ms, voxel size 3.7mm×6.3mm, slice thick 6.0/0. IVIM sequence scanning parameters: FOV=400mm, TR/TE=3000/91ms, voxel size 3.0mm×2.5mm, slice thick 7.0/1.0. On ISP workstation, 2D region of interest (ROI) were placed on the head, body and tail regions of pancreas in DWI, IVIM and 3D mDIXON-quant, respectively(Fig.1). The mean value of three ROIs was calculated as the value of the whole pancreas. ROIs area were approximately 25-100 mm2. All ROIs were placed within the interested tissue by avoiding blood vessels, pancreatic duct and abdominal adipose tissue as much as possible. The TFA and VFA were measured using 3D mDIXON-quant at the level of L1-L2 using Image J (National Institutes of Health, USA). The regions with a fat fraction of >50% were marked red in the image. After manually placing the outlines in the abdominal wall and skeletal muscle, the TFA and VFA could be automatically calculated (Fig.2). The SFA equals to TFA minus VFA. The Spearman test was used to analyze the correlation between imaging parameters and BMI, SAT, VAT and TAT. This study has been approved by the local IRB.Results
There was significant correlation between R2* and VAT, TAT (r=0.495,0.533, respectively). And, ADC was related to SAT (r=0.460). Other imaging parameters were not related with BMI, SAT, VAT and TAT(P>0.05).Discussions
This study viewed that R2* was related to VAT and TAT, which demonstrated that central obesity may easily result in iron deposition of pancreas[4]. While there was a positive relationship between ADC and SAT. It may reveal that SAT may have a protective effect on the pancreas.conclusion
This study measured the ADC, sADC, D*,D, f, FF and R2* of the pancreas in subjects with no pancreas disease. R2* was related to VAT and TAT, as the SAT increases, the ADC value decreases.Acknowledgements
No acknowledgement foundReferences
1Tirkes, Dhiraj Yadav,et al.Magnetic resonance imaging as a non‑invasive method for the assessment of pancreatic fbrosis (MINIMAP): a comprehensive study design from the consortium for the study of chronic pancreatitis[J]. Abdominal Radiology, 2019,44:2809–2821.
2Christophe Cassinotto, Matthieu Feldis, et al.MR relaxometry in chronic liver diseases: Comparison of T1 mapping, T2 mapping, and diffusion-weighted imaging for assessing cirrhosis diagnosis and severity[J]. European Journal of Radiology, 2015, 84:1459–1465.
3Yoon Jeong Hee, Lee Jeong Min, Lee Kyung Bun et al. Pancreatic Steatosis and Fibrosis: Quantitative Assessment with Preoperative Multiparametric MR Imaging[J]. Radiology, 2016, 279: 140-50.
4Li Ruo-Kun, Zeng Meng-Su,Qiang Jin-Wei et al. Improving Detection of Iron Deposition in Cirrhotic Liver Using Susceptibility-Weighted Imaging With Emphasis on Histopathological Correlation[J]. J Comput Assist Tomogr, 2017, 41: 18-24.
Figures