2624
The relativity (R2*) between ultra-short echo time MRI and mDIXON-Quant sequence in liver cirrhosis1The First Affiliated Hospital of Dalian Medical University, Dalian, China, 2Philips Healthcare, Beijing, China
Synopsis
The detection and quantification of iron depositon in cirrhotic liver are important for the diagnosis and treatment. The MR-UTE sequence has advantages in quantifying severe liver iron overload, and partially solve the problem that severe iron overload cannot be accurately quantified. mDIXON-Quant sequence could quantify liver R2* value.
Objective
To investigate the relationship of R2* value between ultra-short echo time MRI and mDIXON-Quant sequence.Methods
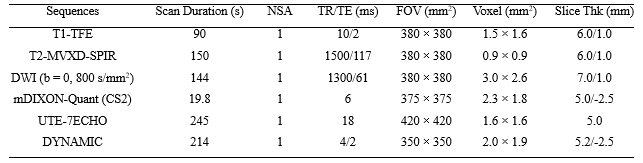
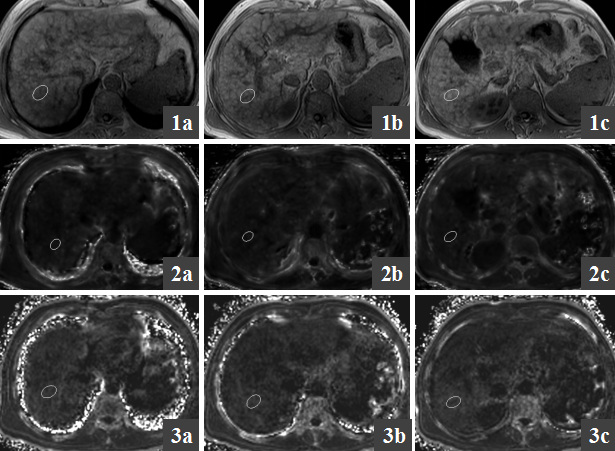
27 patients clinically diagnosed with liver cirrhosis were retrospectively selected for the is study. The data were acquired on a 3.0T Philips MR from May 2019 to October 2019. Scan sequences included T1-TFE, T2-MVXD-SPIR, DWI(b=800), mDIXON-Quant, UTE-7ECHO and DYNAMIC (Table 1). 12 patients with liver postoperative patients or intrahepatic occupying disease were excluded. Data analysis: 15 liver cirrhosis (10 males, 5 females) 9 cases of post hepatitic cirrhosis, 3 cases of alcoholic cirrhosis, and 3 other causes of liver cirrhosis. R2* value of the upper right anterior lobe of liver, right anterior lobe of liver and right posterior lobe of liver were measured by two observers (with 3 years and 2 years experience, respectively) on an ISP workstation (Fig.1). The mean value of liver data was calculated. Pearson correlation coefficient was used to test the correlation of R2* value between UTE and mDIXON-Quant sequence.Results
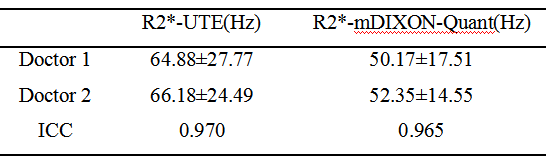
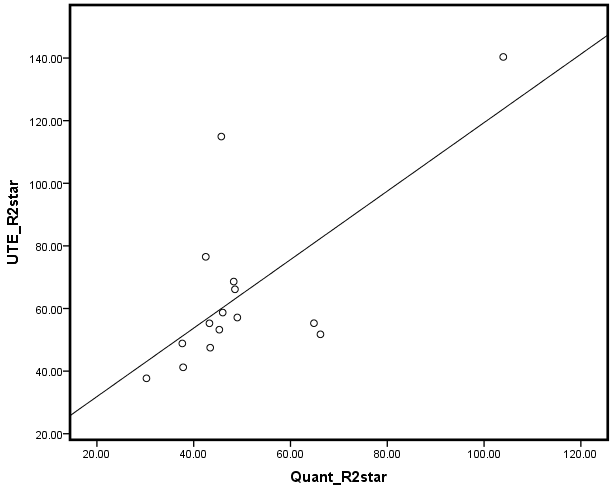
ICC values of UTE and mDIXON-Quant on liver were 0.970 and 0.965, respectively (Table 2). The R2* value of UTE was 64.88Hz±27.77Hz. The R2* value of mDIXON-Quant was 50.17Hz±17.51Hz. The R2* value of UTE was moderately correlated with mDIXON-Quant (P=0.004, Pearson correlation=0.69, Fig.2 ).Conclusion and Discussion
The MR-UTE sequence has advantages in quantifying severe liver iron overload, and partially solve the problem that severe iron overload cannot be accurately quantified[1,2]. mDIXON-Quant sequence could quantify liver R2* value[3]. The R2* values measured by UTE were moderately correlated with the R2* of mDIXON-Quant.Acknowledgements
No acknowledgements found.References
1. Li RK, Zeng MS, Qiang JW, et al. Improving Detection of Iron Deposition in Cirrhotic Liver Using Susceptibility-Weighted Imaging With Emphasis on Histopathological Correlation. J Comput Assist Tomogr, 2017, 41(1): 18-24.
2. Wu Q, Fu X, Zhuo Z, et al. The application value of ultra-short echo time MRI in the quantification of liver iron overload in a rat model. Quant Imaging Med Surg. 2019, 9(2): 180-187.
3. Zhang Y, Wang C, Duanmu Y, et al. Comparison of CT and magnetic resonance mDIXON-Quant sequence in the diagnosis of mild hepatic steatosis[J]. Br J Radiol. 2018, 91(1091): 20170587.
Figures