2620
Texture analysis based on T2-weigted images show high differentiation between IVDs with and without annular fissuring
Stefanie Eriksson1, Hanna Hebelka2,3, Leif Torén2,3, Christian Waldenberg2, Helena Brisby2, and Kerstin Lagerstrand1,4
1Medical Physics and Biomedical Engineering, Sahlgrenska University Hospital, Gothenburg, Sweden, 2Institute of Clinical Sciences, Gothenburg University, Gothenburg, Sweden, 3Department of Radiology, Sahlgrenska University Hospital, Gothenburg, Sweden, 4Institute of Clinical Scences, Gothenburg University, Gothenburg, Sweden
1Medical Physics and Biomedical Engineering, Sahlgrenska University Hospital, Gothenburg, Sweden, 2Institute of Clinical Sciences, Gothenburg University, Gothenburg, Sweden, 3Department of Radiology, Sahlgrenska University Hospital, Gothenburg, Sweden, 4Institute of Clinical Scences, Gothenburg University, Gothenburg, Sweden
Synopsis
Texture analysis provides quantitative image analysis based on mathematically calculated features. A high number of features calculated with texture analysis showed to be significantly different between the intervertebral discs with and without annular fissuring that had been classified from CT discograms. When the features based on T2-weighted images were used for classification by "Random Forest" a very high accuracy in differentiating between discs with and without annular fissuring was achieved.
Introduction
Low back pain (LBP) constitutes one of the main contributing factors to disability and absence from work in industrialized countries. Annular fissures in intervertebral discs (IVDs) has been associated with (LBP). Conventional Magnetic Resonance Imaging (MRI) has been shown to depict degenerative IVD changes. However, these imaging findings neither correlate with clinical symptoms, nor do they consistently predict the risk of LBP.1,2 From CT discograms annular fissuring can be imaged and graded as the injected contrast, leaks out of the nucleus pulposus into the fissures in the annulus. Texture analysis (TA) provides quantitative image analysis based on mathematically calculated features. TA has been able to extract image biomarkers that can be used to differentiate pathologies from healthy tissues in an automated way. The purpose of this study was to use texture analysis of T2-weighted MRI of IVDs and use the calculate features to differentiate between IVDs with and without annular fissuring.Methods
30 LBP patients examined with both MRI and CT discograms were included in this study. T2-weighted sagittal MR images (0.6mm×0.6 mm pixel size, 4 mm slice thickness, TR=4ms,TE=124ms) of the spine were acquired on a 1.5 T system (Siemens Magnetom Symphony Maestro Class, Erlangen, Germany). IVDs were manually segmented in the 5 most parasagittal slices of the T2-weighted images using an in-house program based on MatLab (R2018b, Mathworks, Natick, Massachusetts, U.S.A.). CT discograms were classified according to the Dallas Discogram Description (DDD) and Adams classification, and then digitomized into annular fissures involving the outer annulus or not, i.e. DDD≥2/DDD≤1 respectively Adams≥D/Adams≤C. A total of 81 IVDs where included in the study, of which 16 discs (group 1) had no fissuring in the outer annulus and 65 discs (group 2) had fissuring in the outer annulus. Texture analysis was performed on the segmented discs using the radiomics calculator tool, RaCaT (version 1.4).3 Nifti-files of the MR-images and of the regions of interest (ROIs) was used by RaCaT. Discretisation of the grey levels was done using a fixed number of 64 bins for the texture features and intensity histogram features. For intensity volume histograms a fixed number of 1000 bins were used for discretisation. The calculated feature values provided by RaCaT was used in a "Random Forest" classifier, which extracted the most important features for classification. The multiparametric analysis was performed using Anaconda with the Python distribution (Anaconda Software Distribution. Computer software. Vers. 2-2.4.0. Anaconda, Nov. 2016). Supervised “Decision Tree” Machine Learning was used to examine how well the included features classified between groups. A 10-fold cross validation was used for model derivation and the supervised classifiers was applied to the remaining third of data in a separate data file containing unseen data.Results
Table 1 shows the feature families and number of different features in each family provided by RaCat. For each feature there was up to 6 different aggregation methods resulting in a total of 480 calculated feature values. A two-sided Wilcoxon rank sum test was used to determine which features gave significantly different values between the two groups. By using a Bonferroni corrected p-value of p=0.0003, 169 features were determined statically significant. All 480 features were used in the multiparametric analysis. From the analysis 40 features with highest importance was selected for classification. Six of these features were manually removed since they showed to be duplicates giving the exact same results as one or more of the other selected features. The 34 remaining features are shown in table 2, also showing the mean feature value and standard deviation for the two group. The calculated p-value for the difference in features values between the groups are also shown. Figure 1 shows the evaluation of the “Decision Tree” algorithm for classification of annular fissuring (same results for DDD and Adams). Corresponding “Decision Tree” is shown in Figure 2. The algorithm classified IVDs with fissures involving the outer annulus with high accuracy and precision using only two features. Results from the cross validations showed high reproducibility for the classification of annular fissures with mean: 0.886 (std: 0.091).Discussion
The features used in the “Decision Tree” were the Neighbouring grey level dependence based feature “High dependence high grey level emphases” and the Neighbourhood grey tone difference based feature “Busyness”, shown in figure 2. “High dependence high grey level emphases” suggests that discs with no annular fissures have more areas with high grey levels and at the same time high homogeneity of signal value. The second feature “Busyness” show higher values for the group of discs with annular fissures, which suggests that these IVDs contain textures with large changes in grey levels between neighbouring voxels, i.e. discs with annular fissures are more heterogeneous in signal intensity.Conclusion
This study shows that TA based on MRI can be used to non-invasively detect annular fissures objectively and quantitatively and thus has potential to be a valuable tool within LBP research.Acknowledgements
No acknowledgement found.References
1. Doniselli et al. Eur Spine J 2018;27(11):2781-2790
2. Vagaska et al. Medicine (Baltimore) 2019;98(17):e15377.
3. Pfaehler et al PLoS ONE 14(2)
Figures
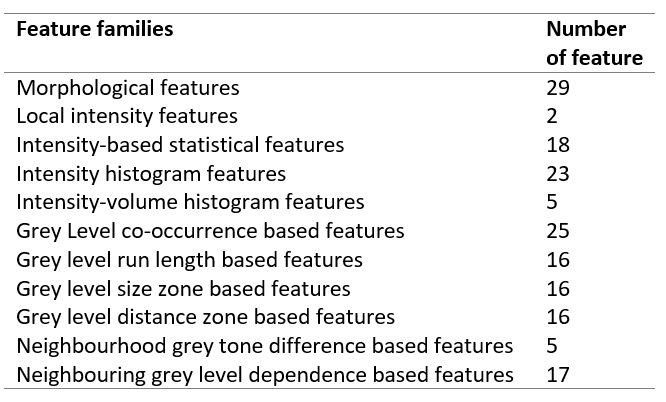
Table 1. Feature
families provided by the RaCat program and number of features included in each family.
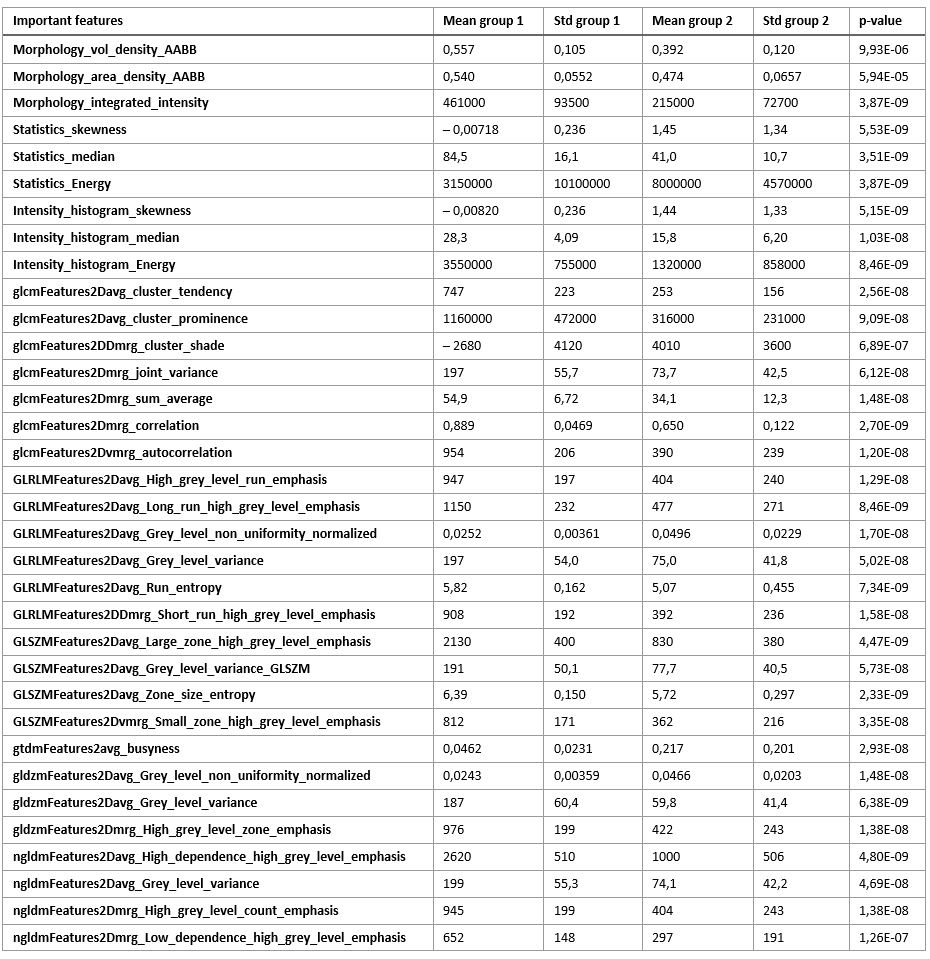
Table 2. Features showing highest importance after the
multiparametric analysis. Feature values for the IVD without annular fissuring
(group 1) and for IVDs with annular fissuring (group 2) are shown with mean and
standard deviation. The p-values shows that the feature values are significantly
different between the two groups.
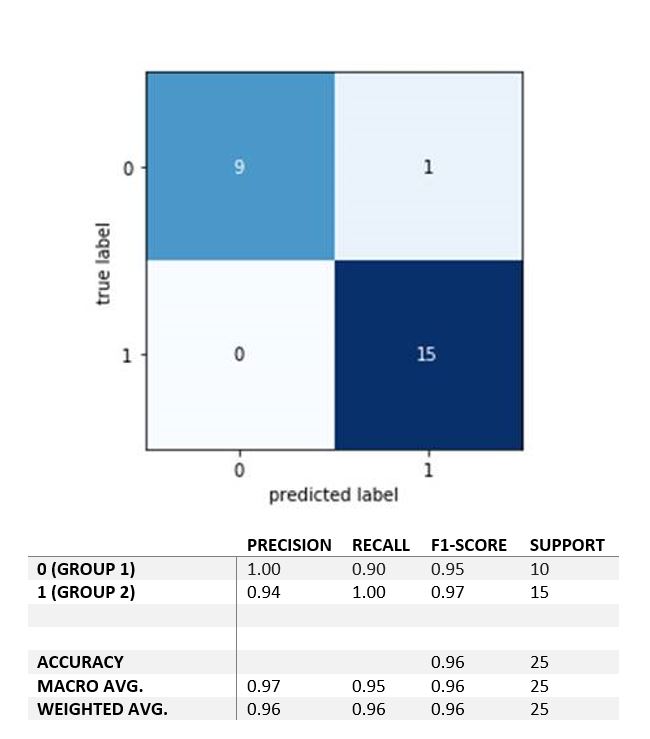
Figure 1. Confusion matrix and classification report for fissures involving outer annulus.
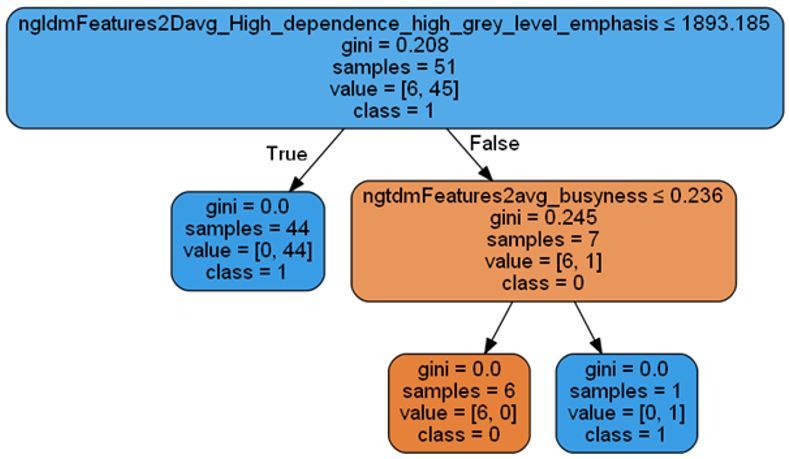
Figure 2. The “Decision
Tree” used for classification