2613
Comparison and correlation study between DKI and IVIM in assessing liver parenchyma1Department of Radiology, Fujian Medical University Union Hospital, Fuzhou, China, 2SIEMENS Healthcare, Shanghai, China
Synopsis
The aim of this study was to assess the liver parenchyma by evaluating the regional variability, the measurement stability and the correlations of parameters calculated from IVIM and DKI models using different ROIs. The results demonstrated that S8, S5/8, S5 and S3 delegating different level of liver tissue can be chosen as the representative area in assessing the IVIM-DKI imaging of the liver. ADC, MD, MK and D with lower deviation were suitable for the quantitative evaluation of liver tissue and can be used to reflect different sides of the microstructure of the hepatic parenchyma.
Introduction
In liver MRI, previous studies employed advanced diffusion models, such as DKI and IVIM, in staging liver fibrosis1 and assessing liver function2. However, the image quality of IVIM-DKI sequence could be influenced by many factors which lead to signal loss and measurement error of the parameters. Therefore, the purpose of this study is to evaluate the regional variability, measurement stability and correlation between the parameters derived from DKI and IVIM liver diffusion imaging, which might be useful for the reliable parameter selection and liver tissue assessment in patient study3-5.Methods
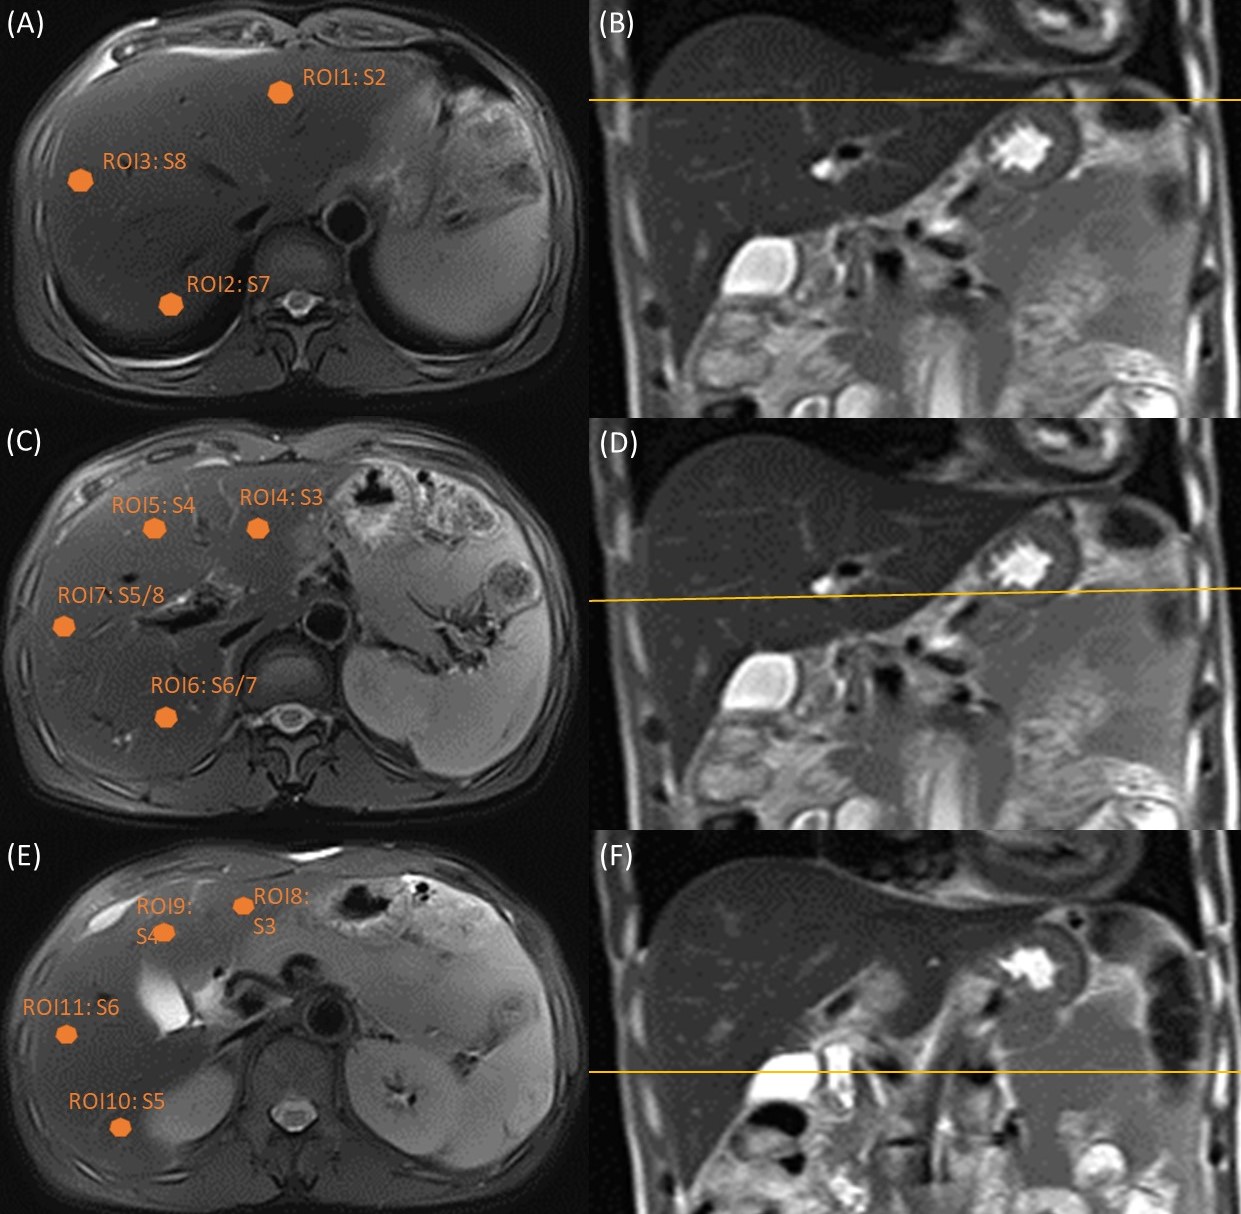
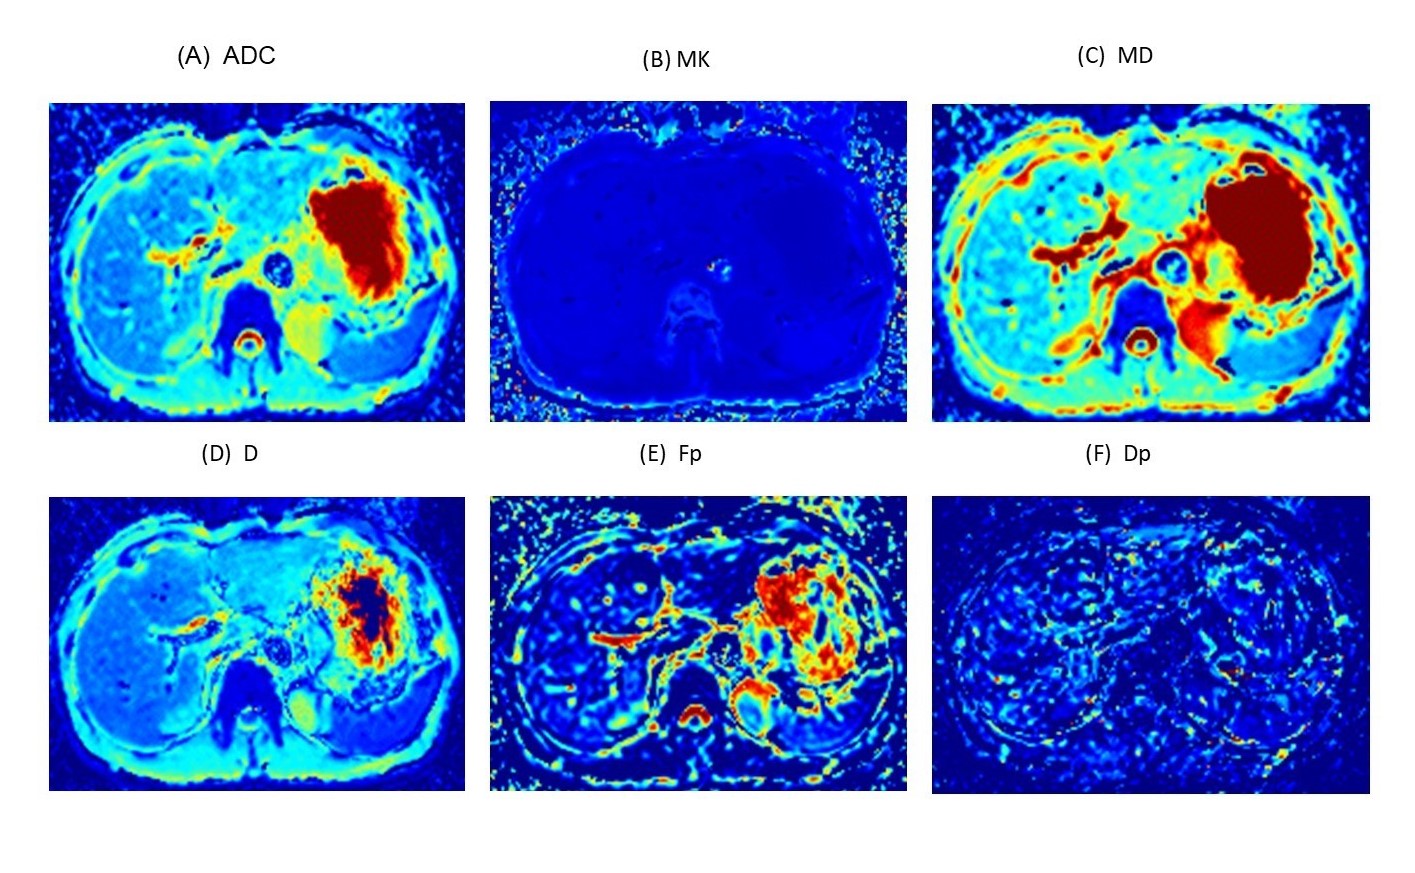
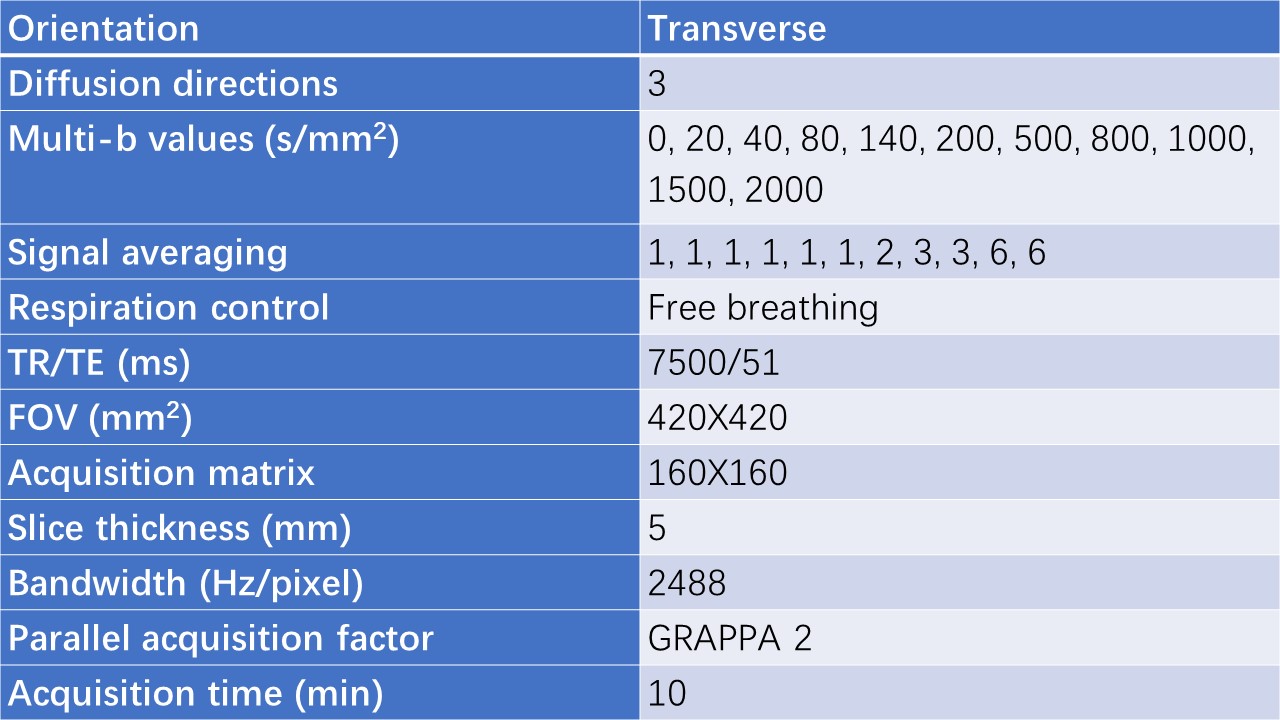
28 patients received liver MRI for cancer staging or follow-up examinations and without evidence of abnormal liver function were retrospectively enrolled. MR imaging was performed on a 3 T system (MAGNETON Prisma, Siemens, Erlangen, Germany) equipped with phased array body coil. Scanning parameters of IVIM-DKI sequence was listed in Table 1. The regions-of-interest (ROIs) with an area of 0.2 cm2 was drawn on selected 11 ROIs representing the upper, middle and lower levels of the liver (shown Figure 1). The apparent diffusion coefficient (ADC), IVIM (diffusion coefficient (D), pseudo-diffusion coefficient (Dp), perfusion fraction (Fp)) and DKI parameters (mean kurtosis (MK) and mean diffusion (MD)) were calculated by using a prototype software (MR bodydiffusion toolbox, SIEMENS Healthcare, Erlangen, Germany). The Kruskal-Wallis analysis, deviation value and the Spearman's correlation test were used to investigate the regional variability, measurement stability and cross-correlation of all parameters.Results
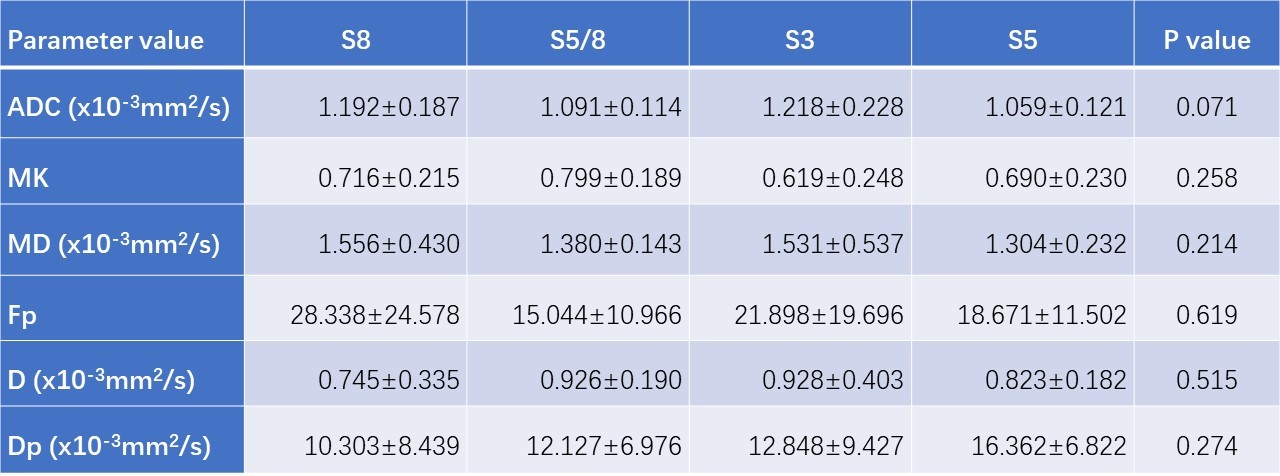
Normally distribution of all parameters including ADC, D, Dp, Fp, MK and MD were found in five regions (S2, S8, S5/8, S3 and S5, respectively). Within these five segmentations, ADC value was significantly different between S2 and other segmentations (P<0.001). By excluding the S2, all parameters were not statistically different among the remaining 4 regions (Table 2). Larger deviation values were observed for Dp (mean 65.3%) and Fp (mean 53.8%) , followed by D (mean 16.3%), MK (mean 13.9%), MD (mean 11.7%) and ADC (mean 5.8%) (Figure 2). ADC showed a strong positive correlation with MD (rho=0.865, p<0.001) and moderate positive association with D (rho=0.638, p<0.001). MD exhibited a moderate positive correlation with D (rho=0.561, p<0.001). MK was inversely correlated with ADC (rho=-0.184, p=0.039), MD (rho=-0.107, p=0.233) and D (rho=-0.269, p=0.002), however, such correlations were weak or negligible.Discussion and conclusion
Our study demonstrated that S8, S5/8 and S5 delegating the cranial, medial and caudal right lobe of the liver and S3 in the lower part of the left lobe can be selected as the representative area in evaluating the IVIM-DKI imaging of the liver. Deviation of ADC, MD, MK and D were much smaller than those of Dp and Fp, which indicated that they were more stable IVIM-DKI parameters for the quantitative evaluation of hepatic parenchyma. Moderate to strong association was found between ADC, MD and D suggesting that these variabilities may be basically similar. Weak correlation between MK and other three parameters (ADC, MD and D) demonstrates that MK may reflect the microstructure of the liver tissues from different sides. Precise role of these parameters derived from IVIM-DKI sequence needs to be further determined for specific clinical situations.Acknowledgements
This work was supported in part by Joint Funds for the Innovation of Science and Technology,Fujian Province (grant number 2017Y9041); Fujian Provincial Department of Science and Technology (grant numbers 2017J05131, 2017J01199); Startup Fund for scientific research, Fujian Medical University(Grant number 2018QH1038) and Fujian Provincial Health and Family Planning Commission (grant numbers 2018-ZQN-37, 2016-1-44).References
1. Yang L, Rao S, Wang W, et al. Staging liver fibrosis with DWI: is there an added value for diffusion kurtosis imaging?[J]. European radiology, 2018, 28(7): 3041-3049.
2. Yoshimaru D, Takatsu Y, Suzuki Y, et al. Diffusion kurtosis imaging in the assessment of liver function: Its potential as an effective predictor of liver function[J]. The British Journal of Radiology, 2019, 92(1094): 20170608.
3. Xiang Z, Ai Z, Liang J, et al. Evaluation of Regional Variability and Measurement Reproducibility of Intravoxel Incoherent Motion Diffusion Weighted Imaging Using a Cardiac Stationary Phase Based ECG Trigger Method[J]. BioMed research international, 2018, 2018:4604218.
4. Dyvorne H, Jajamovich G, Kakite S, et al. Intravoxel incoherent motion diffusion imaging of the liver: optimal b-value subsampling and impact on parameter precision and reproducibility[J]. European journal of radiology, 2014, 83(12): 2109-2113.
5. Minosse S, Marzi S, Piludu F, et al. Correlation study between DKI and conventional DWI in brain and head and neck tumors[J]. Magnetic resonance imaging, 2017, 42: 114-122.
Figures