2609
Quantitative magnetic resonance relaxometry for identifying lymphatic insufficiency in patients with secondary lymphedema1Physical Medicine and Rehabilitation, Vanderbilt Medical Center, Nashville, TN, United States, 2Radiology and Radiological Sciences, Vanderbilt Medical Center, Nashville, TN, United States, 3Pediatrics, Vanderbilt Medical Center, Nashville, TN, United States
Synopsis
MRI methods capable of evaluating tissue changes in response to lymphatic dysfunction have not been incorporated into lymphedema diagnosis and management owing to limited clinical evaluation of these technologies. We performed quantitative relaxometry in the skin and deep tissue of patients with lymphedema and matched controls, in sequence with standard biophysical bedside measures used for lymphedema assessment. In both deep tissue and skin, T2 was elevated in patients relative to control volunteers, consistent with edema, and relaxometry values were more discriminatory for category (i.e., control versus lymphedema) compared to common bedside tools of arm volume asymmetry and tissue dielectric constant.
Introduction
Breast cancer treatment-related lymphedema (BCRL) arises due to mechanical insufficiency following cancer therapies, including radiation therapy and axillary lymph node (LN) removal, and is a comorbidity affecting approximately 30-40% of breast cancer survivors1. Early detection and management are considered most effective to minimize progression, yet fundamental gaps exist in our knowledge regarding how functional changes in tissue lead to BCRL and whether early biomarkers of BCRL risk may be used to titrate prophylactic therapies. MRI methods capable of quantitatively evaluating tissue changes in response to lymphatic dysfunction have not yet been incorporated into condition management. However, recently efforts have focused on translating MRI approaches used for measuring circulatory dynamics in other organs to the lymphatic system to characterize LN structure2, 3 and to generate sensitive internal markers of functional tissue changes in response to lymphatic therapy4, 5. This work has provided evidence that quantitative markers of tissue water microenvironment adjust in response to compete decongestive therapies, whereas many more common bedside measures do not. Here, we extend this work to evaluate hypothesized changes in tissue water relaxation time (T2); a well-known MRI biomarker of tissue composition, edema, and fibrosis6; in healthy controls and patients with BCRL. MRI is paired with conventional measures of limb volume, tissue dielectric constant (TDC), and bioimpedance spectroscopy (BIS), with the goal of understanding whether quantitative MRI provides added discriminatory capacity relative to these more common bedside tools for discriminating regional edematous tissue.Methods
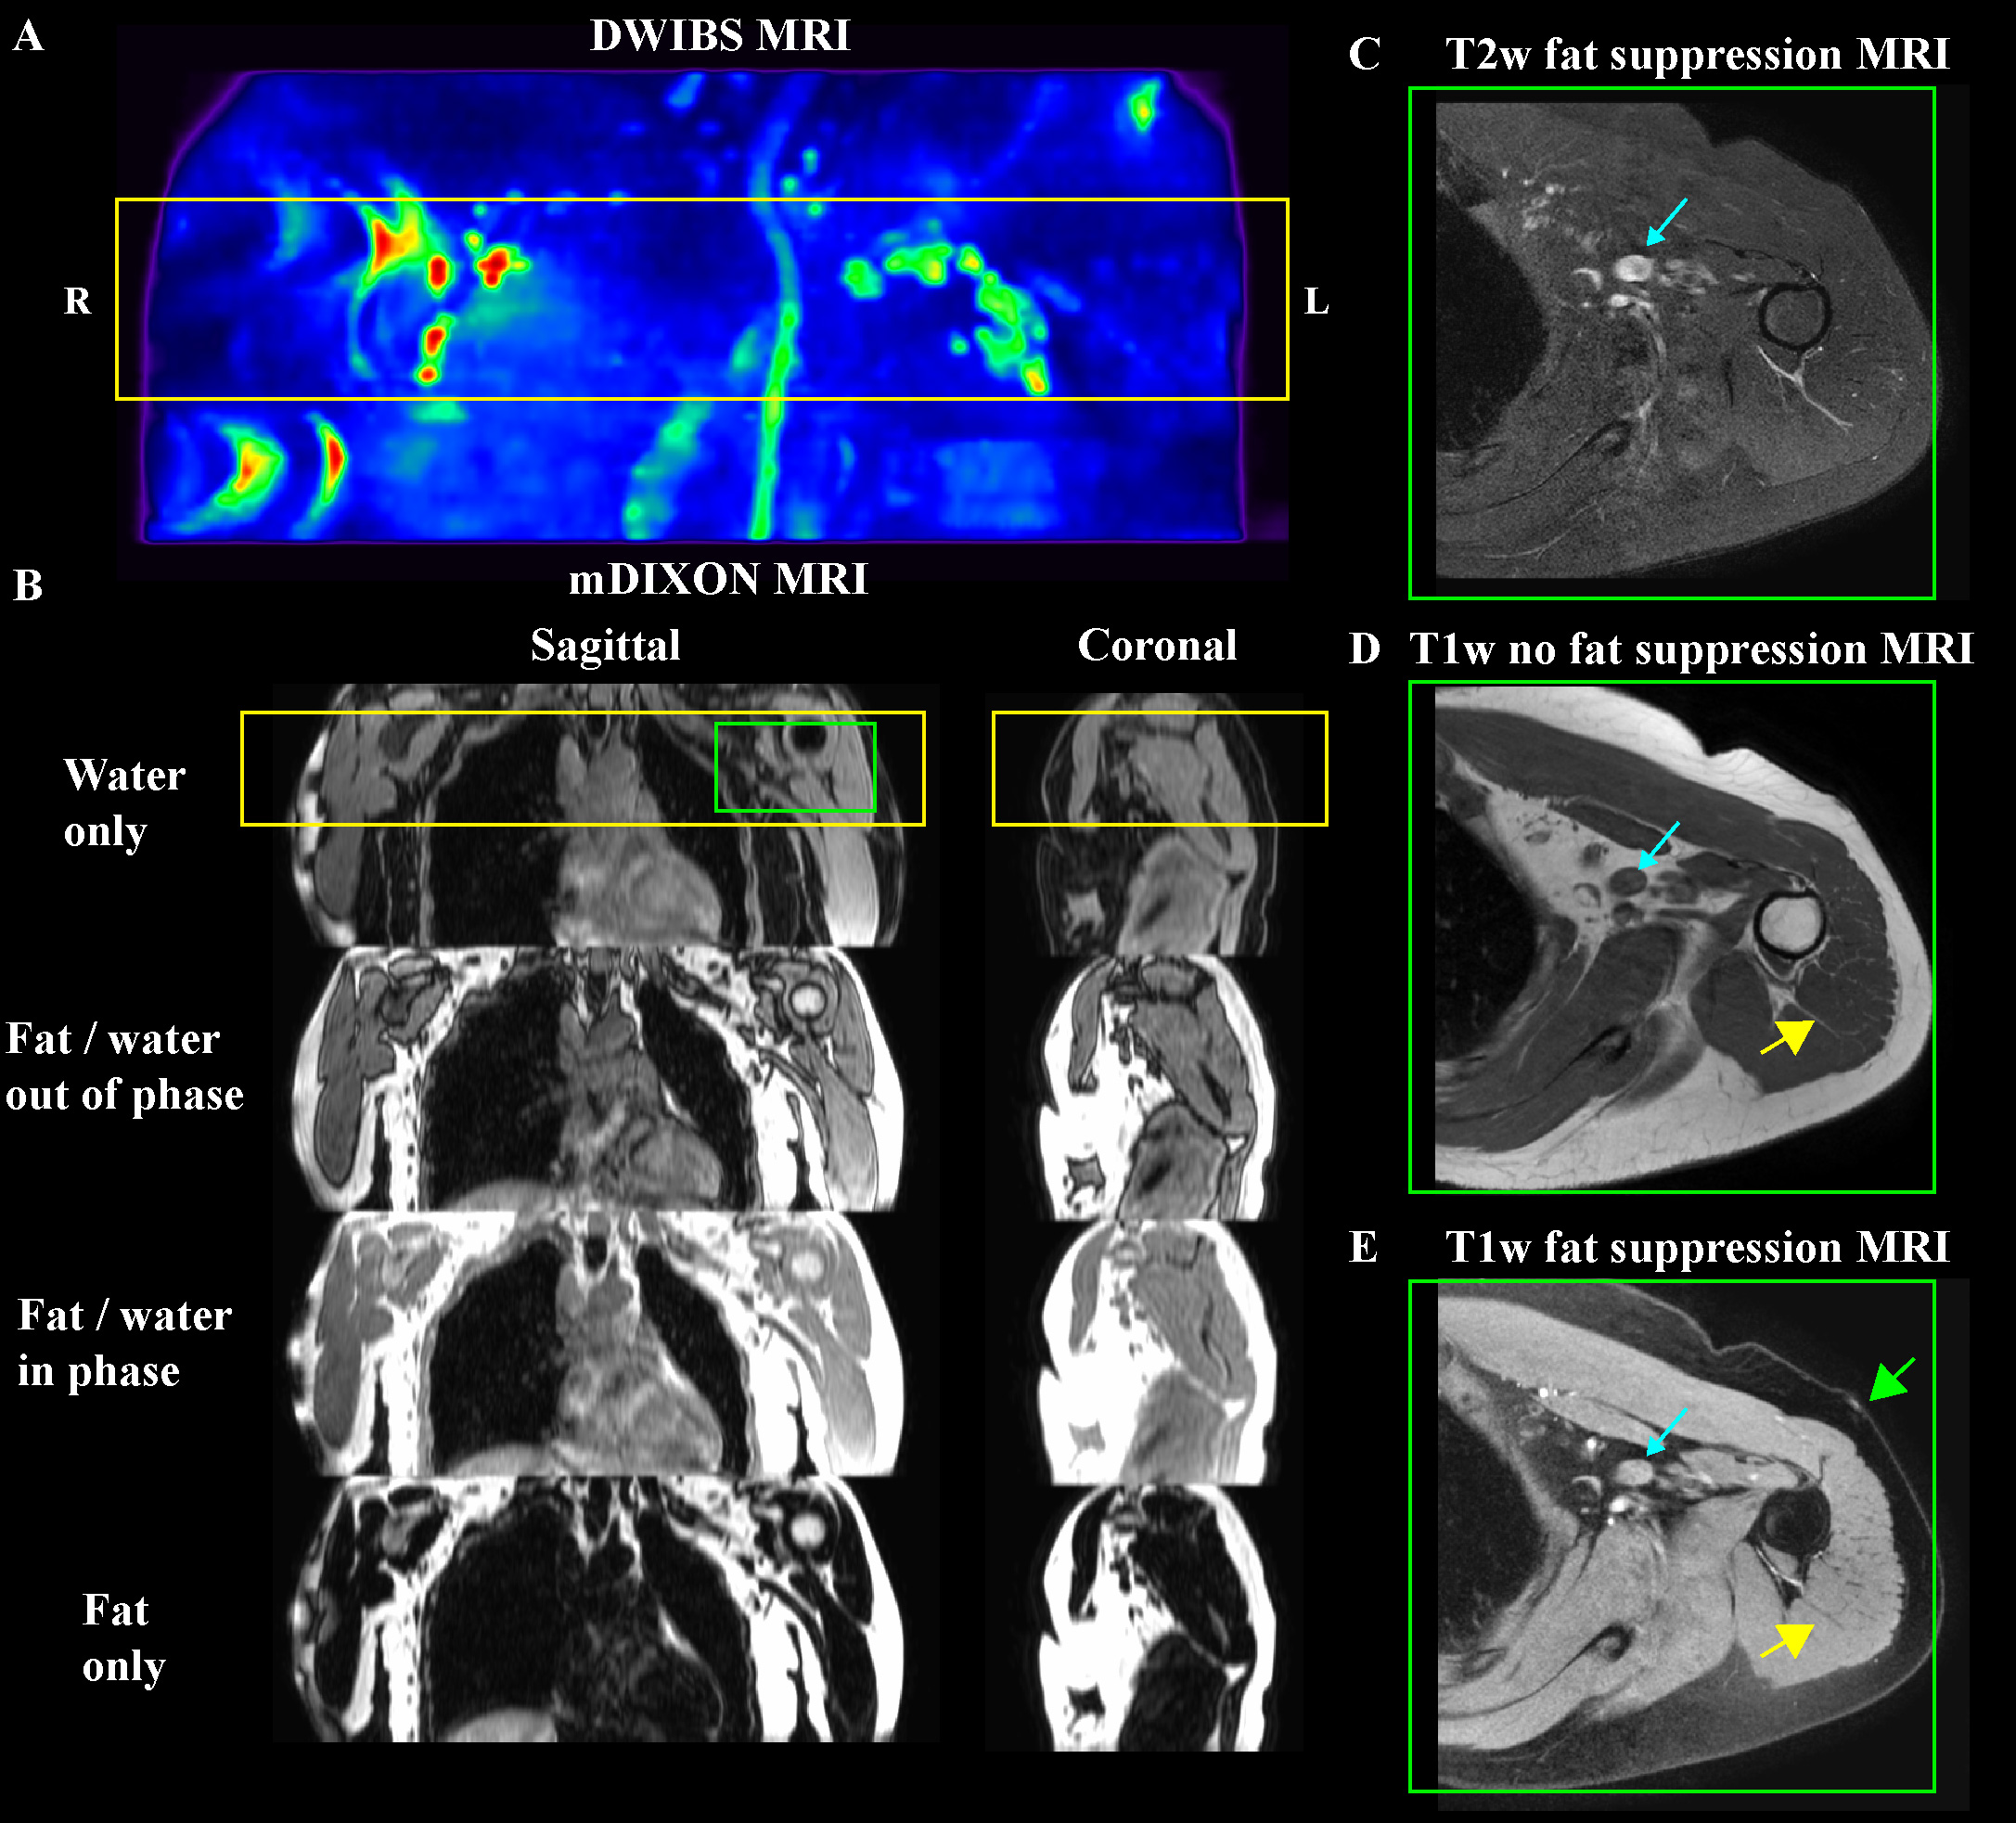
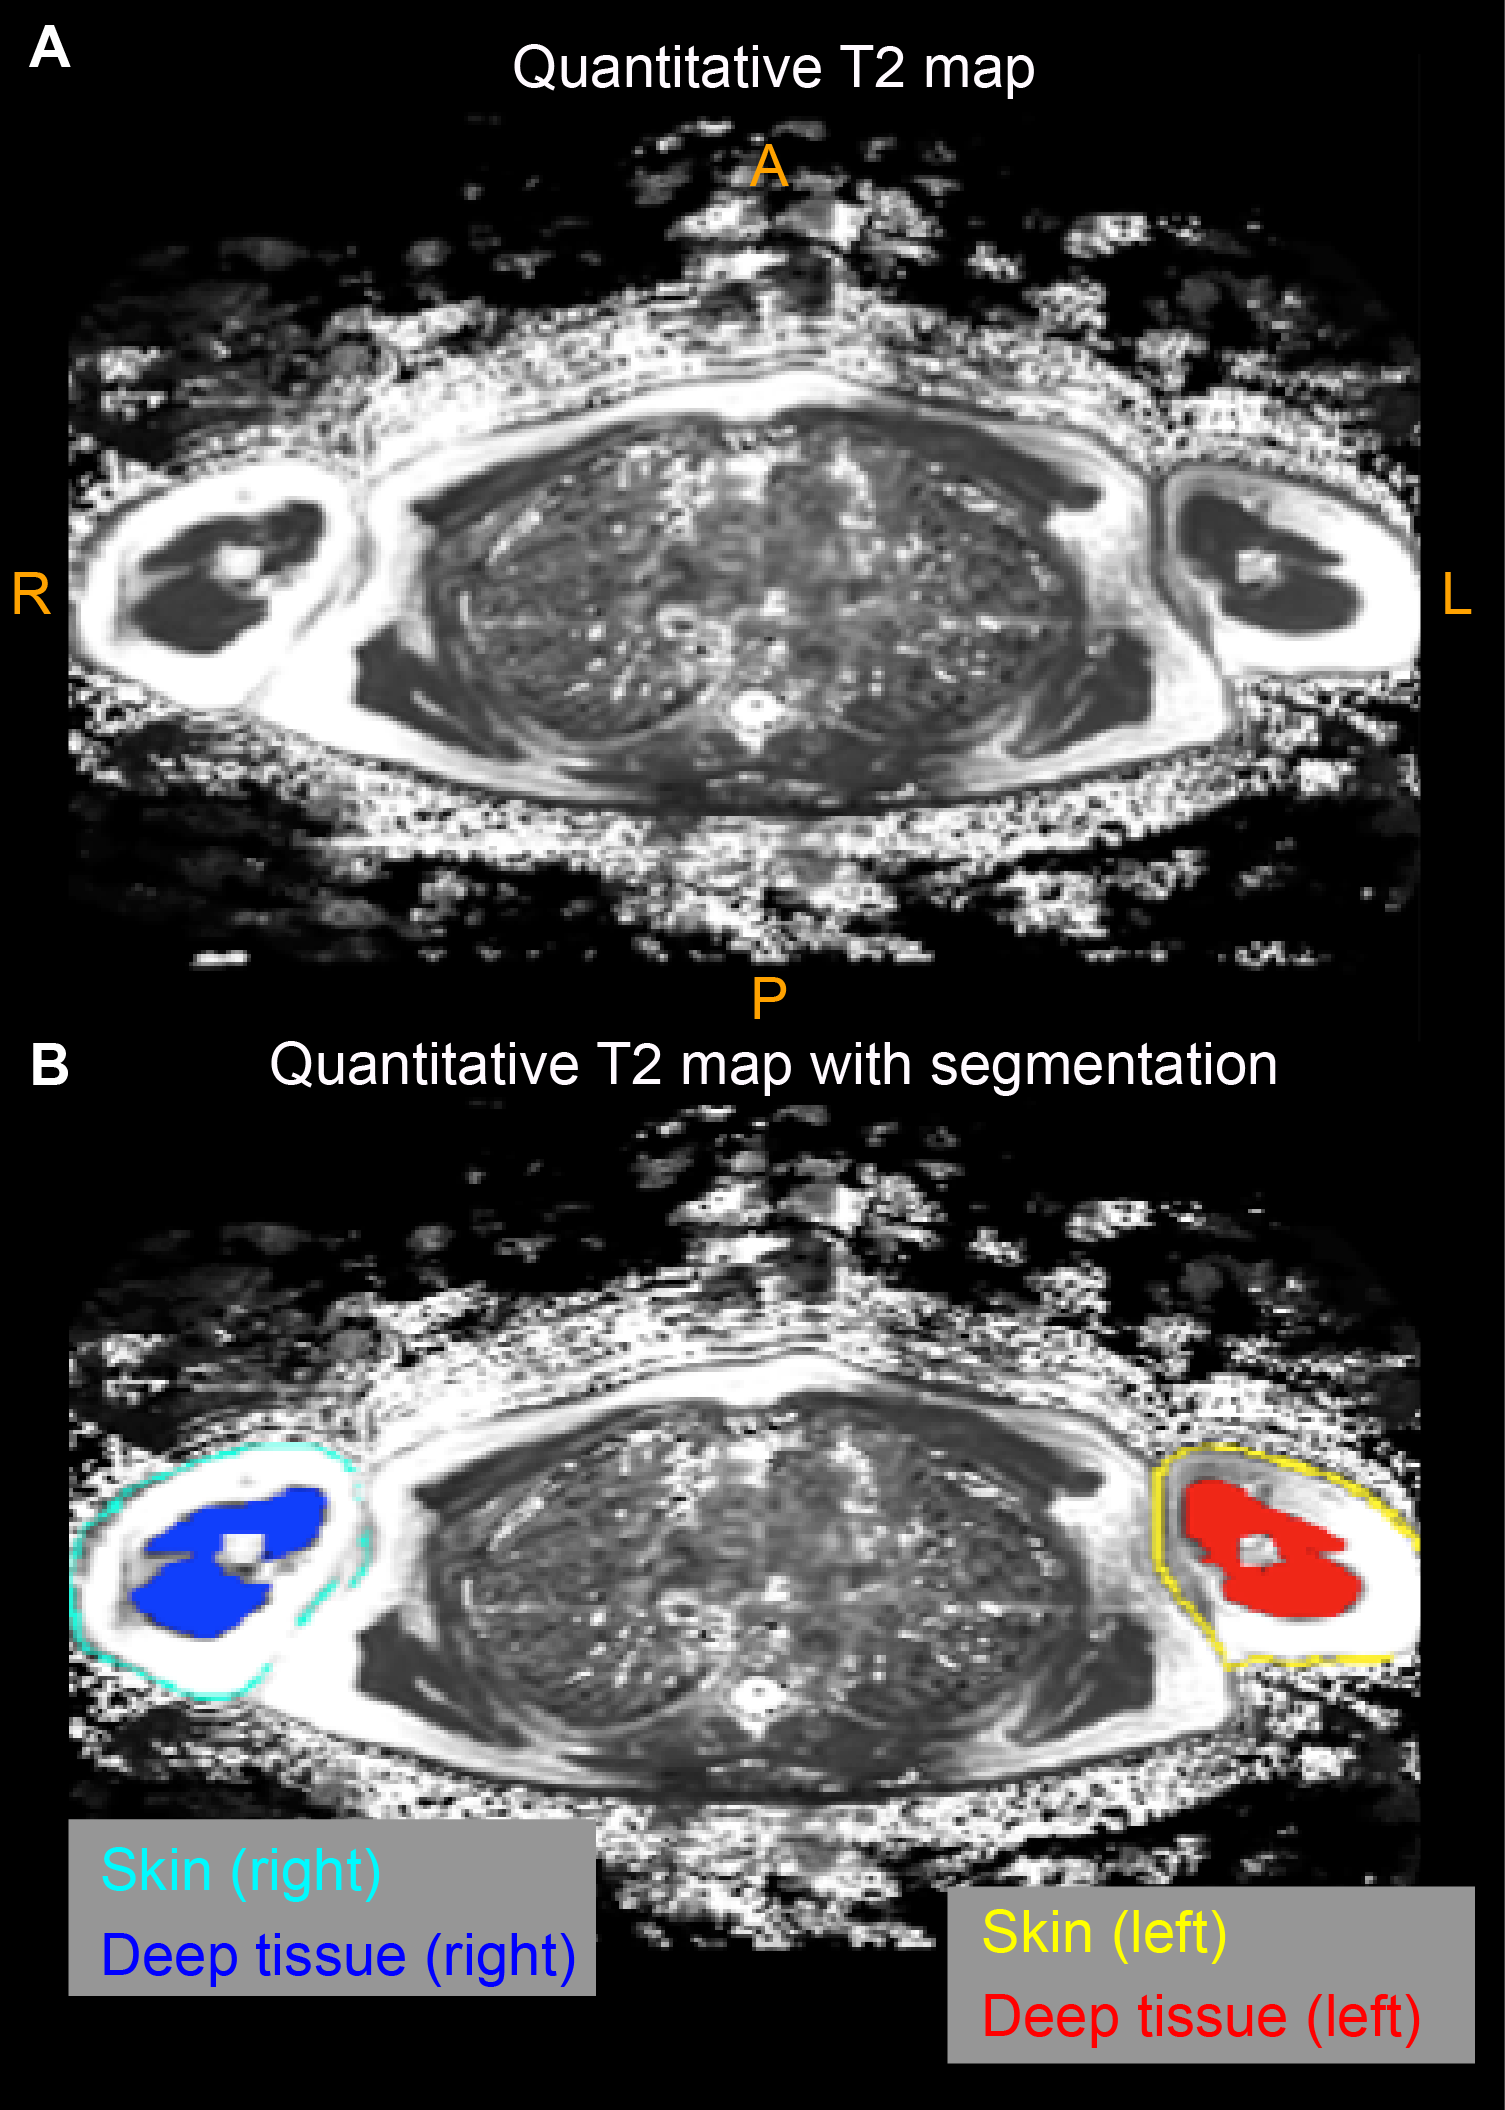
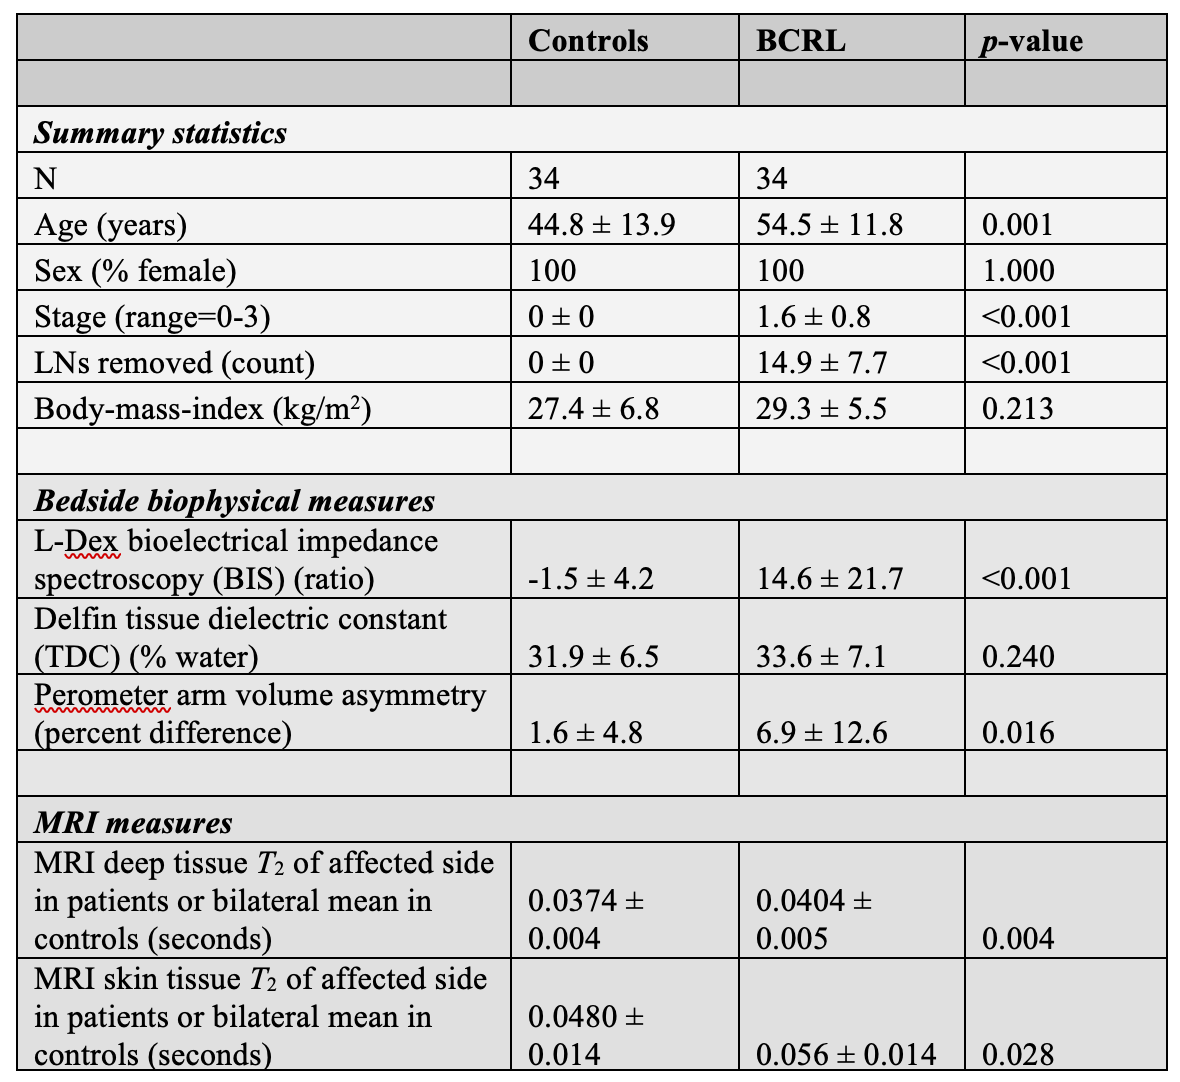
Volunteers (n=68) provided informed consent and were comprised of BCRL (n=34) and healthy controls (n=34) matched for age- (within one decade of life), sex-, body-mass-index (BMI), and handedness (Table 1). All participants received (i) 3 Tesla (3T) MRI (Philips Healthcare, Best, The Netherlands) of the bilateral upper extremities and torso, (ii) limb volumetric assessment, (iii) TDC, and (iv) BIS. For MRI, standard DWIBS, common spatial resolution T1-weighted and T2-weighted (0.9x0.9x5 mm3), and multi-point Dixon imaging were applied (dual-echo per TR=3.5 ms, TE1=1.15, TE2=2.3 ms, 3D gradient echo readout; duration=18s) over a field-of-view (FOV) = 520x424x192 mm3 (Figure 1). For quantitative T2 measurements, a multi-echo turbo-spin-echo sequence was applied (turbo-spin-echo; echoes=16; range=9-189 ms; increment=12 ms; spatial resolution=1.8x1.5x5 mm). B1 field maps (3D gradient echo, TE/TR1/TR2=2.3/30/130 ms, spatial resolution=1.8x1.5x5 mm) were obtained to ensure adequate B1 in bilateral upper arm and axillary regions. Separately for right and left arms, (i) deep arm tissue and (ii) skin was segmented and mean quantitative T2 values were recorded in each region (Figure 2). For bedside biophysical measures, bilateral arm volumes were acquired using the Perometer (mL; Perometer 400NT, Pero-System, Wuppertal, Germany). Percent difference in arm volume was calculated. Bilateral TDC measurements were obtained using a Delfin MoistureMeterD (Delphin, Kuopio, Finland) at a depth of 1.5-2.5 mm7. BIS was administered (ImpediMed L-Dex® U400, Carlsbad, CA) to measure the impedance of each arm8. The L-Dex ratio is reported as a measure of the ratio of the impedance of extracellular water in the affected to contralateral limb9. Differences in study observables between patients and controls (Student’s t-test) were calculated. Values meeting significance at an uncorrected p<0.05 and Bonferroni-corrected p<0.01 were noted. Finally, to obtain information on potential discriminatory capacity of the different measurements for distinguishing participants with vs. without BCRL, we calculated receiver operating characteristic area under the curve (ROC-AUC; Matlab 2018b) for the MRI and bedside measurements.Results
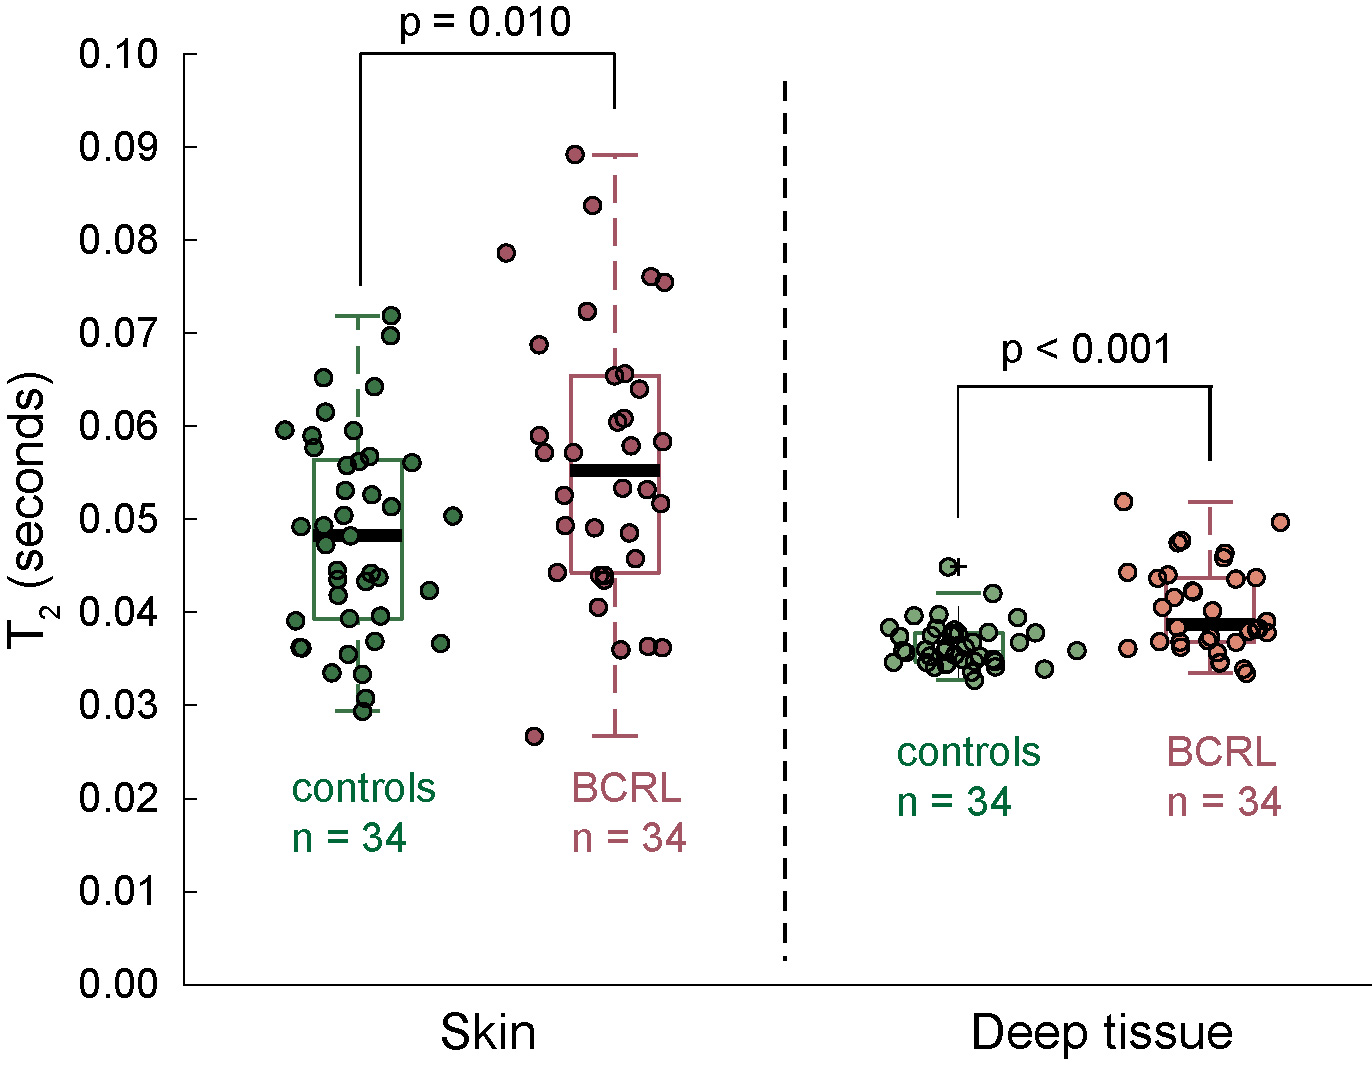
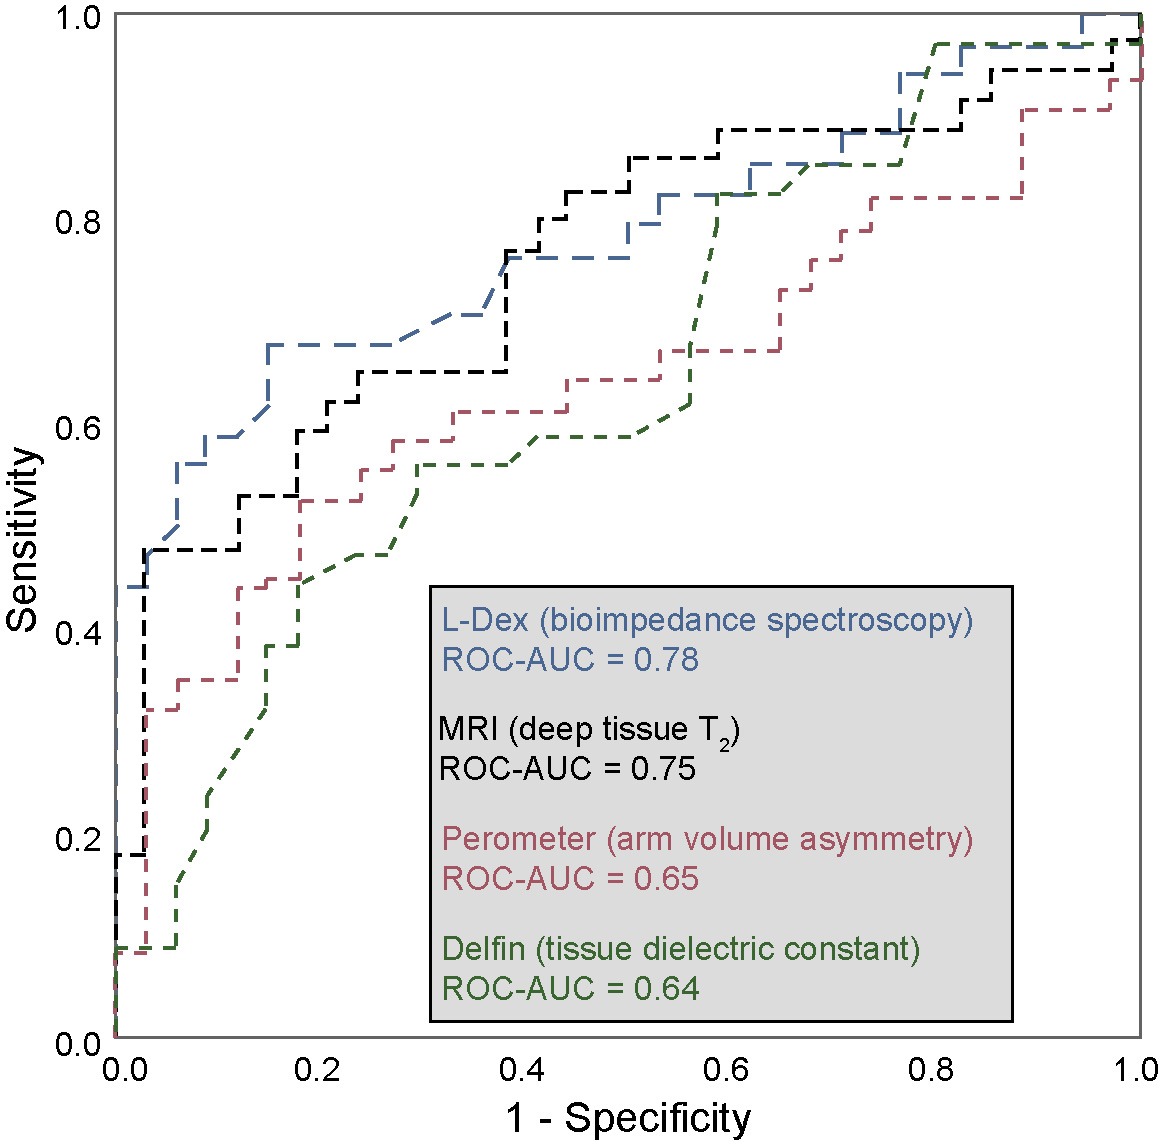
Demographic information for patients (n=34; age= 54.5±11.8 years) and controls (n=34; age=44.8±13.9 years) are summarized in Table 1. Groups were matched for age within one decade and BMI. BCRL stage for patients was 1.6±0.8 (range=0-3), with 14.9±7.7 LNs removed (range=1-27) and BCRL affecting the left arm in 16/34 patients and right arm in 18/34 patients. Figure 2 shows representative T2 maps also highlighting the different regions evaluated. In patients with BCRL, T2 was elevated in deep tissue (0.0404±0.0048 ms vs. 0.0374±0.0034 ms; p<0.001) and skin (0.056±0.0150 ms vs. 0.0480±0.0135 ms; p=0.010) (Figure 3). Of the common bedside measures, arm volume difference was higher in patients with BCRL (6.9±12.6%; vs. 1.6±4.8%; p=0.016) and L-Dex ratio was significantly greater between patients and controls (14.6±21.8 vs. -1.5±4.2; p<0.001). No significant difference was observed between TDC values in the standardized upper arm region between patients and controls (33.6±7.1 vs. 31.9±6.5; p=0.240). Figure 4 shows receiver operating curves for the MRI measure of deep tissue T2 (ROC-AUC=0.75), L-Dex (ROC-AUC=0.78), arm volume asymmetry (ROC-AUC=0.65), and TDC (ROC-AUC=0.64). These findings are consistent with quantitative MRI providing added, albeit incomplete, discriminatory capacity for BCRL diagnosis compared to many common standard bedside measures.Discussion and Conclusion
We observed that in both skin and deep tissue, T2 is elevated in BCRL relative to control participants. This finding is consistent with edema, and furthermore deep tissue T2 is more discriminatory for category compared to bedside tools of arm volume asymmetry and tissue dielectric constant, including in early stage-1 patients where overt limb swelling is difficult to detect. BIS, measured from L-Dex, provided similar discriminatory capacity. These findings reinforce a growing literature suggesting that quantitative MRI of the extremities has potential for aiding in BCRL diagnosis and therapy evaluation, especially in early, reversible stages prior to overt symptoms and volumetric arm changes.Acknowledgements
No acknowledgement found.References
1. DiSipio T, Rye S, Newman B, Hayes S. Incidence of unilateral arm lymphoedema after breast cancer: a systematic review and meta-analysis. Lancet Oncol 2013;14:500-515.
2. Korteweg MA, Zwanenburg JJ, Hoogduin JM, et al. Dissected sentinel lymph nodes of breast cancer patients: characterization with high-spatial-resolution 7-T MR imaging. Radiology 2011;261:127-135.
3. Korteweg MA, Zwanenburg JJ, van Diest PJ, et al. Characterization of ex vivo healthy human axillary lymph nodes with high resolution 7 Tesla MRI. Eur Radiol 2011;21:310-317.
4. Rane S, Donahue PM, Towse T, et al. Clinical feasibility of noninvasive visualization of lymphatic flow with principles of spin labeling MR imaging: implications for lymphedema assessment. Radiology 2013;269:893-902.
5. Donahue MJ, Donahue PC, Rane S, et al. Assessment of lymphatic impairment and interstitial protein accumulation in patients with breast cancer treatment-related lymphedema using CEST MRI. Magn Reson Med 2015.
6. Santyr GE. MR imaging of the breast. Imaging and tissue characterization without intravenous contrast. Magnetic resonance imaging clinics of North America 1994;2:673-690.
7. Mayrovitz HN. Assessing Free and Bound Water in Skin at 300 MHz using Tissue Dielectric Constant Measurements with the MoistureMeterD. Lymphedema: Presentation, Diagnosis, and Treatment2015.
8. Ridner SH, Bonner CM, Doersam JK, Rhoten BA, Schultze B, Dietrich MS. Bioelectrical impedance self-measurement protocol development and daily variation between healthy volunteers and breast cancer survivors with lymphedema. Lymphat Res Biol 2014;12:2-9.
9. Fu MR, Cleland CM, Guth AA, et al. L-dex ratio in detecting breast cancer-related lymphedema: reliability, sensitivity, and specificity. Lymphology 2013;46:85-96.
Figures