2599
Characterization of NAFLD disease evolution with multiparametric MRI/MRE and multi-state Hidden Markov Model1Radiology, Mayo Clinic, Rochester, MN, United States, 2Gastroenterology and Hepatology, Mayo Clinic, Rochester, MN, United States, 3School of Computing, Informatics, and Decision Systems Engineering, Arizona State University, Tempe, AZ, United States
Synopsis
Non-invasively diagnosing non-alcoholic fatty liver disease (NAFLD) and predicting disease prognosis in individual patients are two main unmet clinical needs. There are very few longitudinal studies that evaluate imaging, biochemical, and histopathological variables that predict disease progression of NAFLD. This study established a multi-state Hidden Markov model (HMM) of NAFLD evolution in an animal model with three imaging biomarkers: MRI derived proton density fat fraction (PDFF) and MR elastography (MRE) assessed liver stiffness (LS) and loss modulus (LM). Results have shown that a 3-state HMM can well characterize the natural history of NAFLD, and predict disease progression or regression.
Introduction
Non-alcoholic fatty liver disease (NAFLD) is becoming the most common chronic liver disease (CLD) worldwide1. NAFLD encompasses a spectrum of simple hepatic steatosis to a more aggressive form, namely non-alcoholic steatohepatitis (NASH)2,3. Nevertheless, NASH can both progress and regress without specific pharmacologic intervention4. Currently, liver biopsy and histologically assessing NAFLD activity score (NAS, a combination of three key histological features including steatosis, lobular inflammation, and hepatocyte ballooning) remain the gold standard for NAFLD diagnosing and staging. However, its invasive nature and potential sampling error make it unacceptable for long-term disease monitoring. Non-invasive and reliable surrogates for disease diagnosing and monitoring is an unmet clinical need. Magnetic resonance imaging derived proton-density-fat-fraction (MRI-PDFF) is a quantitative imaging biomarker that enables accurate, repeatable and reproducible quantitative assessment of liver fat over the entire liver3. Another MRI based technique, MR elastography (MRE) which can assess the mechanical change in the liver, has been proven to be the most reliable noninvasive method for detecting and staging liver fibrosis5. Also, our previous preclinical study found out MRE-derived loss modulus or damping ratio was associated with inflammation in five different animal models of CLDs6. Thus, multiparametric MRI/MRE is expected to be potential biomarker of the three key histological features in NAFLD. On the other hand, predicting the probability of disease progression or regression is another clinically vital issue that can help with management decisions. The study purpose is to apply Hidden Markov model (HMM) for describing NAFLD process in which individual moves through a series of states in continuous time. It provides transition probabilities in terms of covariates, and model disease process with a variety of observation schemes, including censored states7. We hypothesis that combing MRI/MRE and HMM can predict the current stage of NAFLD as well as the probabilities of disease progression or regression.Method
A total of 64 wild-type C57BL/6 male mice were used in this study. The progression of NAFLD was developed by feeding the mice with a fast-food diet and fructose water for 1 to 48 weeks. Monthly measurements of 2-point Dixon-derived proton-density fat fraction (PDFF) and 3D MRE-derived liver stiffness (LS) and loss modulus (LM) were collected at thirteen evenly spaced time points (week 1, 4, 8, 12, 16 … 48) throughout the life span of mice. Histopathological analyses of NASH diagnosis and NAS were obtained as an expert judgment at five critical time points (week 1, 12, 24, 36, and 48). The mean values of the three imaging biomarkers (PDFF, LS, LM) were used for training HMM without an expert judgment involved. Transition matrix (i.e., probabilities distribution) between hidden states was machine-learned and inferred by HMM. Accuracies of the generated hidden states was validated with confusion matrix by addressing the cases in each hidden state to the histologic NAFLD classification (i.e., NAS score and NASH diagnosis).Results
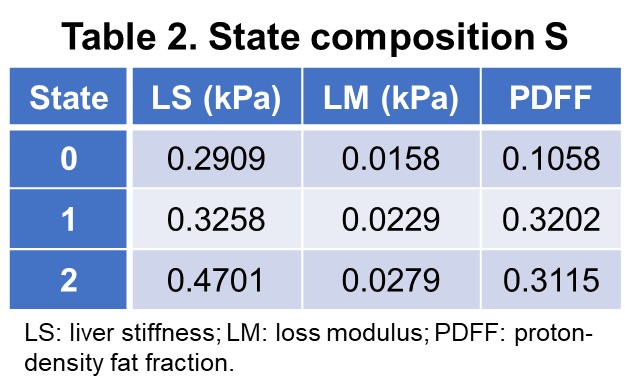
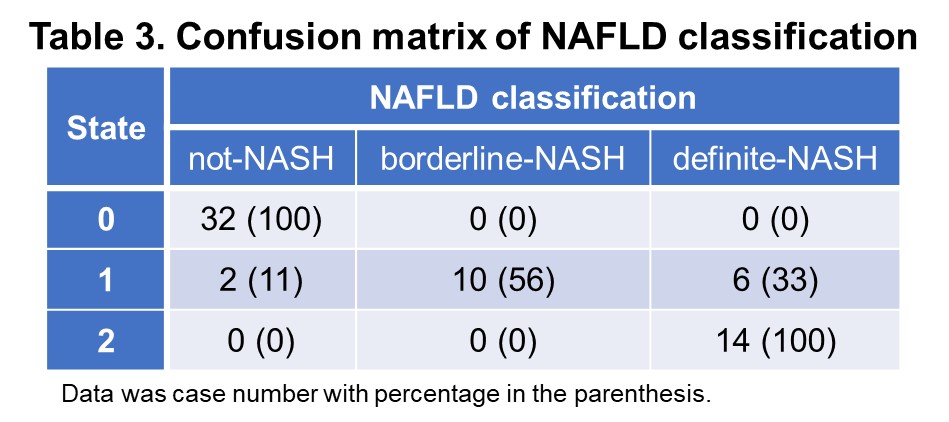
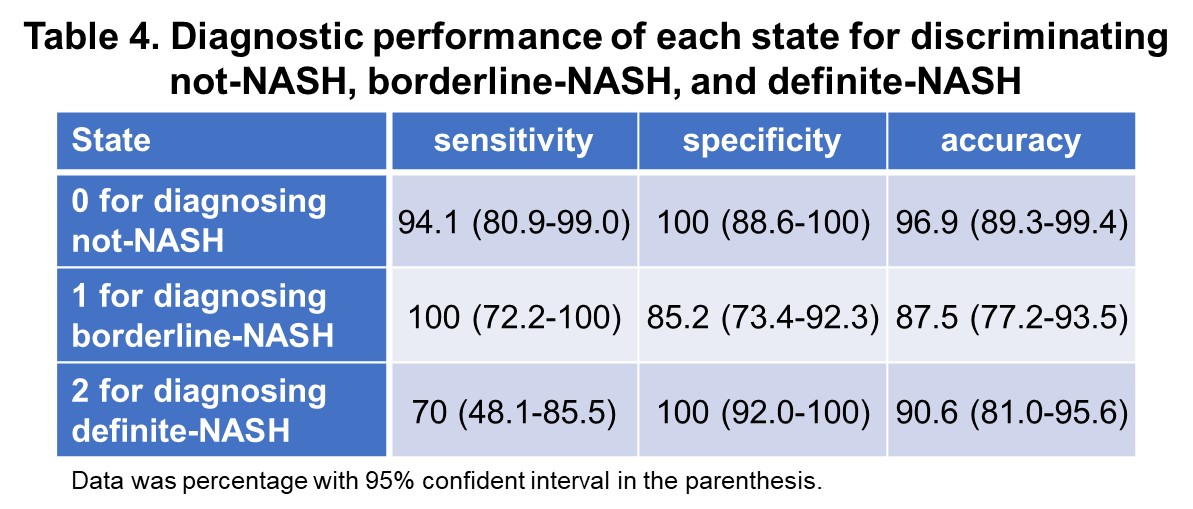
With different fast-food diet and fructose water feeding, at the end of the study, 34 mice were not-NASH, 10 mice were borderline-NASH, and 20 mice developed NASH. The stages of disease were modelled as a homogeneous continuous-time Markov process, with a transition matrix Q and state composition S as demonstrated in Table 1 and Table 2. The time evolution of each imaging biomarker and estimated HMM state was shown in Figure 1. The confusion matrix of NAFLD classification was shown in Table 3. All (100%) mice in state 0 and all mice (100%) in state 2 were Not-NASH and definite-NASH, respectively. Mice NAFLD classifications were dispersive in state 1 with 11%, 56%, and 33% of not-NASH, borderline-NASH, and definite-NASH mice, respectively. The diagnostic performance of each state for discriminating not-NASH, borderline-NASH, and definite-NASH was shown in Table 4. The accuracies for diagnosing not-NASH, borderline-NASH, and definite-NASH using state 0, state 1, and state 2 were 96.9%, 87.5%, and 90.6%, respectively. Transition matrix can predicted the state’s transition probability in the next 12 weeks. 50% of mice in state 0 may stable or progress to state 1 in the next 12 weeks; most of the mice in state 1 (77%) remained stable and only about 23% of mice may progress to state 2 in the next 12 weeks; however, it was not possible for mice in state 2 to regress to the lower states without treatment (Table 1).Discussion and conclusion
In this preclinical study, we combined three MRI/MRE imaging biomarkers and HMM to characterize disease process, predict the current stage of NAFLD (not-NASH, borderline-NASH, and definite-NASH) as well as the probabilities of disease progression or regression. We found that a 3-state HMM can discriminate not-NASH, borderline-NASH, and definite-NASH with high accuracy. Negative results of state 1 can rule out border-NASH, positive results of state 0 and state 2 can rule in not-NASH and definite-NASH, respectively. The main limitations to our study were: 1. The data we used to train HMM was limited without extreme state such as cirrhosis and death, which did not provide enough information to complete the time course of NAFLD; 2. Discrete states may not appropriate as onset is not often sudden. More imaging or biochemistry may help to further improve the capability of disease discrimination. 3. Testing set was needed.Acknowledgements
This study is supported by NIBIB: EB017197 (M.Y.), NIBIB: EB001981 (R.L.E.), NIAAA: AA021171 (V.H.S.)References
1. Wang Y, Wong GL, He FP et al. Quantifying and monitoring fibrosis in non-alcoholic fatty liver disease using dual-photon microscopy. Gut 2019, DOI: 10.1136/gutjnl-2019-318841
2. Lazarus JV, Ekstedt M, Marchesini G et al. A cross-sectional study of the public health response to non-alcoholic fatty liver disease in Europe. J Hepatol 2019, DOI: 10.1016/j.jhep.2019.08.027
3. Caussy C, Reeder SB, Sirlin CB et al. Noninvasive, Quantitative Assessment of Liver Fat by MRI-PDFF as an Endpoint in NASH Trials. Hepatology 2018; 68: 763-772
4. Kleiner DE, Brunt EM, Wilson LA et al. Association of Histologic Disease Activity With Progression of Nonalcoholic Fatty Liver Disease. JAMA Netw Open 2019; 2: e1912565
5. Xiao G, Zhu S, Xiao X et al. Comparison of laboratory tests, ultrasound, or magnetic resonance elastography to detect fibrosis in patients with nonalcoholic fatty liver disease: A meta-analysis. Hepatology 2017; 66: 1486-1501
6. Yin M, Glaser KJ, Manduca A et al. Distinguishing between Hepatic Inflammation and Fibrosis with MR Elastography. Radiology 2017; 284: 694-705
7. Eddy SR. What is a hidden Markov model? Nat Biotechnol 2004; 22: 1315-1316
Figures