2598
Deep learning based multi-organ detection: a step closer to liver T1 map quality assurance1Engineering Science, University of Oxford, Oxford, United Kingdom, 2Oxford Centre for Magnetic Resonance Research (OCMR), University of Oxford, Oxford, United Kingdom, 3Perspectum Diagnostics LTD., Oxford, United Kingdom
Synopsis
Quantitative Liver T1 mapping techniques are becoming more prevalent in the clinic, for the diagnosis and prognosis of various liver diseases. However, time pressure and technique complexity can often lead to incorrect acquisition due to sub-optimal slice location. We implement a faster Region Proposal CNN for the detection of multiple organs in the body, and report back the findings promptly via a local user interface, to inform the radiographers if they need to re-acquire. We show that this network has a high localisation accuracy and high speed, such that it will be applicable in the clinical environment.
Introduction
Quantitative T1 mapping techniques are increasing in popularity in the clinic across the world, due to their ability to correlate well with liver fibrosis and clinical outcomes.1,2 However, the diagnostic performance of T1 maps depends on how carefully measurements were performed by scanner operators. In the case of liver T1 mapping, a large cross-sectional area of the liver should be imaged to reduce error in the measurement. Unfortunately, due to strict time pressures in clinical situations, minimal time is spent choosing the optimal slice location.3 This can lead to an insufficient area of liver being imaged and analysed, which reduces their utility in aiding clinical decisions, therefore requiring re-acquisition. Current checks are often performed too late to allow for immediate correction.In this work, we implement a faster-region convolutional neural network (fRCNN) for organ detection in quantitative T1 mapping, to identify and localise multiple organs, determining in this way if the optimal slice has been selected. The model was tested in-situ on the scanner, to determine if it performs on a timescale that is useful for radiographers to perform an immediate re-acquisition.
Methods
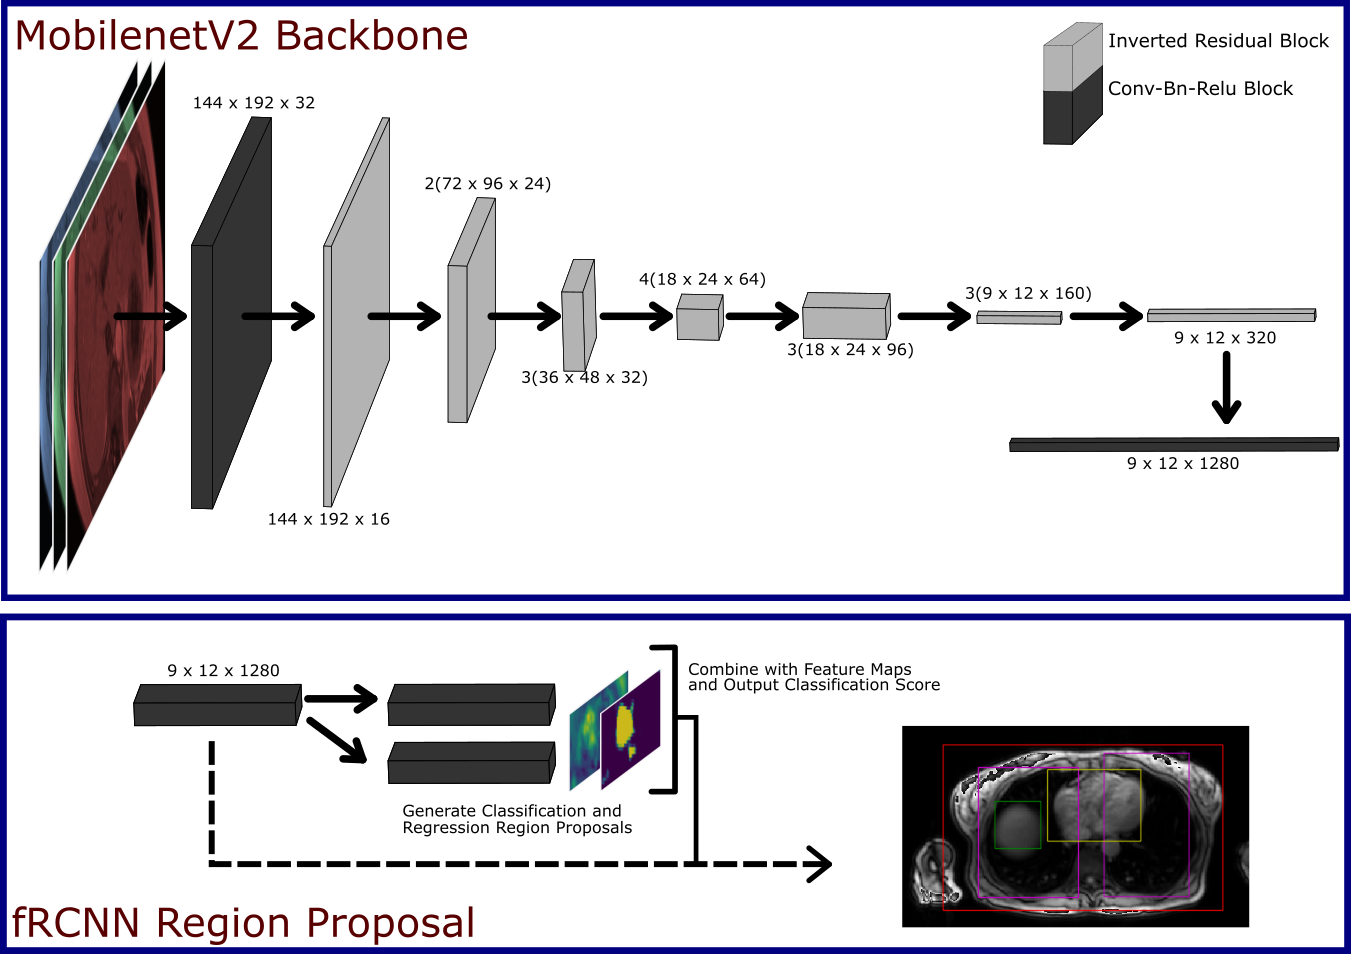
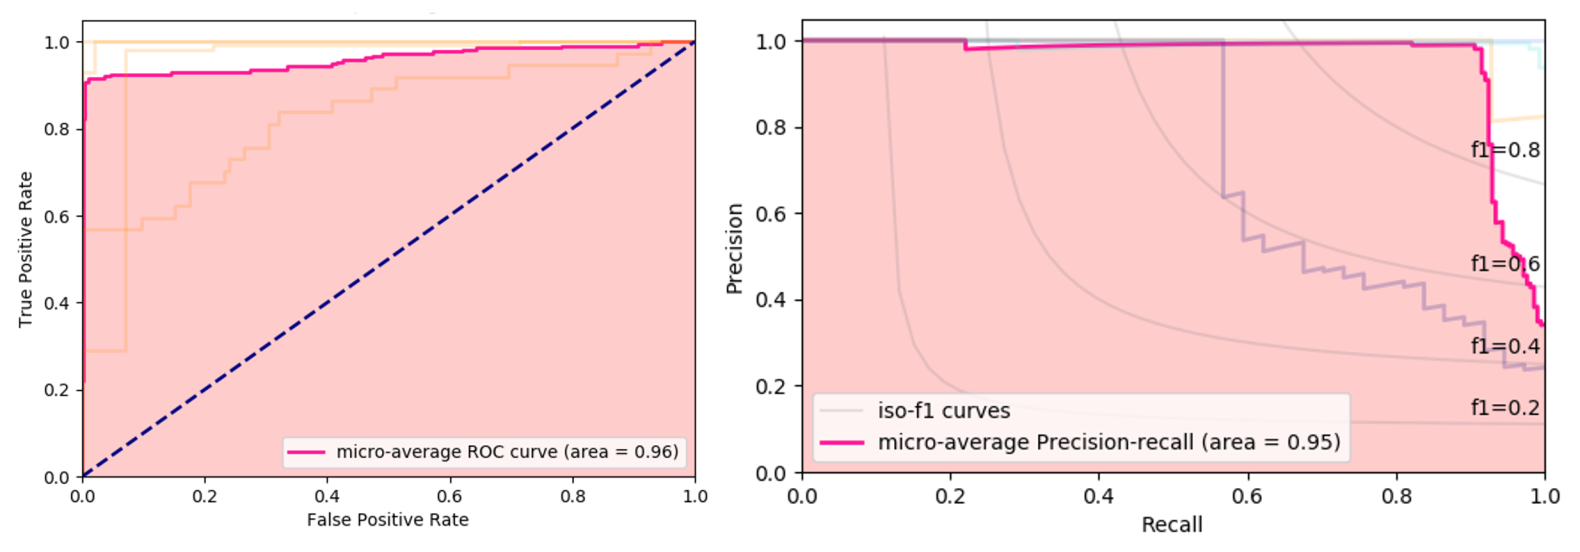
An fRCNN with a MobileNetV2 backbone was used (Fig. 1) for bounding box detection of the body, liver, lungs and heart.4,5 The input was a 288 x 384 x 3 channel image of the liver, where the 3 channels correspond to the 1st, 4th and 7th inversion time (TI) of the shMOLLI T1 mapping technique, such that we give the network information about the T1 recovery curve, but reduce computational intensity that would come with the passing all of the acquisitions. The network, pre-trained on the ImageNet Classification Challenge, was trained on 191 T1 acquisitions of the Liver from the UKBiobank dataset, which had been manually annotated using purpose built software, for 2000 epochs.6 At each epoch the network was validated on 34 acquisitions. During training we minimised the multi-task loss as described by Girshick et al. and monitor the validation loss for overfitting.7 Training was performed on a NVIDIA GeForce GTX 1060 6GB GPU.After training, we output bounding boxes for 25,000 acquisitions from the UKBiobank, and randomly selected 100 of these for result-blind annotation by two MR physicists (MRP1 and MRP2), to form a test set. An intersect over union (IoU) cut-off of 0.5 was deemed a successful localisation. A receiver operating characteristic (ROC) curve and precision recall (PR) curve were used to evaluate the network's performance. As the network predicted multiple bounding boxes classes, we flattened all the predictions and quote the micro-average ROC and PR of the network, which is a measure of the whole network performance that accounts for class imbalance.
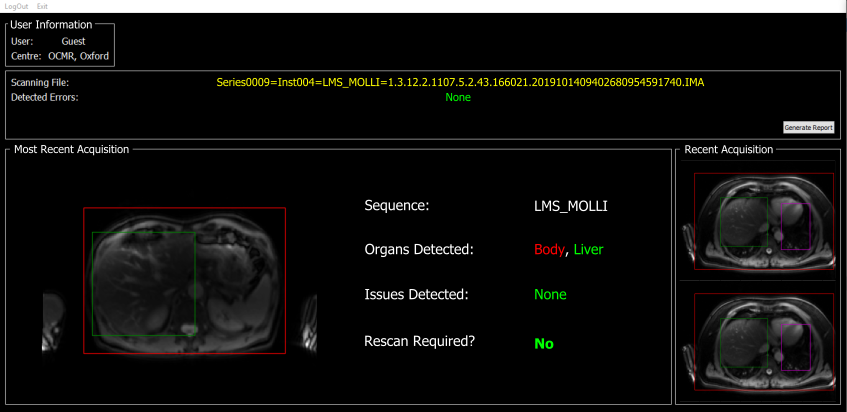
In addition, we validated the usefulness of the network by running the model in real-time on the scanner for 5 healthy volunteers. For each volunteer, the shMOLLI T1 mapping sequence was run 10 times and the time taken from data acquisition, to the feedback interface (Fig. 2) being updated, was recorded. The time taken for the model to run independently of the interface, was also assessed. The model was run on an Intel Xeon E-2124G CPU.
Results
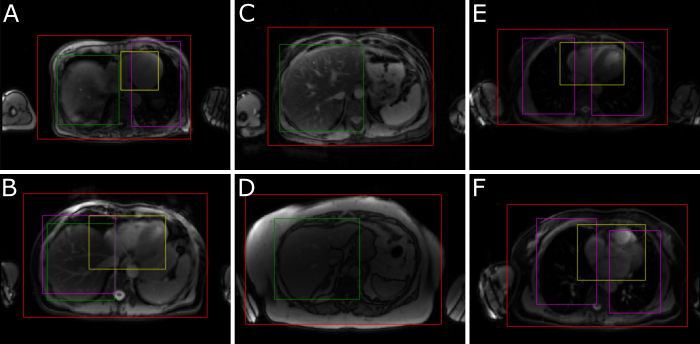
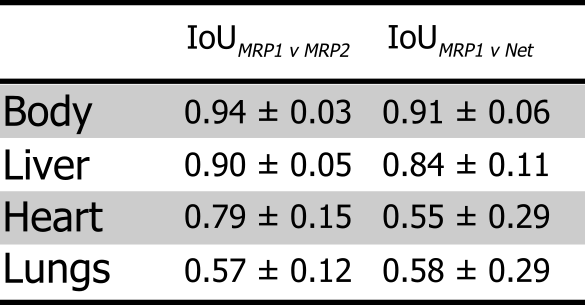
Output bounding boxes for a subset of subjects are displayed in Fig. 3. The mean IoU between the 1st annotator and the network for each class are displayed in Table 1, alongside the mean IoU between the two annotators. All classes predicted by the network had a mean IoU greater than 0.5, with the body and liver greatly exceeding that. The network had a high performance with an area under the ROC curve (AUC) of 0.96 and a mean Average Precision (mAP) of 0.95 (Fig. 4)Time studies on healthy volunteers showed that the network took on average 3.24 ± 0.18 s to process one set of acquisitions. The whole framework, from the output of DICOM files from the scanner, to interface update, took 3.55 ± 0.20 s to complete.
Discussion
The proposed fRCNN identifies the body, liver, heart and lungs with a high classification accuracy as shown by the ROC and PR curves. Additionally, it achieved a good localisation accuracy on the body and liver as shown by the high IoU with the MR physicists. This can be used to determine if a sufficient area of liver is in the slice. There was good agreement between the two annotators, with the exception of the lungs. This is potentially due to one annotator labelling sub sections of lung tissue with respect to the side they belonged to, and the other labelling each piece of lung tissue independently. The whole framework runs on what we deem to be on a useful timescale, as it will not unduly extend the clinical workflow.Conclusions
In this study, we implemented an object detection network to detect and localise the body, and various organs within it in an axial slice with good success. We then showed that this network outputs bounding boxes that can be displayed intuitively, on a timescale that will not extend scanning time unnecessarily. Future work will look at further detection of smaller artefacts within the liver and their effect on quantitative parameters.Acknowledgements
This work was supported by funding from the Engineering and Physical Sciences Research Council (EPSRC) and Medical Research Council (MRC) [grant number EP/L016052/1].References
1. Pavlides, M. et al. Multiparametric magnetic resonance imaging predicts clinical outcomes in patients with chronic liver disease. J. Hepatol. 64, 308–315 (2016).
2. Banerjee, R. et al. Multiparametric magnetic resonance for the non-invasive diagnosis of liver disease. J. Hepatol. 60, 69–77 (2014).
3. Beardmore, C., Woznitza, N. & Goodman, S. The Radiography Workforce Current Challenges and Changing Needs. Coll. Radiogr. 1–4 (2016).
4. Ren, S., He, K., Girshick, R. & Sun, J. Faster R-CNN: Towards Real-Time Object Detection with Region Proposal Networks. IEEE Trans. Pattern Anal. Mach. Intell. 39, 1137–1149 (2017).
5. Sandler, M., Zhu, M., Zhmoginov, A. & Mar, C. V. MobileNetV2: Inverted Residuals and Linear Bottlenecks.
6. Russakovsky, O. et al. ImageNet Large Scale Visual Recognition Challenge.
7. Girshick, R. Fast R-CNN. Proc. IEEE Int. Conf. Comput. Vis. 2015 Inter, 1440–1448 (2015).
Figures