2595
Unsupervised assessment of abdominal adipose tissue from whole body Dixon MRI1The Australian eHealth Research Centre, CSIRO Health and Biosecurity, Brisbane, Australia
Synopsis
Quantitative assessment of visceral adipose tissue (VAT) is important in studies of obesity and metabolic abnormalities. The study developed and evaluated an unsupervised method for abdominal adipose tissue quantification in a large sample from the general population. The results revealed strong correlations with reference measures using dual energy X-ray and MR based methods with human intervention. We also demonstrate the relationship between body mass index (BMI) and adipose tissue compartments. As expected, BMI did not fully reflect fat accumulation in VAT. With increasing BMI, males were more likely to have higher VAT accumulation than females.
INTRODUCTION
Abdominal obesity has been linked to several chronic diseases, with visceral adipose tissue (VAT) itself predictive of the risk of metabolic disturbances and cardiovascular disease1,2. Quantitative assessment of visceral obesity may improve our understanding of the pathogenesis of obesity-related disorders in the general population. Water-fat separated MRI, based on Dixon imaging techniques3, has been commonly used for body fat assessment4. Most of existing MR based methods for VAT segmentation were developed using active contours, clustering and multi-atlas registration-based techniques and were subject to different levels of human intervention5. Moreover, few fully automated methods have been extensively evaluated in the large-scale population studies. The aim of this work is to evaluate our unsupervised adipose tissue quantification method using Dixon MRI in a large sample from the general population.METHODS
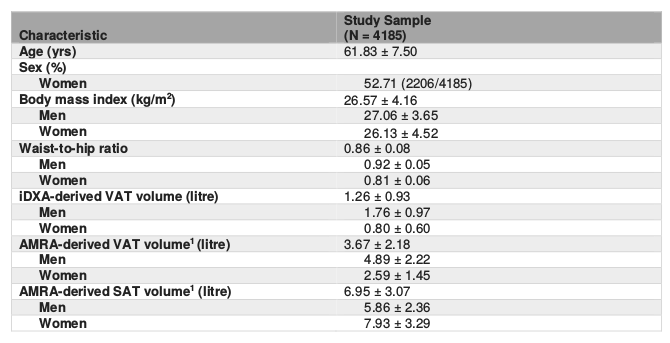
This work included a subset of participants (N = 4185, aged 44-78 years, demographics in Table 1) from the UK Biobank multimodal-imaging cohort, who underwent the body composition assessment using both whole-body dual energy X-ray (DXA) and MR imaging scans. MR acquisition was performed at 1.5T using a dual-echo Dixon-VIBE protocol, which covers a total of 1.1 m (from neck to knees) divided over six overlapping image slabs with voxel size 2.23x2.23x3.5 mm3.The middle three fat image slabs were firstly preprocessed with bias field correction6 and merged into a composite set covering the trunk of the body. The abdominal region was located based on anatomical references of vertebral bodies L1 and L5, which were automatically detected using a multi-atlas registration scheme in an affine manner with a publicly available database of 23 manually labelled MR images of the lower spine7. This allows for a consistent definition of the abdominal region in the general population with different body sizes. Abdominal adipose tissues were initially estimated from the fat-fraction image, i.e., fat fraction=fat/(fat + water), using fuzzy c-means clustering8. The subcutaneous adipose tissue (SAT) was then separated from VAT using graph cuts9. Finally, a postprocessing step was performed to exclude adipose tissues outside the abdominal skeletal muscles and at the posterior of the spine. The SAT and VAT volumes were then quantified from the final segmentation mask within the abdominal region between L1 and L5.
To evaluate the performance of the proposed method, the iDXA and AMRA derived measures obtained from UK Biobank were used as reference values. The AMRA derived measures were provided by AMRA Profiler using a semi-automated multi-atlas registration-based method4. The agreement between different measurements was assessed using linear regression and Bland-Altman analysis.
RESULTS
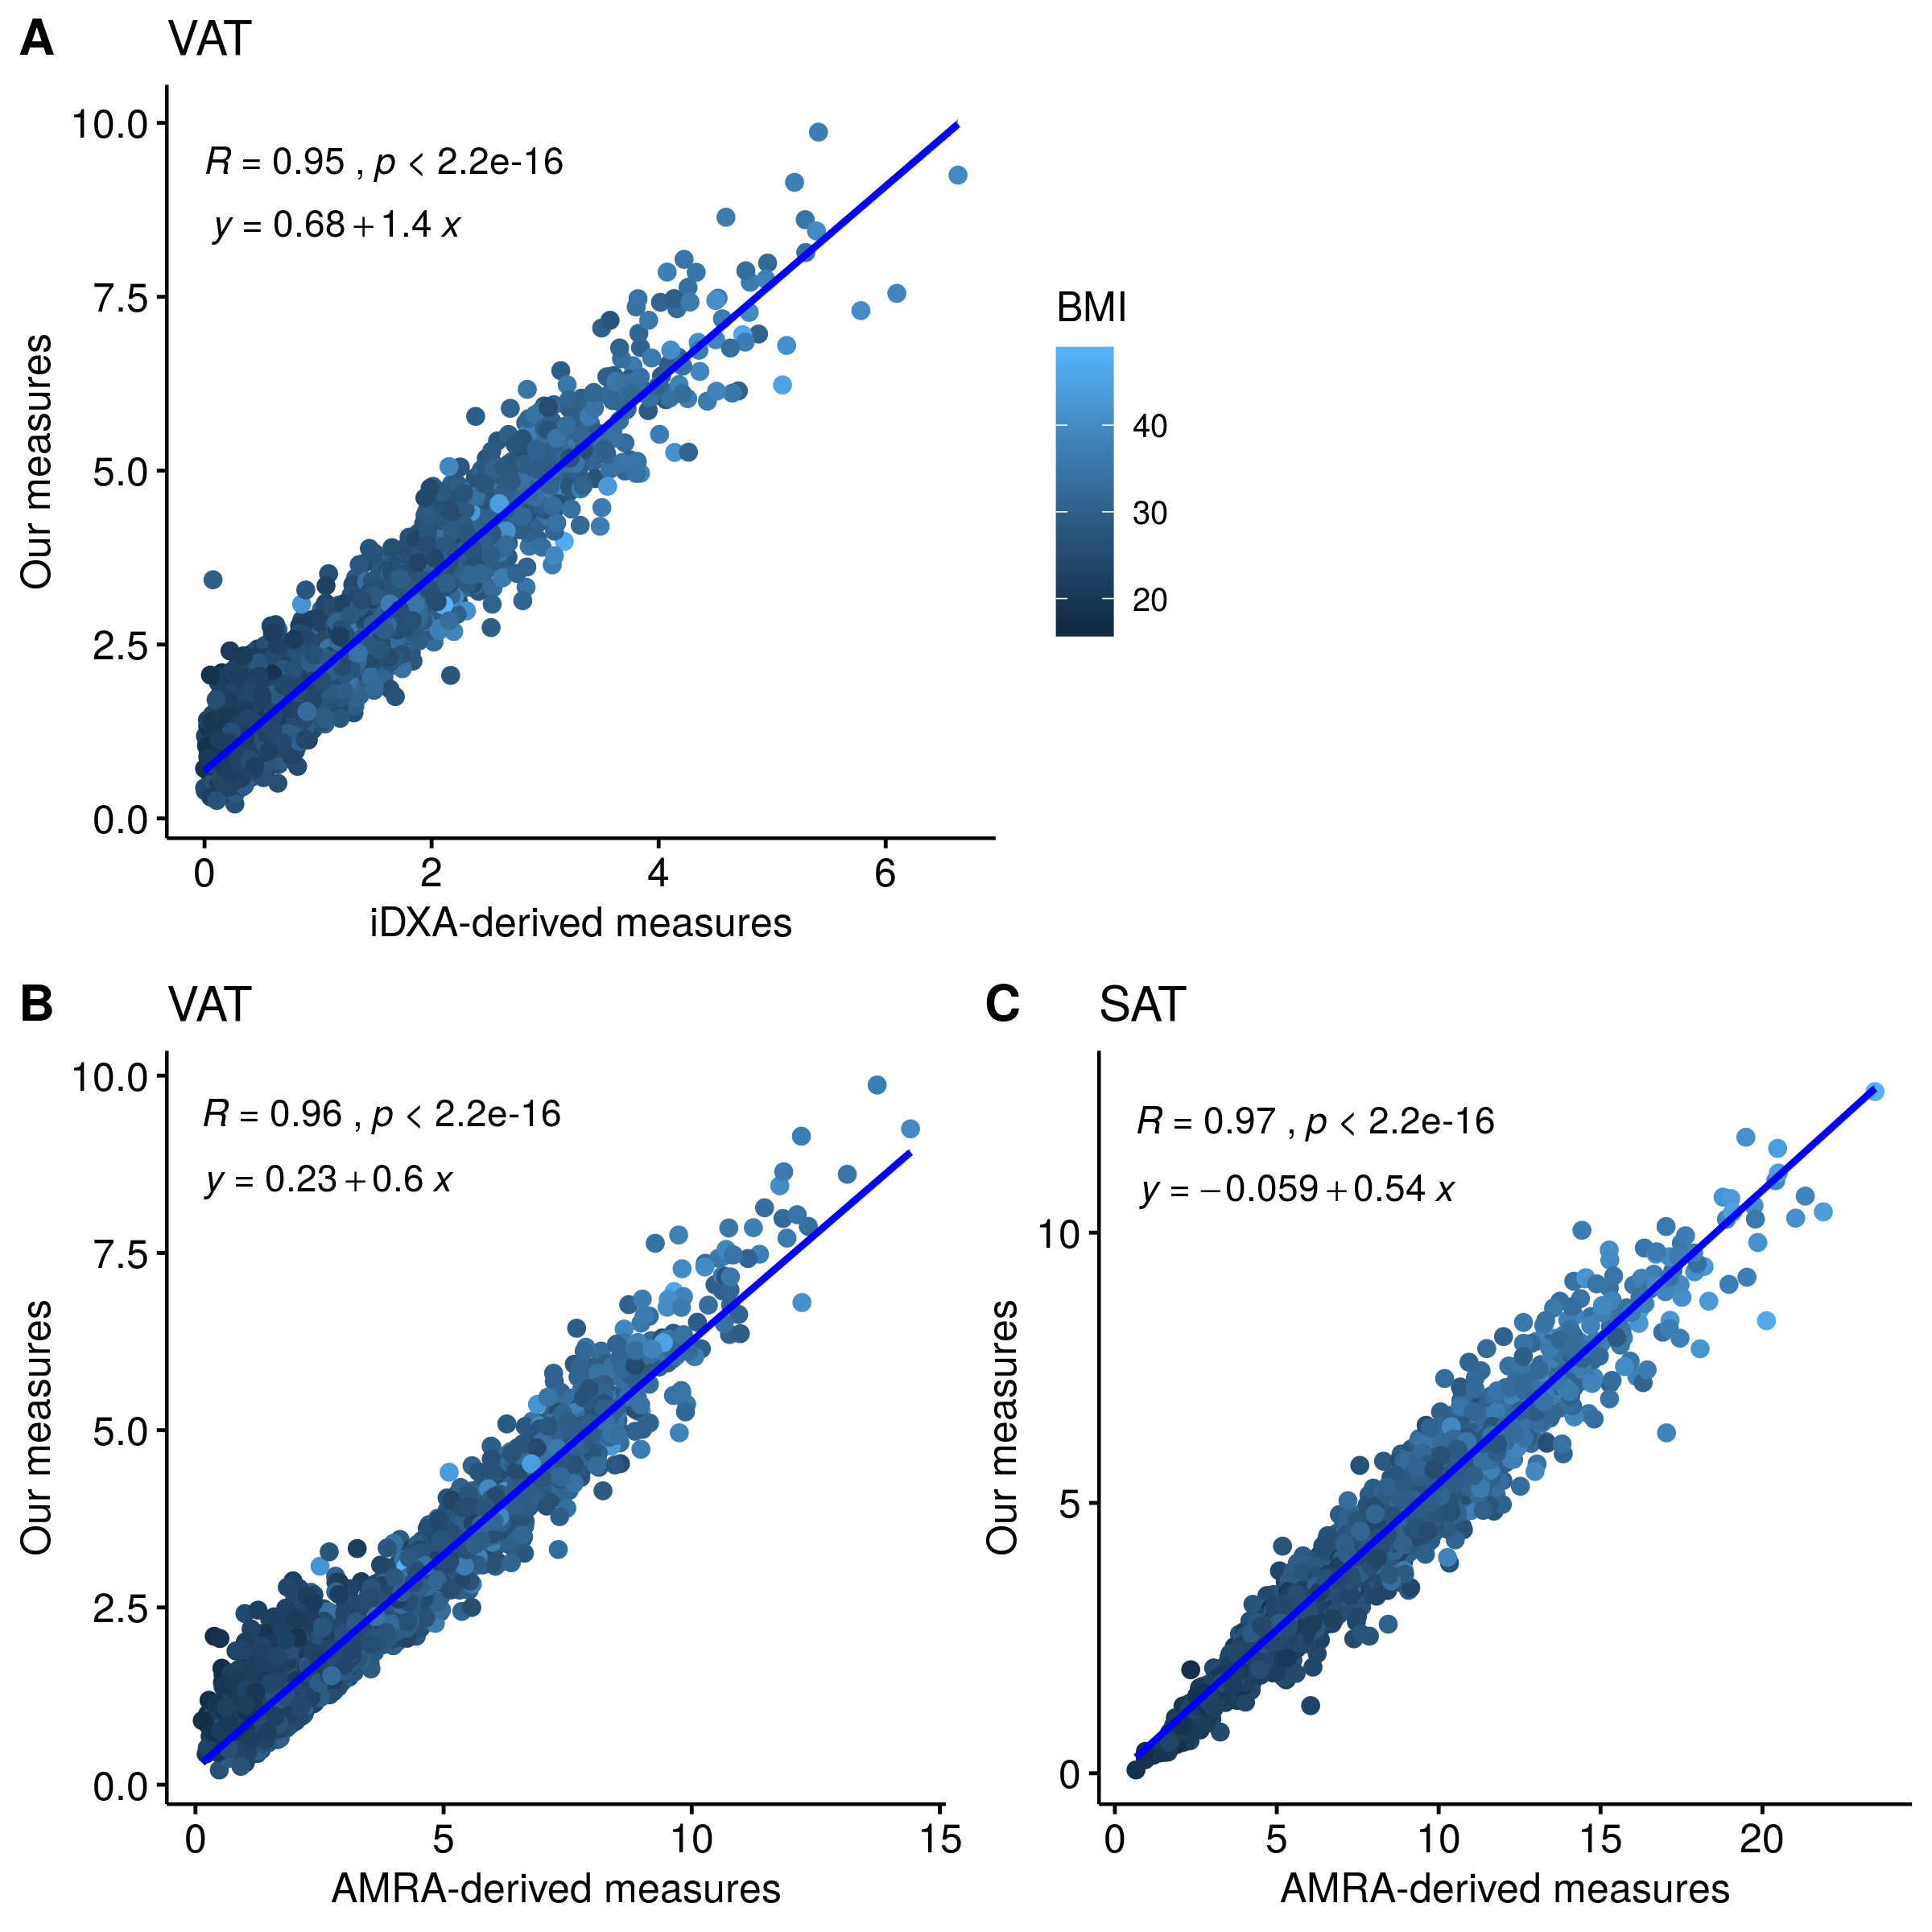
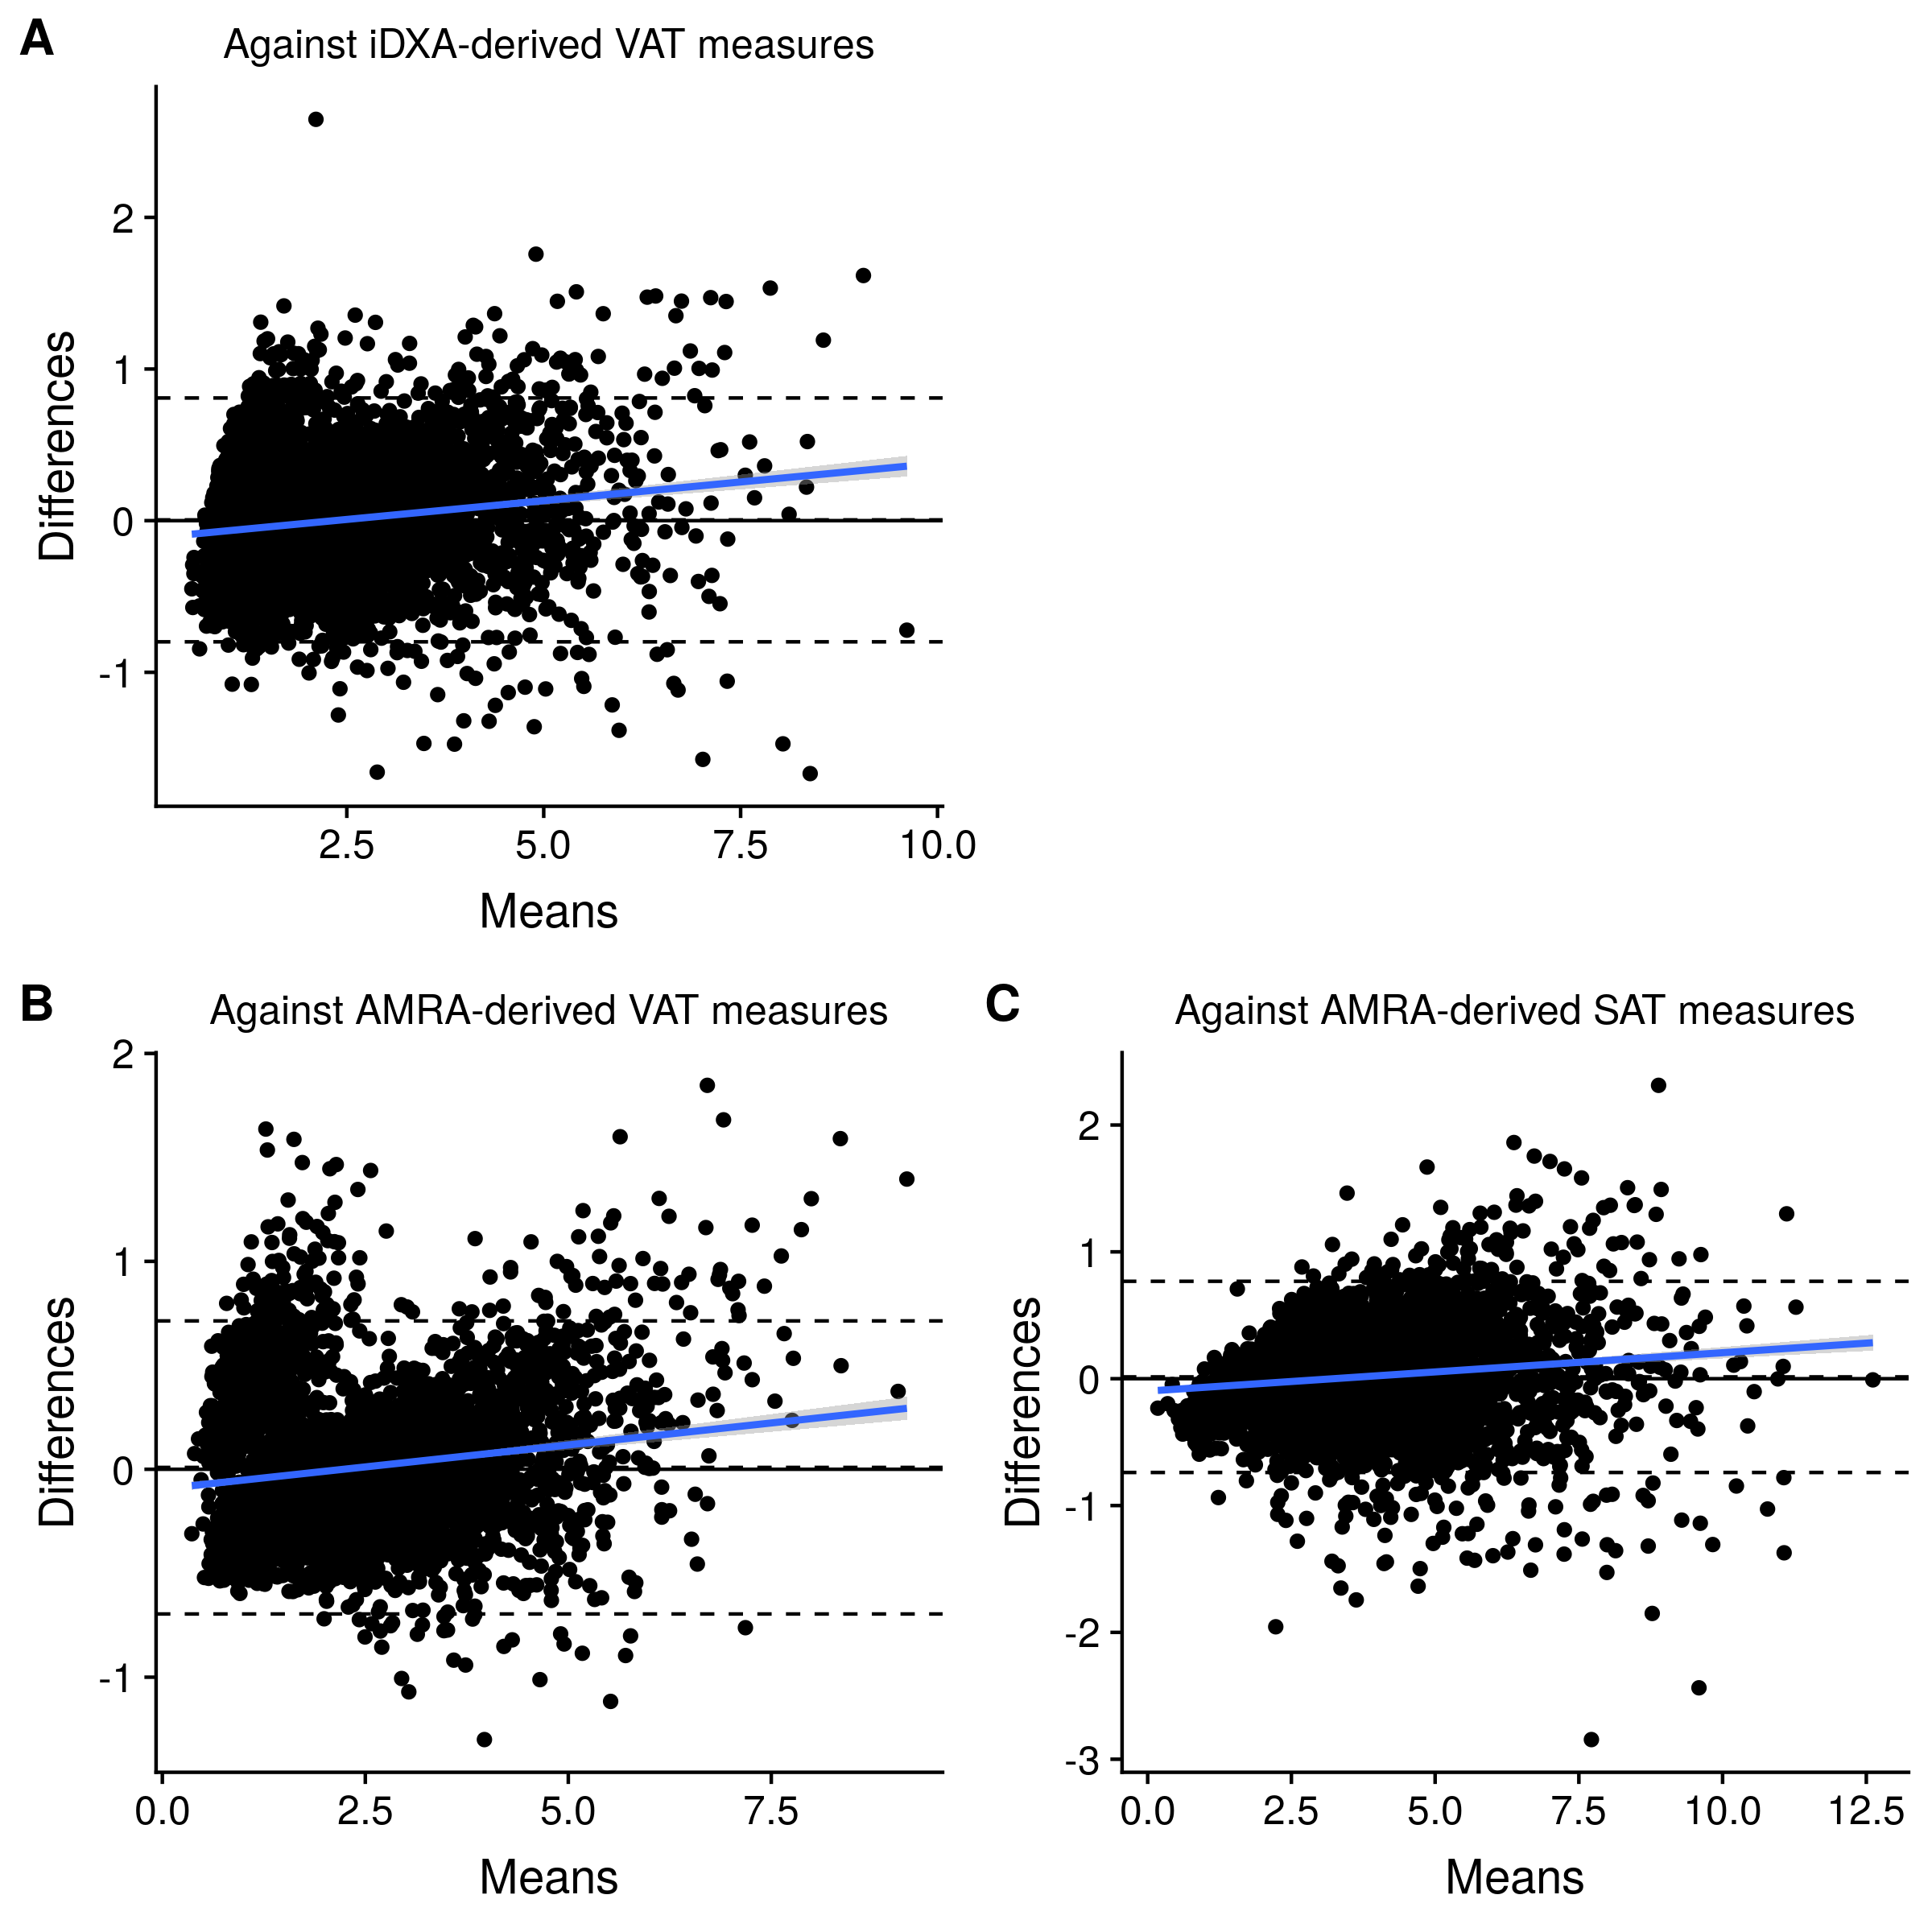
Figure 1 highlights strong correlations between the quantified VAT volumes and the reference VAT measures using both iDXA and AMRA methods. Similarly, the quantified SAT volumes were strongly correlated with the AMRA-derived SAT measures (Figure 1C). Since iDXA and AMRA derived measures did not cover the same part of the body defined in this work, linear transformation with the slope-intercept equations listed in Figure 1 was applied to these reference measures before the Bland-Altman analysis. Figure 2 shows the Bland-Altman plots between our results and the reference measures. The 95% limits of agreement for VAT quantification were -0.8 litre and 0.8 litre against iDXA measures and -0.7 litre and 0.7 litre against AMRA derived measures. Over-segmentation of VAT compartment was observed in a small subset of lean subjects (Figure 2B).In Figure 3, both the quantified VAT and SAT volumes were significantly correlated with BMI. Compared with SAT, the VAT measure were found to have a slightly weak correlation with BMI (R = 0.73 for males and 0.66 for females). Moreover, significant gender differences were observed in these correlations. With increasing BMI, the accumulation of VAT was relatively higher in male participants than that in female participants.
DISCUSSION
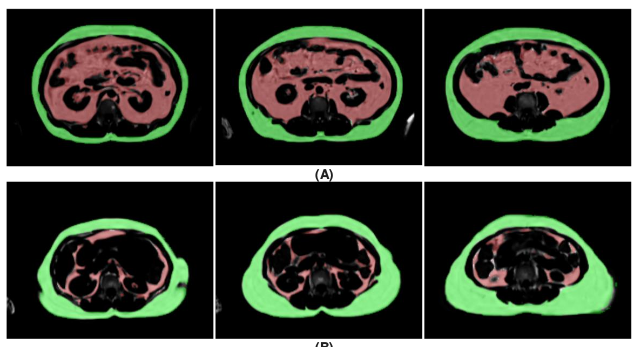
We have demonstrated the feasibility to automatically quantify regional adipose tissue (VAT and SAT) in a large sample of the general population. The results were strongly correlated with the reference iDXA and AMRA derived measures. A strong agreement was also observed between our quantified adipose tissue volumes and reference measures after linear transformation. This provides the capacity for MR to provide a reliable non-ionizing assessment of abdominal adiposity with no human intervention required.A good correlation between BMI and regional adipose tissue compartments was also observed. However, increasing BMI is not equal to fat accumulation in either VAT or SAT. Figure 3A demonstrates that BMI lacks the ability to accurately track the change in VAT, which further motivates the need to quantify VAT compartment in obesity-related studies. Furthermore, a gender effect was observed in the fat accumulation within the abdominal region that agrees with previous findings10. With the same BMI levels, males are likely to have higher VAT accumulation than females. This is illustrated in Figure 4, where different VAT and SAT accumulation was observed in male and female obese subjects.
Acknowledgements
This research has been conducted using the UK Biobank Resource under Application Number 27483.References
1. Shuster A, Patlas M, Pinthus JH, Mourtzakis M. The clinical importance of visceral adiposity: a critical review of methods for visceral adipose tissue analysis. The British journal of radiology. 2012 Jan;85(1009):1-0.
2. Demerath EW, Reed D, Rogers N, Sun SS, Lee M, Choh AC, Couch W, Czerwinski SA, Chumlea WC, Siervogel RM, Towne B. Visceral adiposity and its anatomical distribution as predictors of the metabolic syndrome and cardiometabolic risk factor levels. The American journal of clinical nutrition. 2008 Nov 1;88(5):1263-71.
3. Dixon WT. Simple proton spectroscopic imaging. Radiology. 1984 Oct;153(1):189-94.
4. Borga M, West J, Bell JD, Harvey NC, Romu T, Heymsfield SB, Leinhard OD. Advanced body composition assessment: from body mass index to body composition profiling. Journal of Investigative Medicine. 2018 Jun 1;66(5):1-9.
5. Borga M. MRI adipose tissue and muscle composition analysis—a review of automation techniques. The British journal of radiology. 2018 Sep;91(1089):20180252.
6. Tustison NJ, Avants BB, Cook PA, Zheng Y, Egan A, Yushkevich PA, Gee JC. N4ITK: improved N3 bias correction. IEEE transactions on medical imaging. 2010 Jun;29(6):1310.
7. Chu C, Belavý DL, Armbrecht G, Bansmann M, Felsenberg D, Zheng G. Fully automatic localization and segmentation of 3D vertebral bodies from CT/MR images via a learning-based method. PloS one. 2015 Nov 23;10(11):e0143327.
8. Klir GJ, Yuan B. Fuzzy sets and fuzzy logic: theory and applications. Upper Saddle River. 1995:563.
9. Boykov Y, Veksler O, Zabih R. Fast approximate energy minimization via graph cuts. IEEE Transactions on pattern analysis and machine intelligence. 2001 Nov;23(11):1222-39.
10. Geer EB, Shen W. Gender differences in insulin resistance, body composition, and energy balance. Gender medicine. 2009 Jan 1;6:60-75.
Figures