2593
Deep Learning for Liver Segmentation and Quantification of Obese Patients1Department of Radiology, Division of Radiological Physics, University Hospital Basel, Basel, Switzerland, 2Department of Biomedical Engineering, University of Basel, Basel, Switzerland, 3St. Clara Research Ltd, St. Clara Hospital, Basel, Switzerland, 4University of Basel, Basel, Switzerland, 5Institute for Biomedical Engineering, University and ETH Zurich, Zurich, Switzerland
Synopsis
Obesity is one of the greatest health risks and strongly related to fatty liver disease. Magnetic resonance imaging enables non-invasive measurement of fat-water distribution in tissue. To provide an automated evaluation of the liver volume and fat percentage, we trained a Multi-Dimensional Gated Recurrent Units network to segment multi-contrast data. The neural network was trained with a limited number of data comprising 52, 20, 10 datasets and was evaluated for liver volume and fat percentage quantification.
Introduction
Obesity has become one of the greatest public health challenges and has a high epidemic prospect. It is estimated that half the world’s adult population will be overweight and obese by 2030.1Generally, obesity is strongly related to fatty liver disease which can be non-invasively assessed by magnetic resonance imaging (MRI) by measuring fat-water distribution in tissues and other biomarkers.2 To quantitatively evaluate the data, e.g. for liver volume and fat percentage, the liver must be segmented. Currently, this time-consuming task is usually performed manually, hampering the translation to clinical routine and big data analysis for biomarker characterization. Hence, a reliable automatic method for liver segmentation and evaluation as provided by current deep learning algorithms is required.
The purpose of this study is to investigate the prospect of deep learning with Multi-Dimensional Gated Recurrent Units (MD-GRU)3,4 for liver segmentation and to determine the reliability of the automated method on liver volume and fat percentage. The training of the MD-GRU network, which strongly differs from classical Convolutional Neural Networks (CNNs) approaches5, was performed on small cohorts of datasets (52, 20, 10) to evaluate the network’s minimal amount of data for a reliable segmentation and outcome.
Methods
MR DataA cohort of 36 obese patients (body mass index > 25) were included in this study approved by our ethics committee. Subjects underwent MRI at two different timepoints (within a time span of 1-4 weeks), resulting in a total of 72 datasets. The MRI protocol for the quantitative (fat fraction and T2*) liver measurement included a transversal T2*-IDEAL 3D multi-echo Flash sequence6 acquired in a single inspiratory breath-hold (TA=17 s, TR=9.05 ms, 6 equally spaced echoes with TE=0.74-7.74 ms and echo spacing 1.4 ms, FA=6°, FoV=450×337.5 mm, slice thickness 4 mm, 224×179x56 matrix [voxel size 2.0×2.0×4.0 mm]).
The liver was manually segmented with ITK-SNAP7 for quantifying liver fat percentage and total liver volume.
Neural Network
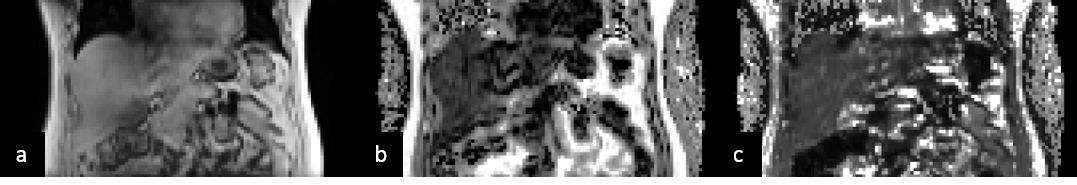
A neural network consisting of MD-GRU layers (freely available online: https://github.com/zubata88/mdgru) and with an on-the-fly data augmentation technique was evaluated for liver segmentation.3,4 The training was performed on 52 (DL52), 20 (DL20), and 10 (DL10) datasets (i.e., 26, 10, and 5 subjects examined twice), and testing on 20 datasets (i.e. 10 subjects examined twice, not included in the training and representing a new cohort). Input to the MD-GRU were first-in-phase echo, fat fraction, T2* (3 contrasts) and liver segmentation (shown in Figure 1), which were downsampled by a factor of 2 (in-plane dimension) to reduce computational complexity.
Data Analysis
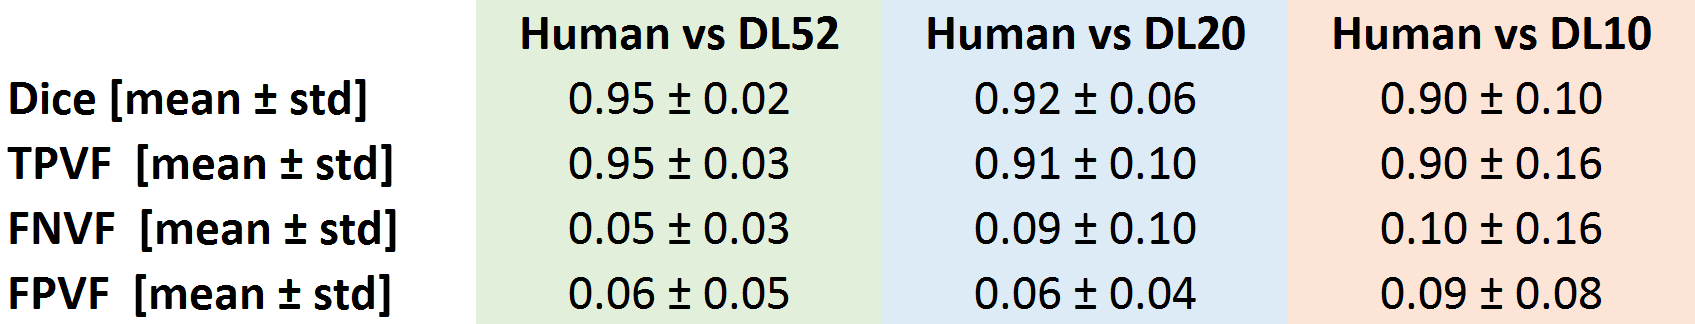
An observer visually scored the number of automatically segmented datasets that were not consistent and would require further refinement for a quantitative analysis of the liver. We calculated dice coefficient, true-positive volume fraction (TPVF), false-negative volume fraction (FNVF), and false-positive volume fraction (FPVF) between the manual segmentation and the automated ones. As main study outcome, we quantified the total liver volume directly from the output segmentation masks and the average liver fat percentage by applying the produced masks to the IDEAL fat fraction maps.
As every patient was scanned at two subsequent timepoints, between which no major change is expected, the mean absolute deviation between these two timepoints was calculated as a reliability test.
Results
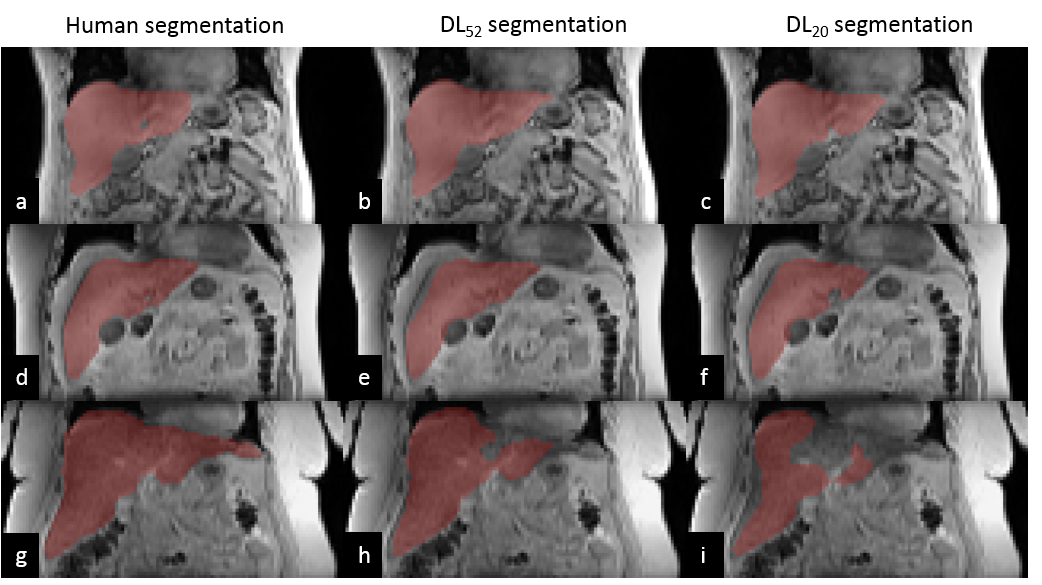
Representative manual and automated segmentations are shown in Figure 2. Qualitatively, for DL52 segmentations were good in 70% of cases (no refinement is needed) and 30% would need very minor refinements (not performed for this study); for DL20, good in 50% of cases, 40% would need minor refinements, and 10% would need large corrections; and for DL10 good in 30% of cases, 60% would need minor refinements and 10% would need large correctionsDice coefficient, TPVF, FNVF, FPVF for the three trained models are presented in Table 1. The dice coefficient for DL52 was 0.95±0.02 (mean±SD), for DL20 0.92±0.06 and for DL10 0.90±0.10. DL52 and DL20 show promising results, while DL10 is not enough accurate.
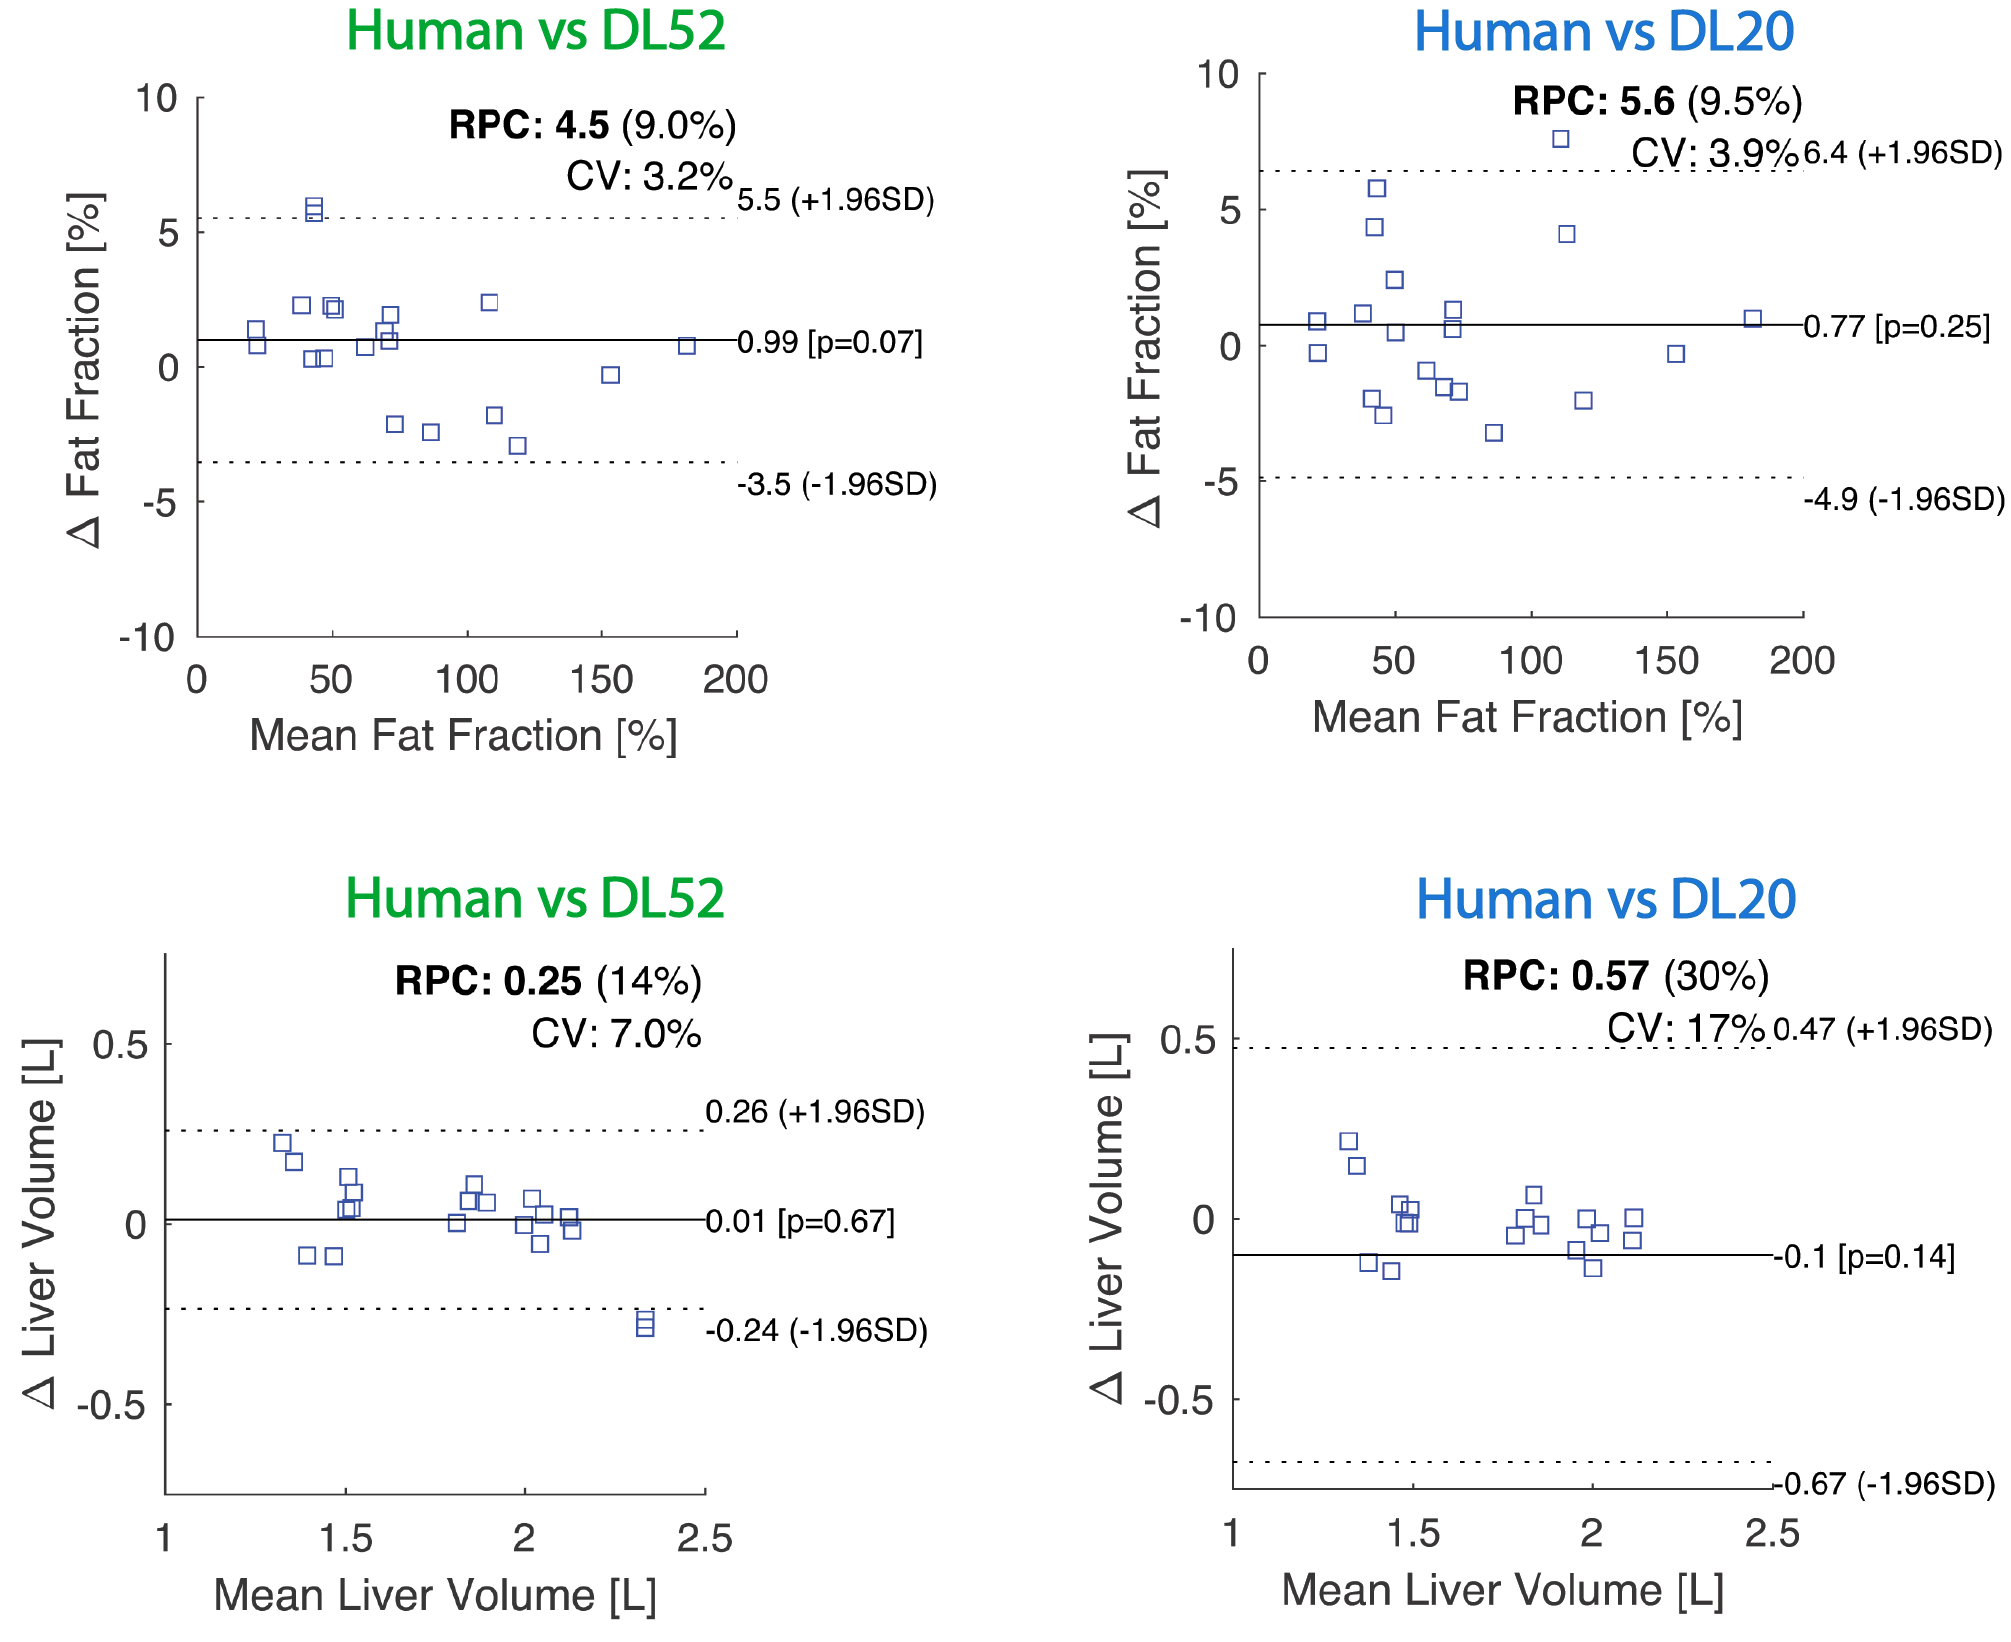
As compared to human segmentation, the average difference in liver volume was 2%±7% (mean absolute error (MAE) 5%) when evaluated with DL52, and -4%±13% (MAE 8%) with DL20. Fat percentage deviated 3%±5% (MAE 4%) with DL51, and 2%±5% (MAE 4%) for DL20 (analysis for DL10 is not presented). The agreement between human and DL on these quantities is visually shown in Figure 3.
The repeatability calculated across the timepoints was good (<2%, relative deviation) and statistically similar for human segmentation, DL52, and DL20.
Discussion and Conclusion
In this work, MD-GRU shows competitive accuracy to other liver segmentations approaches, even using a reduced number of datasets. Interestingly, already with 20 datasets the network can perform a preliminary liver segmentation and might be used for novel studies, e.g. planned with a different imaging setup. Further application of the MD-GRU in the presented cohort of patients will include segmentation of visceral and subcutaneous fat.In conclusion, main outcomes such as liver fat percentage and volume can be evaluated with MD-GRU, reducing the required manual work and increasing the feasibility of routine liver quantitative assessment with MRI.
Acknowledgements
No acknowledgement found.References
1. Kelly T, YangW, Chen CS, et al. Global burden of obesity in 2005 and projections to 2030. Int J Obes. 2008; 32(9):1431–7.
2. Meyer-Gerspach AC, Peterli R, Moor M et al. OBES SURG (2019) 29: 2795. https://doi.org/10.1007/s11695-019-03897-2.
3. Andermatt S, Pezold S, Cattin PC (2016) Multi-dimensional Gated Recurrent Units for the Segmentation of Biomedical 3D-Data. In: Carneiro G. et al. (eds) Deep Learning and Data Labeling for Medical Applications. DLMIA 2016, LABELS 2016. Lecture Notes in Computer Science, vol 10008. Springer, Cham.
4. Andermatt S, Pezold S, Cattin PC (2018) Automated Segmentation of Multiple Sclerosis Lesions Using Multi-dimensional Gated Recurrent Units. In: Crimi A., Bakas S., Kuijf H., Menze B., Reyes M. (eds) Brainlesion: Glioma, Multiple Sclerosis, Stroke and Traumatic Brain Injuries. BrainLes 2017. Lecture Notes in Computer Science, vol 10670. Springer, Cham.
5. LeCun Y, Bengio Y, Hinton G. Deep learning. Nature 2015;521:436–444.
6. Bydder M, Yokoo T, Hamilton G, et al. Relaxation ef-fects in the quantification of fat using gradient echoimaging. Magn Reson Imaging 2008; 26:347–359.
7. Paul A. Yushkevich, Joseph Piven, Heather Cody Hazlett, Rachel Gimpel Smith, Sean Ho, James C. Gee, and Guido Gerig. User-guided 3D active contour segmentation of anatomical structures: Significantly improved efficiency and reliability. Neuroimage. 2006 Jul 1; 31(3):1116-28.
Figures