2591
Detection of Active Brown Adipose Tissue Using Quantitative Susceptibility Mapping (QSM)1Department of Radiology, The Third Affiliated Hospital of Southern Medical University, Guangzhou, China, 2School of Biomedical Engineering, Southern Medical University, Guangzhou, China, 3Philips Healthcare, Guangzhou, China
Synopsis
Activated and inactivated brown adipose tissue showed some differences in function, protein expression and intracellular components, which remained non-invasive MRI testing possible. Despite its strong relevance with iron contents, QSM detect BAT in large lipid depots remains a major challenge. This work proposes a method that use values of QSM and (fat fraction) FF to quantitatively distinguish the two groups in brown adipose tissue depot in vivo, histological validation is then performed. Preliminary results are broadly in line with expectation.
Introduction
Activing brown adipose tissue (BAT) is essential to reduce the risk of obesity and related diseases1. Quantitative susceptibility mapping (QSM) has been previously applied to quantify iron in the central nervous system2. Due to acute cold stimulation can activate brown adipose tissue, significantly increase iron content and UCP-1 expression in BAT3,4, it is possible to detect active BAT using QSM and verify whether it is activated using histological method.. Since activated brown adipose tissue may contain beige fat, the overlap between brown adipose tissue and white adipose tissue, it is not advisable to use FF as an absolute or single indicator for the identification of active brown adipose tissue. This work uses fat fraction (FF) and QSM simultaneously for detecting activated BAT, and the histological quantitative index was taken as the standard following.Methods
Animals: This study was Institutional Review Board approved. The animals used in this study were male Sprague-Dawley rats weighting 200-300g. They were divided into two groups randomly. The rats of control group (n=6) were housed at 22℃ in individual cages with food and water freely available, and with a 12h light/dark cycle. To investigate the effects of acute cold exposure, the rats of another group were placed in a cold room at 4℃ for 12h (cold group, n=6) with the same light/dark cycle and feeding conditions as the main animal room.MRI sequences: A three-dimensional multi-echo gradient-echo sequences on a 7T system (Bruker) using a 4-channel head coil with the following parameters: TR = 50ms; TE1/∆TE/#TE = 1.7ms/1.3ms/10; matrix size =[90 90 60]; voxel size =[0.4mm 0.4mm 0.4mm], flip angle =[20o]. The coronal plane of scapula region was acquired using a respiratory triggered.
The in-phase echoes (2th, 5th, and 8th echoes) was used for calculating initial R2* and field maps. Then, the R2*-IDEAL with the obtained R2* and field maps as initialization was conducted using all echoes to obtain water, fat, R2* and field maps. QSM was calculated from the final field map, and water and fat maps were used for FF calculation. The ROIs were manually drawn on FF images within the BAT of scapula region (Fig. 1), avoiding the surrounding vessel and white adipose tissue. The mean QSM value (ppm) and FF(%) within the defined ROI were calculated, respectively.
Immunohistochemistry: Immunohistochemical staining was followed by a 400-fold image. 5 areas were randomly selected for each slice to take 400-fold images and the expression of UCP-1 positive particles were calculated with intensity optical density (IOD) by using a software (Image Pro Plus 6.0). Take the average IOD of 5 regions as the final result for following analysis.
Results
Compared with that in control group, the semi-quantitative UCP-1 was significantly (P<0.05) promoted in cold group (Table 1). The result of immunohistochemistry staining demonstrated that brown adipose tissue was activated in the cold group (Fig. 2). As compared with those in control group, Both QSM and FF in BAT decreased in cold group (Fig.3 and Table1). There was significant difference between control and cold groups in both QSM (P<0.001) and FF (P<0.001). These demonstrated that both FF and QSM have potential to identify active brown adipose tissue.Discussion and Conclusion
This work utilized FF and QSM to detect active brown adipose tissue in rat in vivo. Both of them showed significant difference between control and cold groups, suggesting that both QSM and FF have the potential to differentiate active and inactive BAT. There is negative correlation between the QSM values, FF and the semi-quantitative UCP-1, however, have no significant all. There are several possible explanations. Firstly, Our sample size is too small to cover all the cases. Secondly, the QSM values can be effected by many factors, such as fat5, blood perfusion and the temperature of the magnetic resonance chamber. One of our weaknesses was that we did not reduce the temperature difference during the scan interval. Thirdly, the activity of BAT varies when the animal from cold environment to room temperature for a long time6.Acknowledgements
The authors acknowledge grant support from National Natural Science Foundation of China (NSFC81801653).References
1. Ong FJ, Ahmed BA, Oreskovich SM,et al.Recent advances in the detection of brown adipose tissue in adult humans: a review[J].Clin Sci,2018,132(10):1039-1054.
2. Wang Y, Spincemaille, Liu Z, et al. Clinical Quantitative Susceptibility Mapping (QSM): Biometal Imaging and Its Emerging Roles in Patient Care. J Magn Reson Imaging.2017;46(6):1-21.
3. Induction of copper and iron in acute cold-stimulated brown adipose tissues[J]. Biochem. Biophys. Res. Commun.2017,488(3).
4. Sebastien M. L , Alexandre C , Inan B,et al.In vivo measurement of energy substrate contribution to cold-induced brown adipose tissue thermogenesis[J]. FASEB J.2015,29(5):1-13.
5. Lin H, Wei H, He N, et al. Quantitative susceptibility mapping in combination with water-fat separation for simultaneous liver iron and fat fraction quantification. Eur Radiol.2018,28(8):3494-3504.
6. Holstila M, Pesola M, Saari T, et al. MR signal-fat-fraction analasis and T2* weighted imaging measure BAT reliably on humans without cold exposure. Metabolism.2017,70:23-30.
Figures
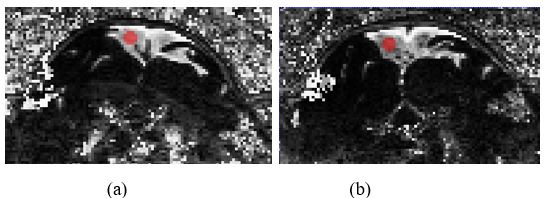
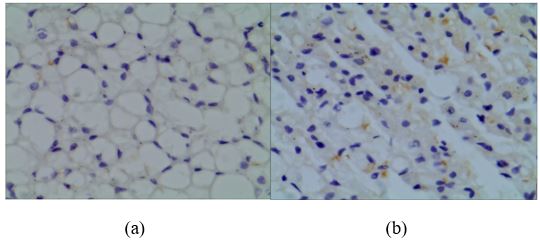
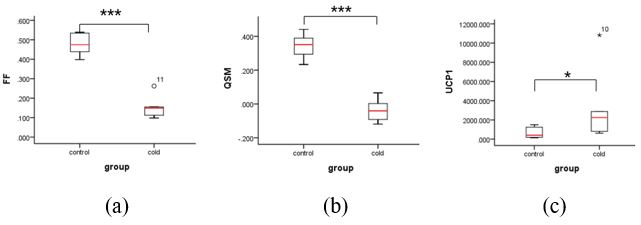
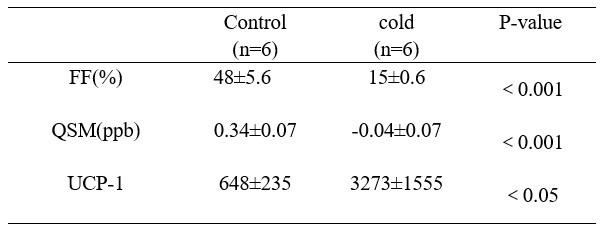
Table1 Characteristics in BAT of rats in the two groups.
Data are presented as mean ± SD.