2590
MRI Application for Autologous Fat Transplantation Assessment1Plastic Surgery Hospital, Chinese Academy of Medical Sciences, Peking Union Medical Collage, Beijing, China, 2Department of Radiology, Peking Union Medical College Hospital, Beijing, China, 3Philips HealthCare, Beijing, China
Synopsis
We have investigated the clinical feasibility of applying MRI to predict the fat survival rate of autologous fat transplantation on faces 7 days after surgery. High resolution T1W and T2W fat-only images, T2 mapping, IVIM diffusion, and spectroscopy methods were implemented. The morphological images provided extradentary value in visualizing transplanted fat in vivo, the biomarker T2 mapping identified edema, IVIM measured perfusion and localized rebuilding vascularization, and MRS quantified lactate content for predicting post-op fat survival rate. The non-contrast MRI technologies proved values in imaging for autologous fat transplantation surgery.
Introduction
Autologous free fat graft is generally applied in plastic surgery, but so far we can hardly predict its outcomes. Previous studies have reported that variables such as edema, early necrosis and final absorption could be discovered in the injected fat on rats or rabbits by histology(1).But no study has been conducted to detect the edema or necrosis in those transplanted fat on humans. However, there is a clinical need to predict post-op results at early stage of recovery. Hence, this study was to evaluate the feasibility of applying MRI to identify possible fat retention and absorption 7 days after surgery(2).Methods
This prospective study was approved by the institutional review board. 10 patients with facial contour deformities who underwent autologous free fat transplantation between August 2019 and October 2019 participated in this MRI study 7 days after surgery. A 3T MR scanner with 32-channel head coil was utilized in this study (Ingenia Elition X, Philips Healthcare, the Netherlands). mDIXON turbos spin echo sequence (TSE) sequences was applied to generate fat-only images along with in-phase and water-only images(3,4). 3D T1W images(0.85×0.85×1mm3) were acquired for fat volume measurement. High resolution multi-slices 2D T1W (0.28×0.349mm²) and 2D T1W(0.400×0.508mm²) were acquired for texture analysis and clearer delineation of transplanted fat. The texture features were extracted in MaZda (Technical University of Lodz, Institute of Electronics). Another 2D T2W TSE sequence with 6 TE (first TE=9.8ms and interval of 13ms) was applied to generate T2 mapping for edema visualization. DWI sequence with TSE readout was applied to acquire distortion free diffusion imaging. Multiple b-value DWI (b=0,1,5,6,10,15,16,25,26,50,51,100,101,200,201,800,801 s/mm²) were used for IVIM imaging(5), which was further analyzed according to bi-exponential model in IntelliSpace Portal (Philips Healthcare, the Netherlands) to extract diffusion coefficient D and perfusion f which indicates micro vascularization.A single voxel spectroscopy method sLASER (semi Localization by Adiabatic SELective Refocusing) was utilized to detect lactate content, which depicts anaerobic metabolism of ischemia due to post operation. The adiabatic refocusing pulses ensured better localization of small ROI near scull and fat by decreasing chemical shift displacement(6,7). TE was set at 144ms to inverted lactate peak measured at 3T. The measurement was repeated for 128 times to enrich SNR for accurate MRS analysis.
Results
The high-resolution fat-only MRI imaging captured the texture difference between the transplanted fat and the original. Signal intensities of grafted fat signal is lower in both T1W and T2W images, so are the signal variations, as an example in Figure 1(a b). Among the features extracted from fat images, the skewness of grafted fat is bigger, while the kurtosis and contrast are smaller. The granulation in the morphological images of injected fat is different comparing to surrounding fat tissue.In addition, we found high resolution T1W images better delineate the transplanted fat from surrounding tissue than T2W images.
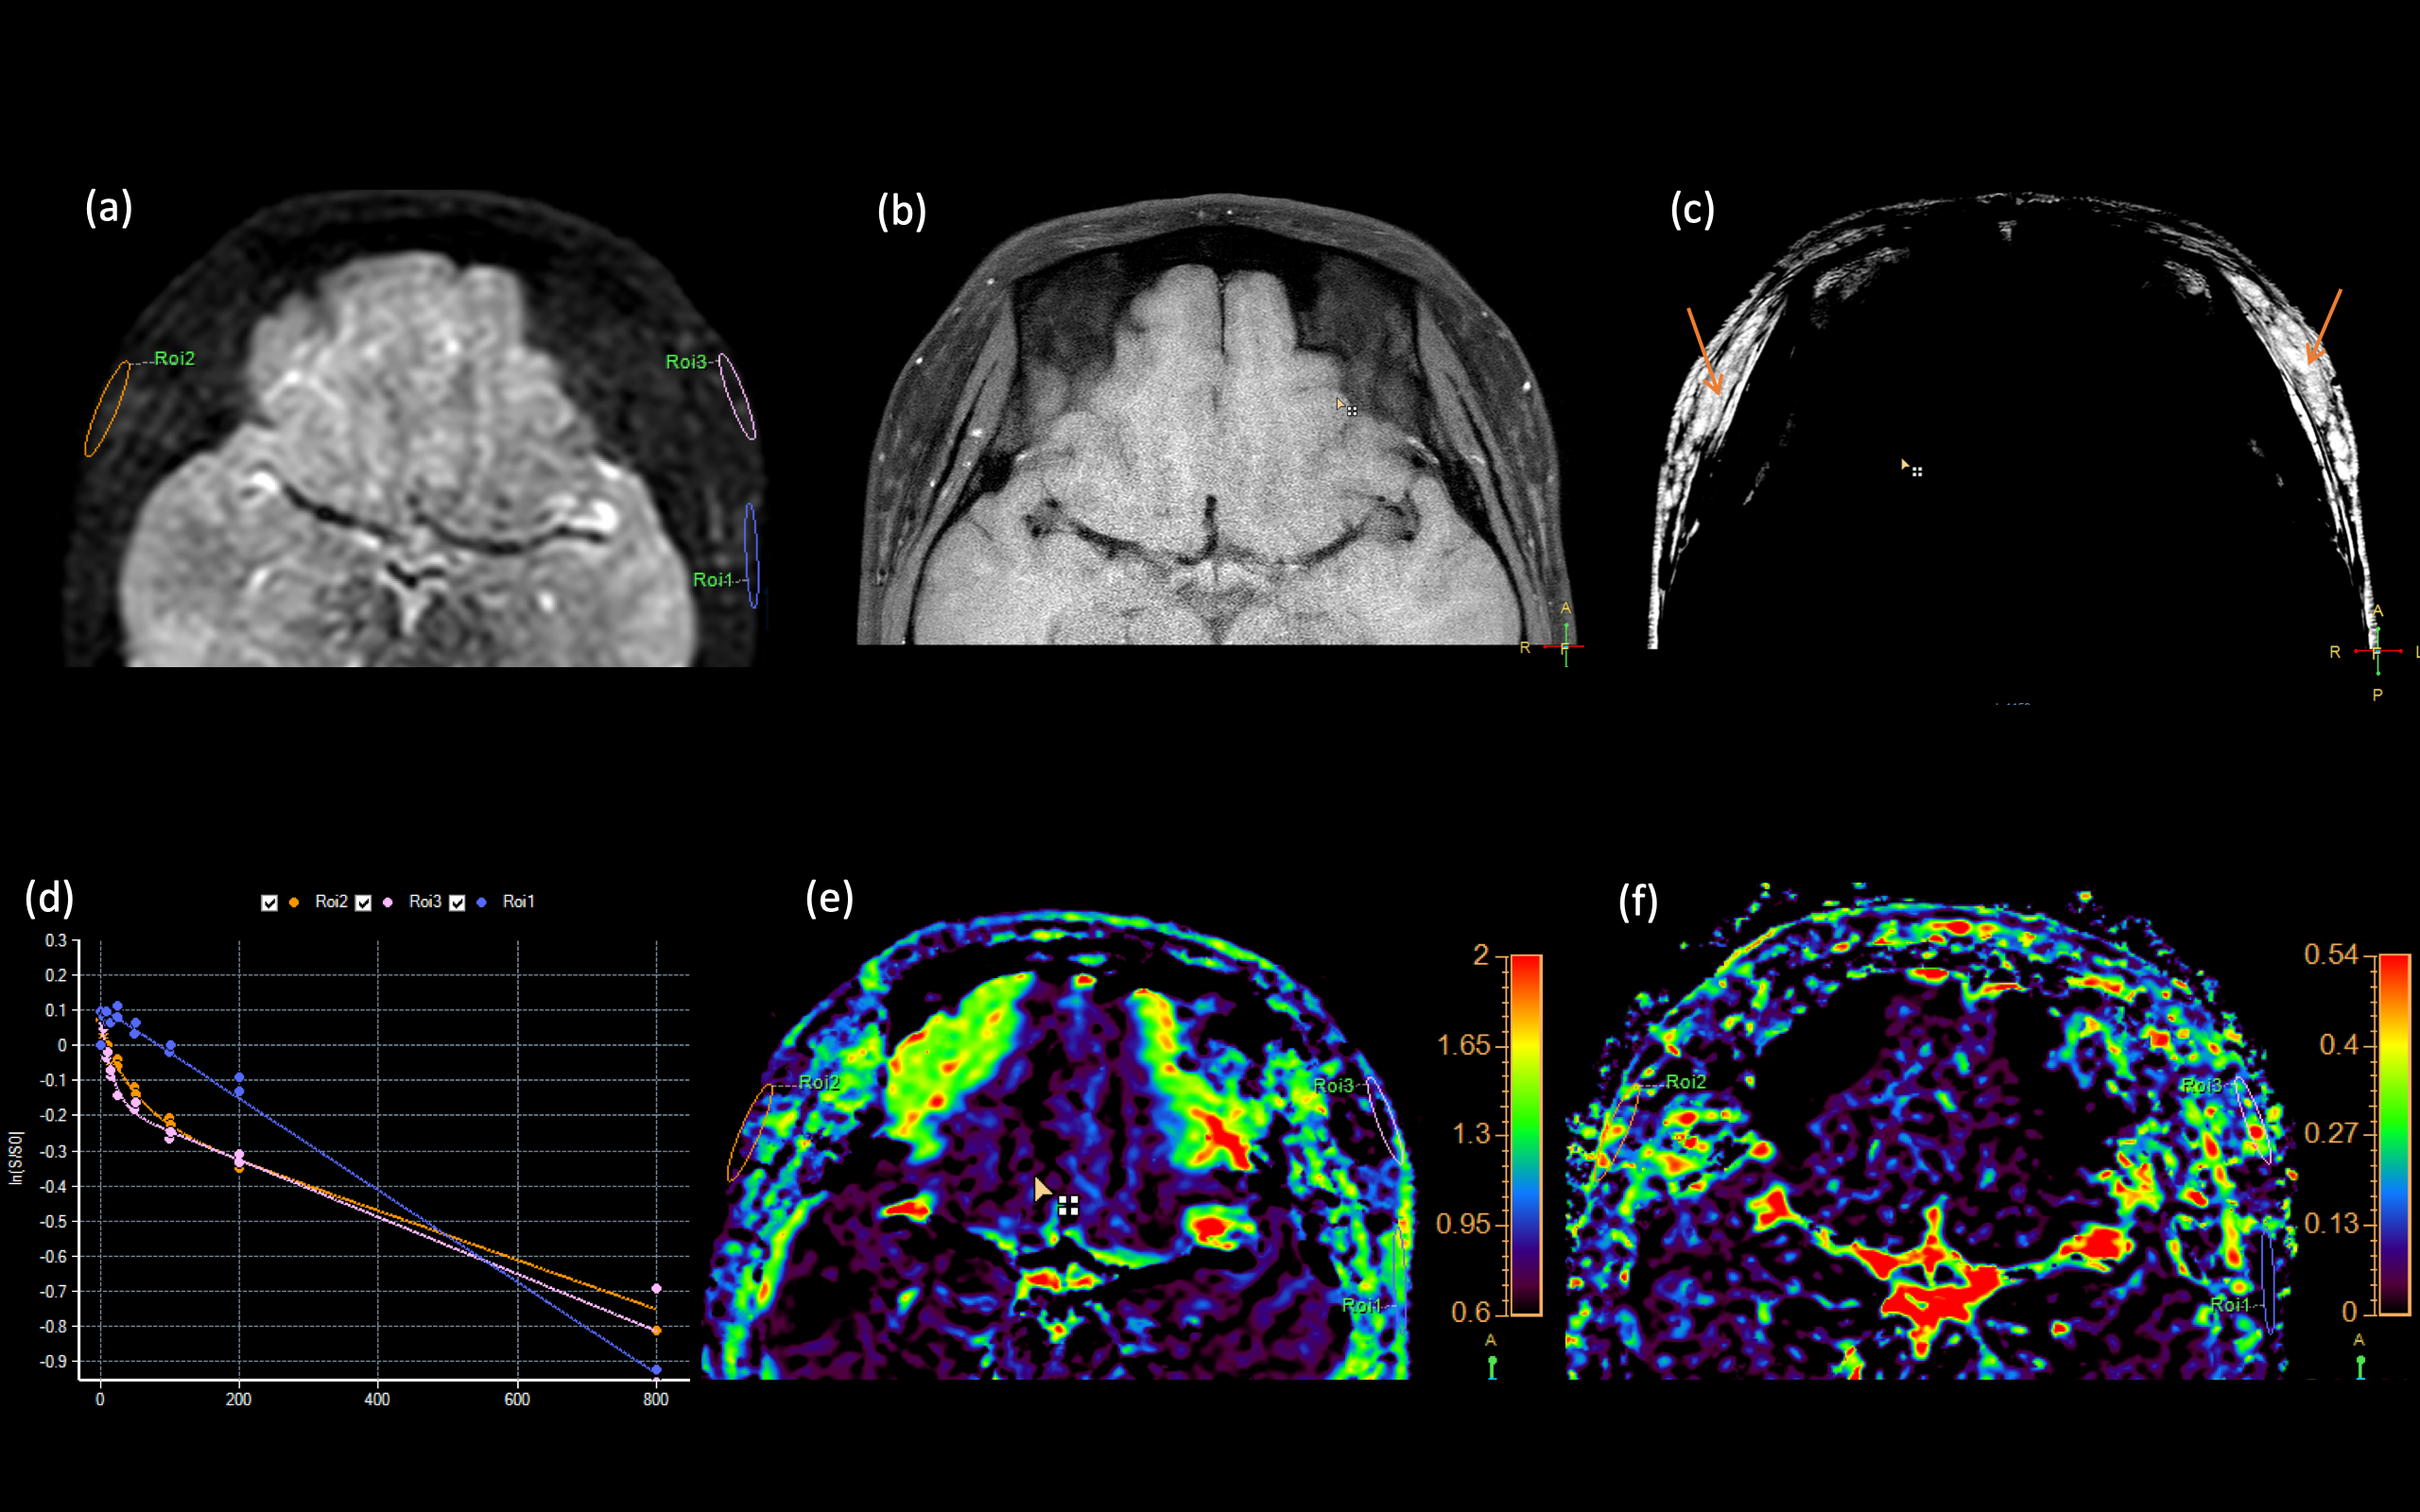
T2 values of the transplanted fat (160±25ms) are significantly higher than normal fat(117±12ms), as shown in Figure 1(c). 2 out of 10 patients complained swelling and pain on the same side of cheek with higher T2.
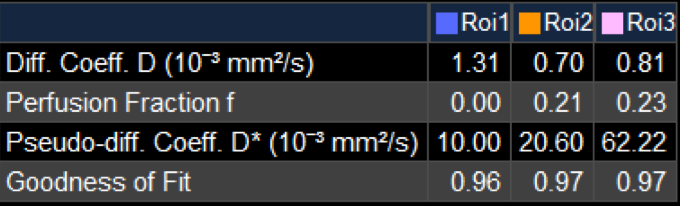
Figure 2(d) shows the diffusion coefficient D in grafted fat (around0.75×10-3mm2/s) is overall less than normal fat(1.3×10⁻³mm2/s) with a diffusive distribution. The perfusion factor f (0.1±0.5ms) is bigger than normal fat (almost 0) and big perfusion f values (bigger than 0.2) are concentrated in some regions inside the transplanted fat as shown in Figure 2(f).
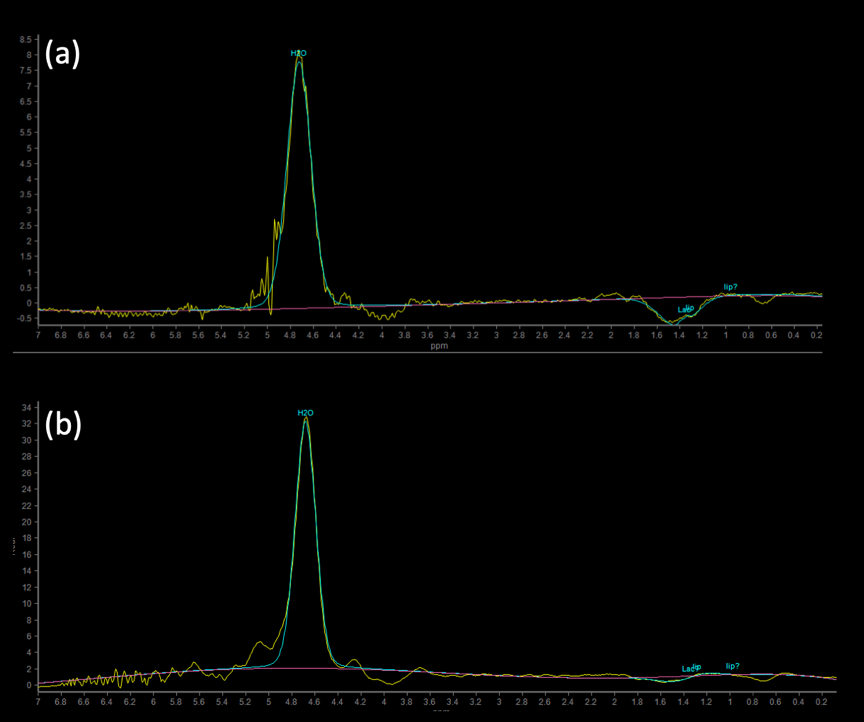
The sLASER MRS method accurately detects the inverted lactate peak, and for the surgery case displayed in Figure 3, the injected fat grafts with significantly higher lactate peaks (Fig 3a) were more absorbed than the other side(Fig 3b) 2 months after the surgery.
Discussion
IVIM perfusion factor f is bigger in parts of grafted fat indicating an ongoing rebuilding vascularization process of the fat tissue, and we found this rebuilding not homogeneous across all transplanted fat tissue. This indicates that injected fat absorption might occur, and a second fat injection would be needed in the grafted fat tissue with lower perfusion measured at 7 days after the surgery. T2 values and lactate content measured in MRS confirmed patients’ discomfort in all cases. These MRI biomarkers for injected fat absorption predictions will be verified by comparing with the clinical outcome, characterized by fat volume, 3 months after surgery.Conclusion
The MRI methods implemented in this study, without contrast media, show promising results in predicting potential survival rate of grafted fat, and this is a major step in solving the unpredictable outcomes for plastic surgeries.High resolution fat-only images can help distinguish grafted fat from normal facial fat, T1W has better contrast in distinguishing transplanted fat and original fat. T2 mapping can effectively detect the edema. IVIM demonstrated the microvascular perfusion and vascular rebuilding process. And the single voxel spectroscopy had a good performance in detecting lactate peak by using sLASER sequence. These non-invasive and non-ionizing radiation imaging methods are considered valuable clinical tools to predict survival rate of autologous grafted fat.
Acknowledgements
We thank our patients for volunteering in the project, and thank the Peking Union Medical College Hospital for administrative assistance and sponsoring this research with MRI scanning sections.References
1) Saunders MC, Keller JT, Dunsker SB, et al. Survival of autologous fat grafts in humans and in mice.Connect Tissue Res. 1981;8(2):85-91.
2) Xie Y, Li Q, Zheng D, et al. Correction of hemifacial atrophy with autologous fat transplantation. Ann Plast Surg. 2007 Dec;59(6):645-53.
3) Dixon WT. Simple proton spectroscopic imaging. Radiology. 1984 Oct;153(1):189-94.
4) Ma J. Dixon techniques for water and fat imaging.J Magn Reson Imaging. 2008 Sep;28(3):543-58.
5) Pang Y, Baris Turkbey, Marcelino Bernardo, et al.Intravoxel Incoherent Motion (IVIM) MR Imaging for Prostate Cancer: An Evaluation of Perfusion Fraction and Diffusion Coefficient Derived from Different b-Value Combinations. Magn Reson Med. 2013 Feb; 69(2): 553–562.
6) Hisao Nakamura, Masatomo Doi, Takuya Suzuki, et al. The Significance of Lactate and Lipid Peaks for Predicting Primary Neuroepithelial Tumor Grade with Proton MR Spectroscopy.Magn Reson Med Sci. 2018 Jul 10;17(3):238-243.
7) Payne GS, deSouza NM, Messiou C, et al, Single-shot single-voxel lactate measurements using FOCI-LASER and a multiple-quantum filter. NMR Biomed. 2015 Apr;28(4):496-504.
Figures