2589
Quantitative sodium imaging of the abdomen1Department of Radiology, University of Cambridge, Cambridge, United Kingdom, 2Department of Radiology, Haukeland University Hospital, Bergen, Norway, 3GE Global Research, Munich, Germany, 4RAPID Biomedical GmbH, Rimpar, Germany, 5Department of Radiology, Cambridge University Hospitals NHS Foundation Trust, Cambridge, United Kingdom
Synopsis
In this study, we report sodium T2* values and total sodium concentration (TSC) values in healthy volunteers in the abdomen using a large field-of-view (FOV) birdcage sodium body coil that provides a uniform excitation over the whole abdomen. We explore whether sodium will be more specific to the BOLD effect, as sodium is a major component of blood and oxygenation of this blood will affect the sodium T2* values directly.
Introduction
Low blood oxygenation can be a primary cause of uncontrollable tumor growth in some cancers1. Blood oxygenation can be measured by the blood oxygenation level dependant (BOLD) effect, which results in the shortening of T2* in the presence of oxygen. Although conventional proton (1H) MRI is used for detecting the BOLD effect, 1H-MRI suffers from signal decay caused by non-uniform magnetic fields. 23Na-MRI can non-invasively detect and quantify tissue sodium levels and can be used to characterize various physiologic and pathophysiologic states not otherwise detectable using standard proton (1H) MRI2,3. We theorize that the lower gyromagnetic ratio of 23Na should not be as affected as 1H by non-uniform macroscopic fields. Sodium is a major component of blood, and deoxygenation of this blood results in the increase of 23Na T2* due to coupling of unshielded iron atoms to the quadrupolar sodium nucleus. Therefore, we explore whether 23Na will be more specific to the BOLD effect than 1H. In this study, we report sodium T2* values and total sodium concentration (TSC) values in healthy volunteers in the abdomen using a large field-of-view (FOV) birdcage sodium body coil that provides a uniform excitation over the whole abdomen.Methods
Imaging was performed with informed consent and approval of the local review board. 23Na images were acquired from three healthy volunteers (1 female) by using a 42 cm diameter birdcage sodium transmit/receive coil (Rapid Biomedical, Rimpar, Germany). A 3D cones trajectory was used to acquire the data. The sequence parameters were: TR = 100 ms, TE = 0.7 ms, flip angle = 70°, voxel size = 4x4x8 mm3, FOV = 48 cm and total scan time = 11:41 mins. To estimate sodium concentrations, two fiducials with sodium concentrations of 40 and 80 mM were placed near the volunteers. Low resolution sodium images were also acquired at six different echo times (TEs = 0.7, 1.5, 2, 4, 8, 16 ms) to estimate the monoexponential 23Na T2* values of different organs in the abdomen. Proton imaging was carried out using the standard proton body coil and a multi-slab breath-hold 3D gradient echo sequence. The in vivo sodium concentrations in different organs ([Na]) were estimated by the following equation which used the signal intensity of the 80 mM sodium phantom as reference: $$ [Na](tissue) = (S(Na, tissue)/ S(Na, reference)) [Na](reference) $$Results
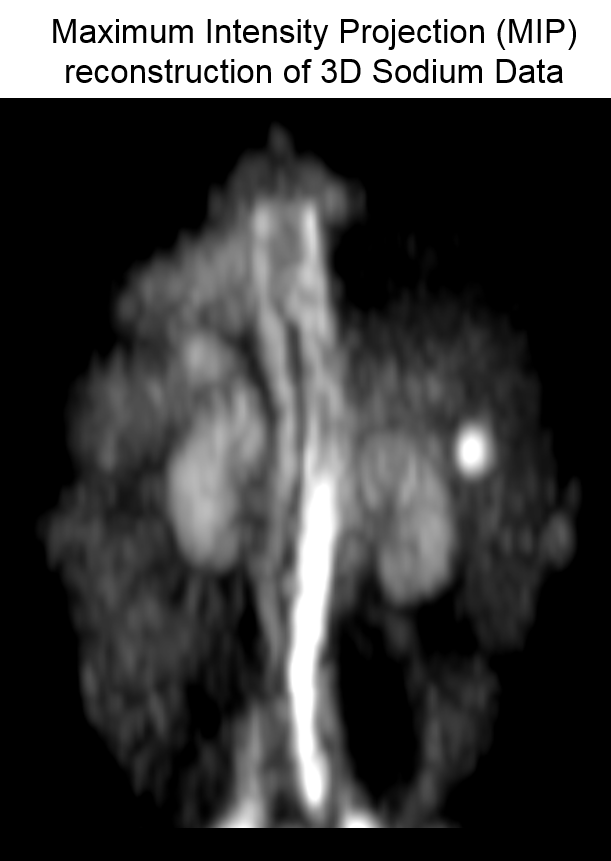
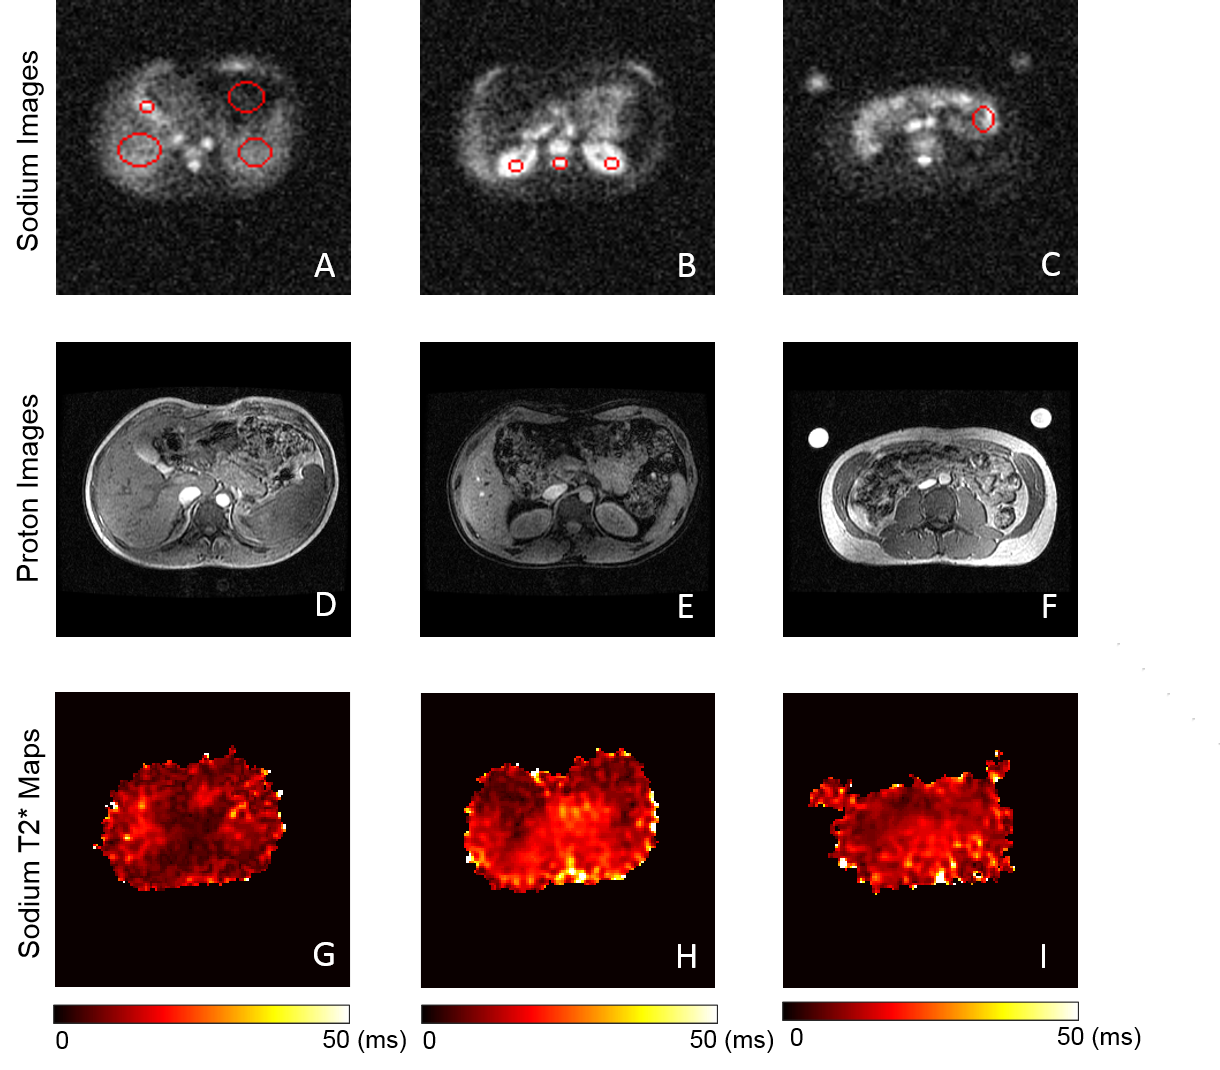
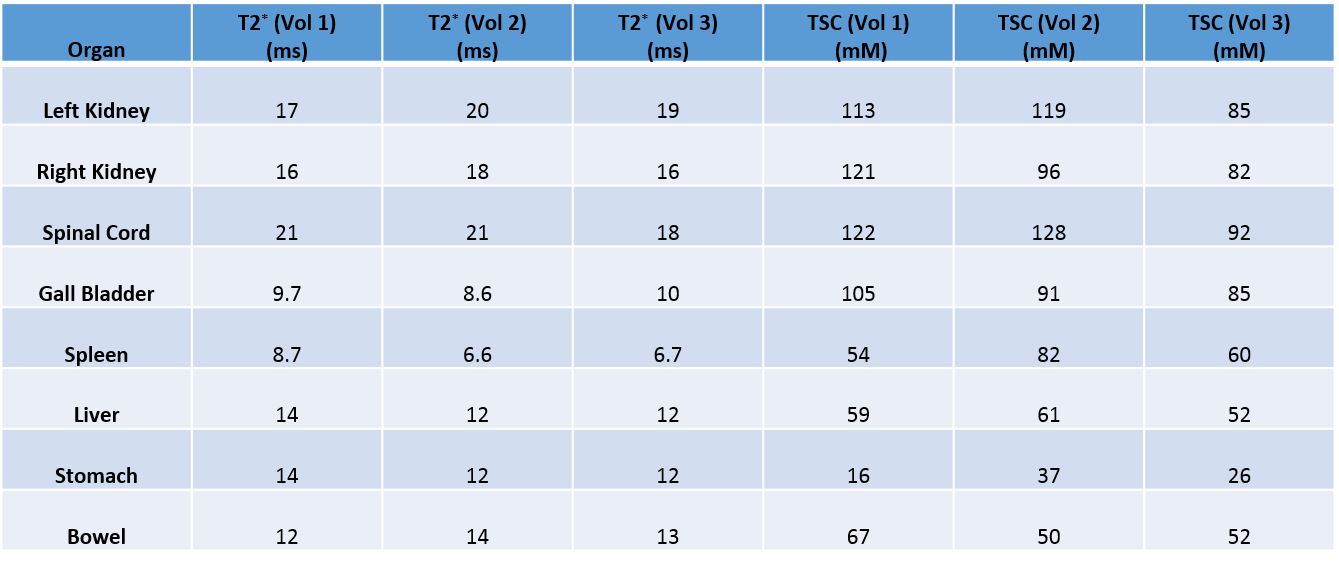
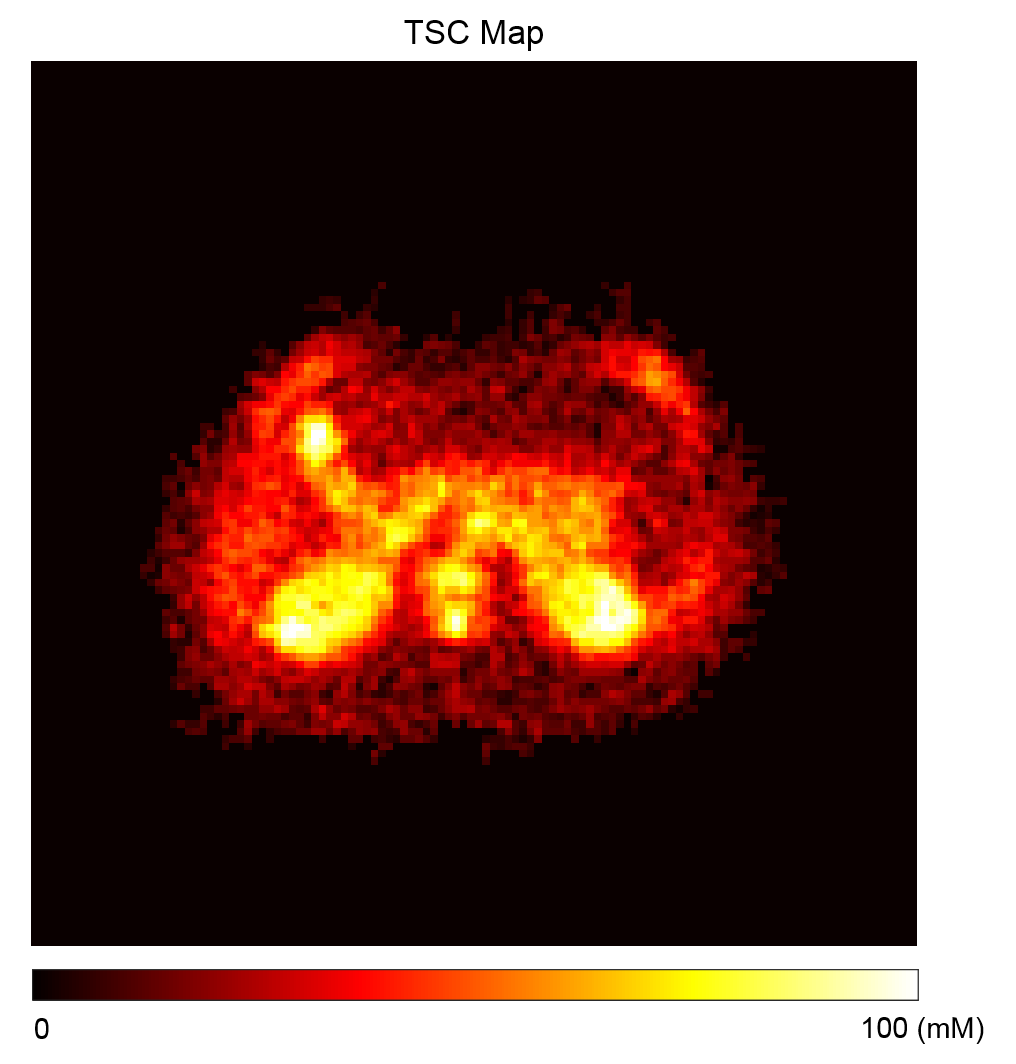
Figure 1 shows the maximum intensity projected (MIP) sodium abdominal image of a healthy volunteer that was acquired using the 3D cones trajectory. Figure 2 A-C shows three axial sodium images of a healthy volunteer along with overlays of the different regions of interest in the abdomen for which sodium T2* and TSC were estimated. Figures 2D-F and 2G-I show the corresponding axial proton images and 23Na T2* maps respectively. Table 1 shows the 23Na T2* values and TSC for three healthy volunteers in eight different abdominal regions. Figure 4 shows a TSC map of an axial abdominal slice for a healthy volunteer.Discussion
The 23Na T2* values from the different abdominal regions of the three healthy volunteers are similar and fall within the range of the long 23Na T2* values previously reported in the literature2. With our mono-exponential fit, T2* in the spleen and gall bladder were short (<10 ms), although the TSC in the gall bladder was very high (~90mM). In general, the TSC in the kidneys and spinal cord were higher than the other organs as expected due to the high presence of blood, urine and cerebrospinal fluid. However, the TSC in the liver was higher than previously reported2 and there is a high variability in TSC in other organs which might be due to partial volume effects. Although two phantoms with TSC of 40 mM and 80 mM were used during imaging, we were only able to use the reference value from the 80 mM phantom for TSC calculations due to SNR issues arising from variations in the placement of the phantom within the sodium coil.Conclusion
We have shown that 23Na T2* values can be estimated in healthy volunteers from different organs in the abdomen using the large FOV sodium birdcage coil. This work should be extended to investigate tumors and chronic kidney disease as blood oxygenation may directly affect the 23Na T2* values in such diseases.Acknowledgements
We would like to acknowledge NIHR Cambridge Biomedical Centre, GlaxoSmithKline, Addenbrooke's Charitable Trust, and Cancer Research UK.References
1. J. Cui, X. Mao, V. Olman, P. Hastings, and Y. Xu, "Hypoxia and miscoupling between reduced energy efficiency and signaling to cell proliferation drive cancer to grow increasingly faster," Journal of molecular cell biology, vol. 4, pp. 174-176, 2012.
2. J. R. James, A. Panda, C. Lin, U. Dydak, B. M. Dale, and N. Bansal, "In vivo sodium MR imaging of the abdomen at 3T," Abdominal imaging, vol. 40, pp. 2272-2280, 2015.
3. R. Ouwerkerk, M. A. Jacobs, K. J. Macura, A. C. Wolff, V. Stearns, S. D. Mezban, et al., "Elevated tissue sodium concentration in malignant breast lesions detected with non-invasive 23 Na MRI," Breast cancer research and treatment, vol. 106, pp. 151-160, 2007.
Figures