2588
Serial Imaging of Splenomegaly in the Sleeping Sickness Infected Mouse1University of Glasgow, Glasgow, United Kingdom
Synopsis
Splenomegaly is a symptom of the African parasitic disease, sleeping sickness. This study is the first research to demonstrate splenomegaly non-invasively in a murine model of sleeping sickness. This researched showed an increase in the size of the spleen of over 20 times the healthy volume during the late stage of the disease whilst also demonstrating a change in the rate of increase during different stages of the disease. Overall, new information about splenomegaly in sleeping sickness has been demonstrated for the first time.
Introduction
Human African Trypanosomiasis (HAT or Sleeping Sickness) is a fatal parasitic disease found in sub-Saharan Africa. As the disease progresses, the parasites proliferate in the blood, lymph and many of the internal organs, including the brain, during the later stages of the disease. Splenomegaly is a known clinical symptom associated with HAT1. Although splenomegaly has been measured by examining the spleen in the literature2, no research has been conducted to examine these changes in-vivo. Therefore, this research uses a well-established and characterised murine model of HAT to assess the changes in spleen volume as the infection progresses using serial MRI in mice.Methods
Female CD-1 mice (n = 5) were scanned on day 0, 7, 14, 21 and 28 post trypanosome infection. Volume T1 FLASH & T2 RARE scans were performed with 30 x 1mm slices, using a custom-made cradle and a 4-channel rat surface coil (Bruker 7T PharmaScan MRI). A ROI was selected around the spleen on each MRI slice (Figure 1) using in-house MATLAB code and the volume calculated. These individual slice volumes were summed to give the volume of the whole spleen. Parasitaemia levels and body weight were assessed and blood samples were taken for analysis at each time point. At the end of the study, spleens were excised, weighed and processed for histology. A second group (n = 5) of uninfected healthy CD-1 mice were scanned and processed in parallel, to determine if any changes in the spleen were caused by serial imaging or bleeding.Results and Discussion
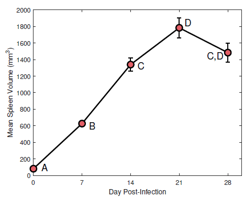
A significant (p<0.05) increase was seen in spleen volume between the first time point (before infection) and all infected points (Figure 1). Both T1 and T2 images demonstrated a clear development of splenomegaly as the infection progressed (Figure 2). The spleen increased from an average volume of 80 mm3 to 1800mm3 at day 21 post-infection. There was no significant difference in the volume between day 14 and 28, and day 21 and 28 post-infection, indicating that splenomegaly changes are not the same in the early and late stages of the disease. No significant difference was seen between the spleen volume in the healthy animals over the experiment, demonstrating all changes were due to the infection. Haematology results for infected animals showed the development of anaemia, demonstrated by a significant decrease in red blood cell counts (p=0.001), haemoglobin concentrations (p=0.002) and haematocrit levels (p=0.009) accompanied by a significant increase in the number of monocytes (p=0.05) and neutrophils (p=0.024). Histology (Figure 3) of infected and healthy spleens saw a distinct loss of splenic architecture with mixing of the red pulp and white pulp for the infected animals. Staining for T cells and B cells showed a large decrease for both.Conclusion
We have successfully imaged splenomegaly development in trypanosome infected mice over the course of a 28-day infection. Although splenomegaly is a recognised symptom in HAT, this is the first quantitative MRI study to measure changes in spleen volume and related haematological parameters serially as the infection progresses, providing crucial insight into the pathogenesis of this parasitic infection.Acknowledgements
I would like to thank for the technician staff at the University of Glasgow for their support in this experiment. I also acknowledge my funding body EPSRC.References
1Kennedy PGE and Rodgers J (2019) Clinical and Neuropathogenetic Aspects of Human AfricanTrypanosomiasis. Front. Immunol. 10:39. doi: 10.3389/fimmu.2019.00039
2Anosa, V. O. and J. J. Kaneko (1984). “Pathogenesis of Trypanosoma brucei infectionin deer mice (Peromyscus maniculatus). Ultrastructural pathology of thespleen, liver, heart, and kidney”. In: Vet Pathol 21.2, pp. 229–37.
Figures


Three stains (H & E, CD3 and Pax5) are shown for a healthy animal (left) and infected animal (right). There was a clear breakdown in the architecture of the spleen in the infected animal, with the T cells becoming more diffuse and a distinct lack of B cells.