2586
Relaxometry and magnetisation transfer to quantify the small bowel wall in healthy volunteers1Nottingham Digestive Diseases Centre, University of Nottingham, Nottingham, United Kingdom, 2Sir Peter Mansfield Imaging Centre, University of Nottingham, Nottingham, United Kingdom, 3Faculty of Applied Medical Sciences, Diagnostic Radiology, Jazan University, Jazan, Saudi Arabia, 4NIHR Nottingham Biomedical Research Centre at Nottingham University Hospitals NHS Trust and University of Nottingham, University of Nottingham, Nottingham, United Kingdom
Synopsis
Quantitative MRI datasets based on relaxometry and Magnetisation Transfer (MT) sequences could be used as potential biomarkers of disease activity in Inflammatory Bowel Disease. The aim of the study was to measure the repeatability of T2, T1 and MT small bowel measurements following bowel preparation and administration of an anti-spasmodic agent. Inter-observer variations in these measurements were also assessed. The quantitative MRI methods examined showed excellent repeatability for T2 and good repeatability for T1 parameters for both repeatability between visits and reproducibility of results between observers from data of a small group of healthy subjects.
Introduction
T2- and T1-weighted sequences are used as disease activity biomarkers in inflammatory Crohn’s disease (CD)(1), with T2-w images showing inflammation as a hyper-intense signal. Magnetization transfer (MT) imaging may have a role in the imaging of fibrosis in CD (2). Quantitative analyses of MRI sequences are increasingly being used for the evaluation of different disease such as CD and liver cirrhosis (3,4) as they provide greater sensitivity to change. T2 and T1 can be measured in the abdomen using spin-echo-prepared (5) or Inversion recovery-prepared sequences (6) with a fast imaging readout and varying the echo time (TE) or inversion time (TI). Evaluating the repeatability of these types of sequence in the bowel is important before embarking on disease-specific outcomes studies. The aim of the study was to measure the repeatability of T2, T1 and MT small bowel wall measurements following bowel preparation and administration of an anti-spasmodic agent in healthy volunteers and assess inter-observer variability of these measurements.Methods
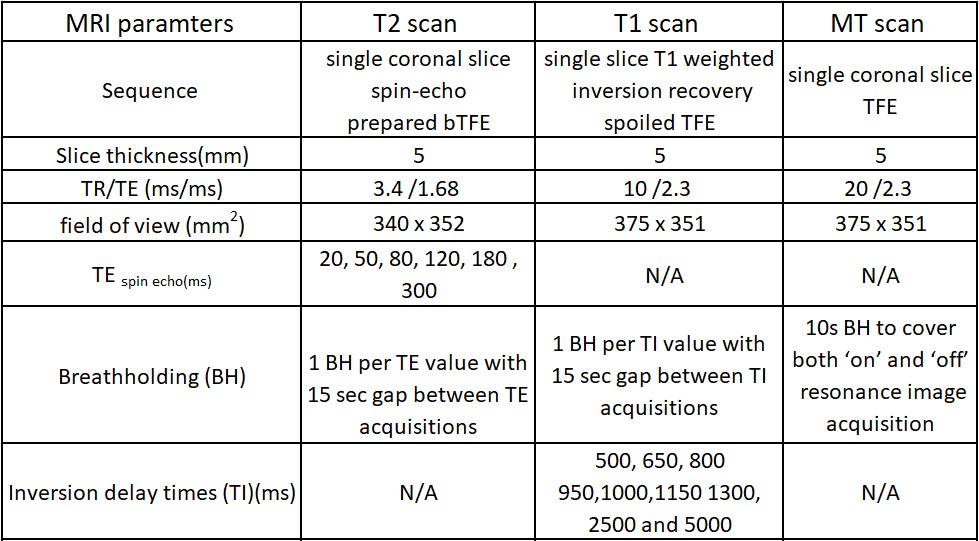
Ten healthy volunteers were recruited and scanned twice with a minimum two weeks interval between visits 1 and 2, using a 3T Ingenia (Philips, Best, The Netherlands). Forty minutes before scanning, volunteers were given 1000 mL of bowel preparation (2.5% mannitol with 0.2 % locust bean gum), to ingest slowly before scanning. After initial planning scans, and prior to these quantitative acquisitions, subjects were given two doses of an anti-spasmodic agent (hyoscine butylbromide 20 mg) intravenously to immobilise the small bowel. One dose was administered before the T2 measurements and the second dose before the T1 and MT scans. Imaging was performed in a feet-first prone position. The MRI sequence parameters for T1, T2 and MT sequences are presented in table 1.All data were motion corrected prior to the wall identification. Regions of interest (ROI) were defined using custom-written software in MATLAB (R2017a, Mathworks) to identify the bowel wall. For T2, the software used a combination of edge detection and thresholding to identify the walls semi-automatically (7). For T1 and MT, the observer drew ROIs on the images to identify small segments of wall. An MT ratio (MTR) image was calculated voxel by voxel after motion correction but prior to the definition of the wall ROIs. The data from the ROIs were then fitted to a model of the signal evolution to calculate the T2 of the ROI taking into account the T2 of the content and partial volume effects. For T1, regions in the small bowel content were fitted for T1 first, and an average of these values used in the T1 fit for the wall, again to allow for partial volume effects in the ROI. Multiple ROIs of bowel wall were drawn on each data set and a median (interquartile range) of the data was then calculated for each subject per visit. The repeatability of these measurements were determined from the intra-class correlation coefficient (ICC) between visits. The data were analysed separately by 2 observers to provide information on the inter-observer variation and the ICC calculated.
Results
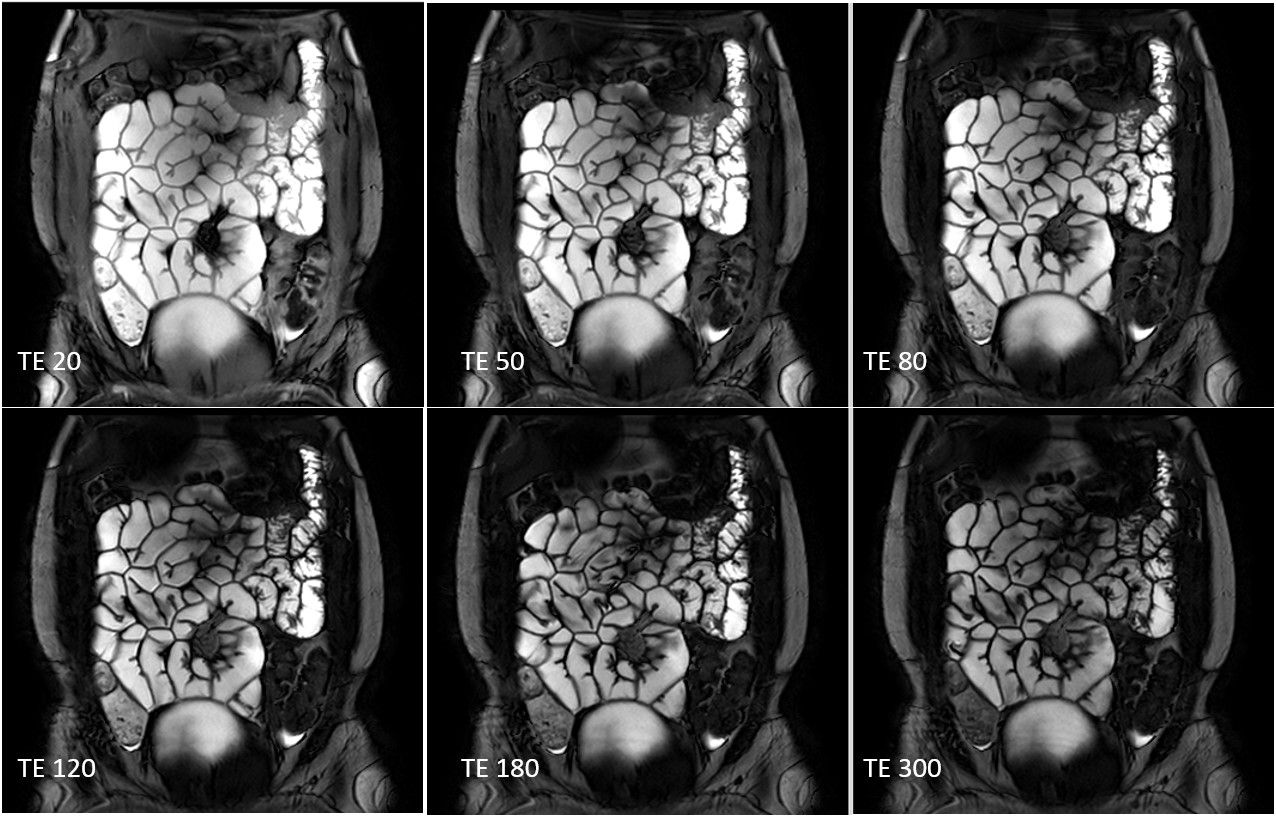
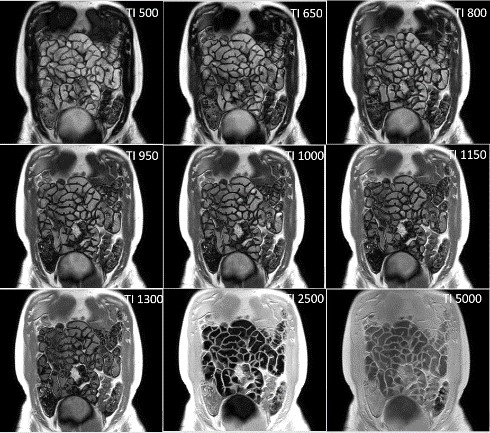
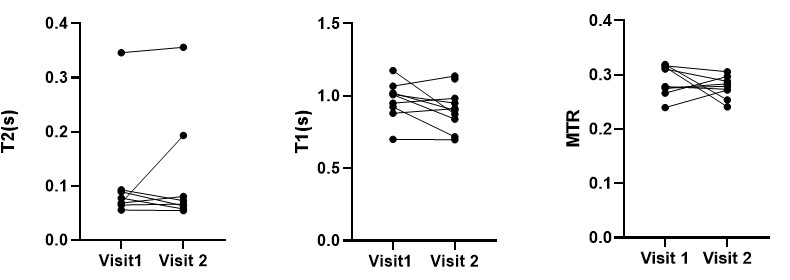
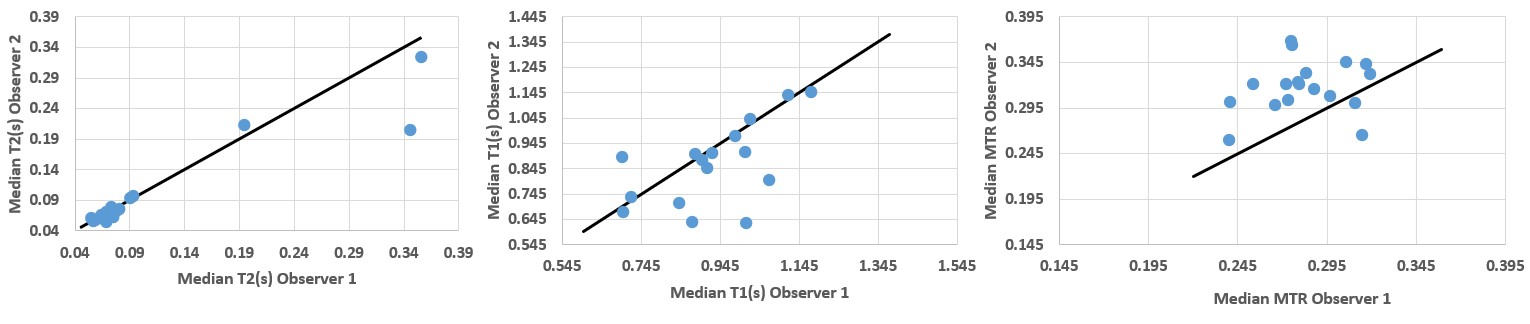
All participants (9 female, 1 male: mean age 30± 8 yrs) completed both scans. Figure 1 and 2 show example images for T1 and T2 data. Some data could not be used in the analysis due to motion of the bowel loops during the acquisition. Figure 3 shows the T2, T1 and MTR median data for each subject at both visits. One subject appeared to have a longer T2 than the rest of the cohort, however this was repeatable over the 2 visits and between the observers for one of the visits. However, an excellent ICC =0.945 was calculated for T2 across visits (p=0.001, N=8), while the T1 data had a good repeatability ICC=0.653, (P=0.05, N=9) the MTR data repeatability had a low ICC=-0.452, (P=0.69, N= 9).Figure 4 shows the inter-observer data. One outlier in the T2 data was observed who had large differences in T2 values, despite this, an excellent correlation (ICC =0.943) between both observers was found for T2 (p value <0.001, N=17). A good correlation was calculated for T1 (ICC =0.716, p=0.006, N=16), and a low ICC was calculated for MTR (0.204, p=0.198, N=18).
Discussion
The paired acquisitions from visit 1 and 2 were well matched within the subjects over the two weeks scan interval for T2 and T1. The inter-observer measurements and scan reproducibility of the T2 measurements was excellent with a strong ICC. The T1 data showed moderate correlation, whilst the MTR data did not correlate well. This may be due to two reasons. The MTR data could not take into account any partial volume effects of the contents in the wall ROIs which may introduce additional errors. Also, the variation of this parameter across the subjects was small with all data within a 0.08 range. Diseased tissue may have considerably different MTR and hence this range of variation may be sufficient for this parameter to also be useful. In conclusion, T2 and T1 of the small bowel are reproducible measurements which may prove to be accurate imaging biomarkers in Inflammatory bowel disease.Acknowledgements
This work was funded by Jazan University, Saudi ArabiaReferences
1. Church, P.C., et al., Systematic review with meta-analysis: magnetic resonance enterography signs for the detection of inflammation and intestinal damage in Crohn's disease. Aliment Pharmacol Ther, 2015. 41(2): p. 153-66.
2. Li X-h, Mao R, Huang S-y, Sun C-h, Cao Q-h, Fang Z-n, et al. Characterization of degree of intestinal fibrosis in patients with Crohn disease by using magnetization transfer MR imaging. Radiology. 2018;287(2):494-503.
3. Li Y, Hauenstein K. New imaging techniques in the diagnosis of inflammatory bowel diseases. Visceral Medicine. 2015;31(4):227-34.
4. Lee Y, Lee SS, Kim N, Kim E, Kim YJ, Yun S-C, et al. Intravoxel incoherent motion diffusion-weighted MR imaging of the liver: effect of triggering methods on regional variability and measurement repeatability of quantitative parameters. Radiology. 2014; 274 (2):405-15.
5. Hoad CL, Cox EF, Gowland PA. Quantification of T2 in the abdomen at 3.0 T using a T2‐prepared balanced turbo field echo sequence. Magnetic Resonance in Medicine: 2010;63(2):356-64.
6. Hoad et al. Abstract 1275 Proc Intl Soc Mag Reson Med 20. 2012.
7. H. Williams et al. Proc ISMRM 2018 p4718
Figures