2585
Multi-parameter assessment of Perianal Crohn’s disease using quantitative MRI: A Multi-centre study.1Nottingham Digestive Diseases Centre, University of Nottingham, Nottingham, United Kingdom, 2Sir Peter Mansfield Imaging Centre, University of Nottingham, Nottingham, United Kingdom, 3Faculty of Applied Medical Sciences, Diagnostic Radiology, Jazan University, Jazan, Saudi Arabia, 4NIHR Nottingham Biomedical Research Centre at Nottingham University Hospitals NHS Trust and University of Nottingham, University of Nottingham, Nottingham, United Kingdom, 5Quantitative Biomedical Imaging Laboratory, Division of Cancer Sciences, University of Manchester, Manchester, United Kingdom, 6Nottingham University Hospitals NHS Trust, Radiology, Nottingham, United Kingdom, 7St Mark's Hospital and London North West Healthcare NHS Trust, Radiology, London, United Kingdom, 8Radiotherapy Related Research, Division of Cancer Sciences, University of Manchester, Manchester, United Kingdom, 9Bioxydyn Limited, Manchester, United Kingdom, 10Centre for Medical Image Computing, University College London, London, United Kingdom
Synopsis
Perianal Crohn’s disease (pCD) is a potential complication of CD patients. Disease monitoring is imprecise due to unreliable clinical scores and subjective radiological reporting. Quantitative MRI sequences, e.g. diffusion-weighted image (DWI), dynamic contrast enhancement (DCE), magnetization transfer (MT) and T2 relaxometry offer opportunities to improve diagnostic capability. This study aimed to attain pilot data regarding the diagnostic utility of these sequences before and after 12 weeks of biological treatment in active pCD. Significant negative correlation was found between MTR and T2, MTR and DCE parameter ktrans and MTR with apparent diffusion coefficient, reflecting competing disease effects of inflammation and fibrosis.
Introduction
Perianal Crohn’s disease (pCD) is a potential complication of Crohn’s Disease (1). Absence of reliable disease measures makes disease monitoring unreliable. Clinical measurements such as Perineal Disease Activity Index (PDAI) and Fistula Drainage Assessment are inaccurate with high inter-observer-variability(2). These indices are therefore questionable when monitoring disease activity after medical therapy. MRI has been increasingly used for diagnosing and monitoring pCD patients and has shown potential for assessing therapeutic response and inflammation. However radiological scoring of features in MR images are also prone to inter-observer variability. Quantitative MRI sequences, such as diffusion-weighted image (DWI), dynamic contrast enhancement (DCE) and magnetization transfer (MT), along with T2 relaxometry, offer opportunities to improve diagnostic capability(3) (4). The aim of this study was to look at how different quantitative parameters correlate in pCD before and after 12 weeks of biological treatment.Methods
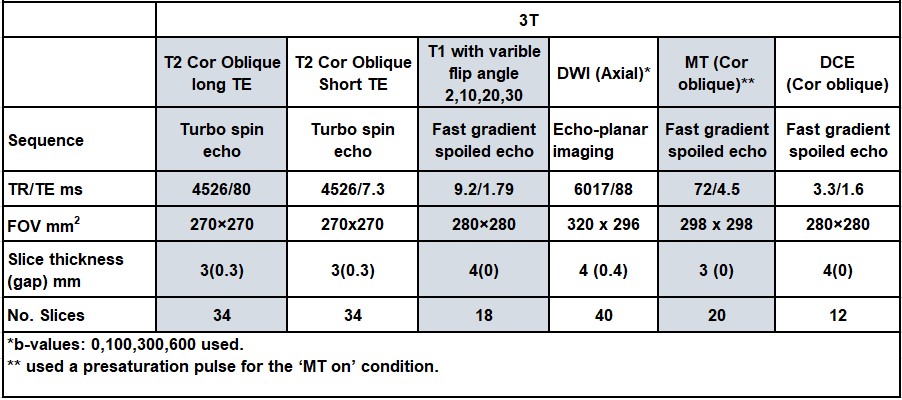
This multicentre study aimed to recruit 25 patients with active pCD. Patients were scanned at 1.5T and 3T on two occasions, once before starting biological therapy, and once after 12 weeks of biological therapy. Only quantitative data from the 3T scanning is presented due to low SNR on the MRI at 1.5 T.DWI, DCE, T1, T2 and MT sequences (parameters in Table 1) were added to the standard clinical protocol of coronal, axial and sagittal T2-weighted turbo spin echo, oblique axial and oblique coronal fat-suppressed T2-weighted and pre/post contrast enhanced -T1 weighted scans. Maps of the apparent diffusion coefficient (ADC) were generated using a mono-exponential decay. MT-ratio (MTR) and DCE maps were generated voxel-by-voxel from the MT and DCE data, respectively. The Extended Tofts Model (ETM) was used to generate the DCE parameters (vascular transfer constant (Ktrans), the volume fraction of the extravascular, extracellular space (Ve), and the volume fraction of the plasma space (Vp)) from the tissue uptake curves. A T1 map was generated from a pre-contrast variable flip angle gradient echo sequence. T2 was calculated from fast spin-echo sequences acquired at 2 different echo times. Diseased tissue regions of interest (ROIs) on MRI scans were identified by consultant GI MRI radiologists (UB, PL, KL, CC; all with > 5 years MRI experience) using the T1 post contrast coronal images. These regions were drawn on the DWI, DCE, MT and T2 raw images and then copied on to the calculated maps using Analyze 9 (Mayo Foundation, USA).
Median data of the voxel values from these regions were calculated. For T2, and MTR a median value of muscle tissue was also acquired for data stability measurements across the 2 visits. Absolute changes of MRI sequences between baseline and 12-weeks follow-up were calculated.
Spearman’s correlation coefficients were used to measure the strength of the relationship between the quantitative MRI parameters MTR, T2, T1, ktrans, ve, vp and ADC across both visits. As the volumes of the diseased tissues were highly variable a weighted linear regression was also applied to the data with square root of the volume of the diseased tissue (measured from the MT sequence) as the weight. Data is also presented split by low and high volume with the median volume used to define the top of the low volume group. Wilcoxon test was used to determine significant changes between visit 1 and visit 2 for all parameters.
Results
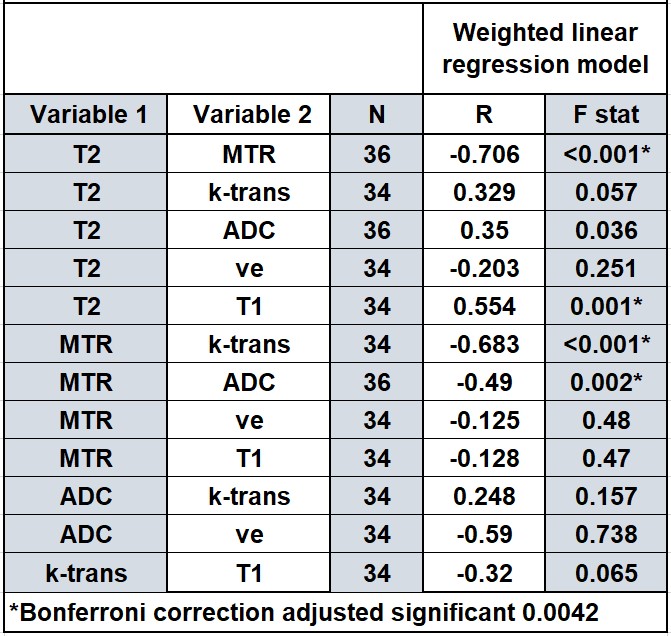
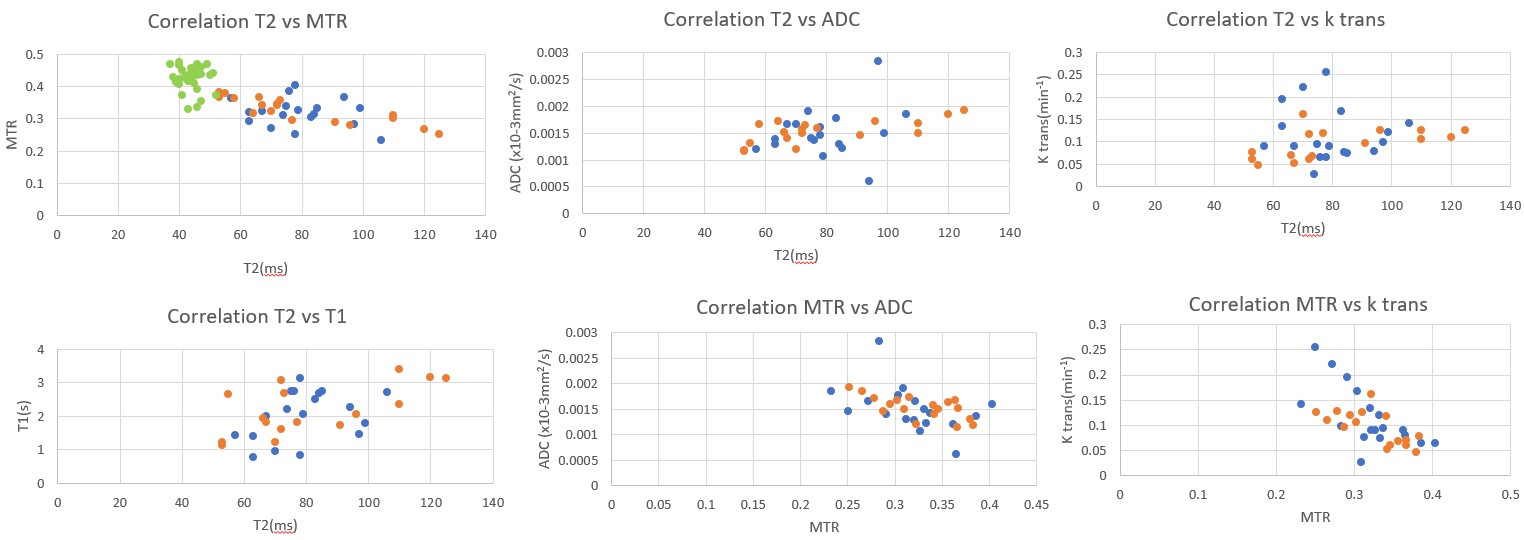
Twenty-five patients (median age 38±14 yrs) were recruited; however, 6 subjects were later excluded. However, six subjects withdrew from the study after the first visit. In addition, of the remaining 19 subjects, one subject was excluded from DCE analyses (adverse reaction to gadolinium) and one from all MRI sequences (poor quality data due to motion).Correlation between MRI parameters are presented in Table 2 with the MTR parameter negatively correlating with several other parameters. Spearman correlation showed the same trends as the linear regression. The scatterplot summarizes these results (Figure1). Figure 2 shows the correlation of absolute change for various MRI parameters between visits.
All MRI parameters were non-normally distributed, median and interquartile ranges (IQRs) are shown in Table 3 with only one significant difference (T1 parameter) noted before and after treatment (Wilcoxon Test).
Discussion
For the majority of MRI parameters, no significant differences after treatment were observed. This may have been due to the heterogeneous response to treatment, small sample size and early assessment at 12 weeks.MTR and T1 are expected to increase with fibrosis, whereas T2 and ktrans are expected to increase with inflammation. ADC can be affected by changes in perfusion and cell size from inflammation and fibrosis. The negative correlation of Ktrans, T2 and ADC with MTR suggests that as tissue inflammation recedes, the residual tissue has a higher MTR response due to the residual fibrosis, or alternatively that the MTR signal is also affected by inflammation. Future analysis will attempt to separate out perfusion effects by restricting the b-values used in the analysis. Further work is now needed at 3T in larger cohorts to validate these initial findings and also scan non-inflamed fistulas as a control group.
Acknowledgements
Jazan University, Medical Research Council Confidence in Concept Funding, NIHR Nottingham Biomedical Research Centre.References
1.Association AG. Gastroenterology. 2003;125(5):1503-7.
2.Rasul I, Wilson SR, MacRae H, Irwin S, Greenberg GR. Clinical and radiological responses after infliximab treatment for perianal fistulizing Crohn's disease. The American journal of gastroenterology. 2004;99(1):82.
3.Siddiqui MR, Ashrafian H, Tozer P, Daulatzai N, Burling D, Hart A, et al. A diagnostic accuracy meta-analysis of endoanal ultrasound and MRI for perianal fistula assessment. Diseases of the Colon & Rectum. 2012;55(5):576-85.
4.Adler J, Swanson SD, Schmiedlin-Ren P, Higgins PD, Golembeski CP, Polydorides AD, et al. Magnetization transfer helps detect intestinal fibrosis in an animal model of Crohn disease. Radiology. 2011;259(1):127-35.
Figures