2578
Correlation between MR DCE quantitative parameters and E-cadherin expression in gastric cancer1Radiology, Affiliated Cancer Hospital of Zhengzhou University, Zhengzhou, China
Synopsis
Multiple MR quantitative parameters are associated with E-cadherin expression, and Ktrans 75% is the optimal parameter to evaluate the invasion of gastric cancer. In addition, our study also determine the specific boundary range of Ktrans 75%, Ktrans mean, and Ve mean to predict whether E-cadherin expression has decreased or absented, which provides a new method to early evaluate gastric cancer invasion.
Introduction
To explore the correlation between MR quantitative parameters and E-cadherin expression in gastric cancer, and the feasibility of MR quantitative parameters in predicting the prognosis of gastric cancer.Method
45 patients confirmed as gastric adenocarcinoma by surgical pathology were enrolled in this prospective study. All the subjects underwent dynamic contrast enhance MRI(DCE-MRI) examination on a 3.0T MR scanner(MAGNETOM Skyra, Siemens Healthcare, Erlangen, Germany). The DCE raw date were post-processed via Omni-Kinetics software package in GE MITK Work bench(GE Medical, China). The MR quantitative parameters Ktrans, Kep, Ve values in mean, 10%, 25%, 50%, 75%, 90% levels were measured. The specimens of tumors were stained with biomarker E-cadherin, and they were divided into negative and normal expression groups. The Mann-Whitney U test or the independent sample t test was used to compare the differences of each MR quantitative parameter between two groups. In the cases that showed statistically significant between two groups, spearman rank correlation analysis was used to compare the correlation between MR quantitative parameter and E-cadherin expression. The receiver operator characteristic(ROC) curve was used to evaluate the diagnostic efficacy of each quantitative parameter, and Yoden index was used to determine the optimal sensitivity and specificity of each quantitative parameter.Result
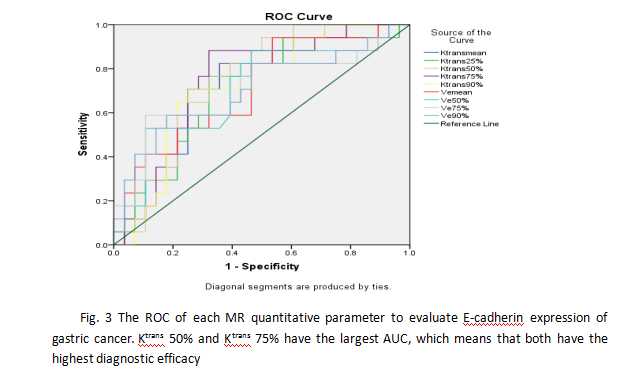
Ktrans mean, Ktrans 25%, Ktrans 50%, Ktrans 75%, Ktrans 90%, Ve mean, Ve 50%, Ve 75%, and Ve 90% shows statistically difference between negative and normal expression groups(P<0.05). All corresponding MR quantitative parameters are negatively correlated with E-cadherin expression, and Ktrans 75% is the optimal parameter to evaluate E-cadherin expression(AUC:0.744, Sensitivity:0.882, Specificity:0.679). When Ktrans 75% value is 0.842 to 0.879, Ktrans mean value is 0.641 to 0.668, and Ve mean value is 0.580 to 0.737, the risk of decreased or absent of E-cadherin expression in gastric cancer will increase.Conclusion
Multiple MR quantitative parameters are associated with E-cadherin expression, and Ktrans 75% is the optimal parameter to evaluate the invasion of gastric cancer. In addition, our study also determine the specific boundary range of Ktrans 75%, Ktrans mean, and Ve mean to predict whether E-cadherin expression has decreased or absented, which provides a new method to early evaluate gastric cancer invasion.Acknowledgements
Thanks to the Department of Pathology of the Affiliated Cancer Hospital of Zhengzhou University.References
1. Bray F, Ferlay J, Soerjomataram I, Siegel RL, Torre LA, Jemal A (2018) Global cancer statistics 2018: GLOBOCAN estimates of incidence and mortality worldwide for 36 cancers in 185 countries. CA Cancer J Clin 68:394-424.
2. Diaz Del Arco C, Estrada Munoz L, Molina Roldan E, Ceron Nieto MA, Ortega Medina L, Garcia Gomez de Las Heras S, Fernandez Acenero MJ (2018) Immunohistochemical classification of gastric cancer based on new molecular biomarkers: a potential predictor of survival. Virchows Arch 473:687-695.
3. Xing X, Tang YB, Yuan G, Wang Y, Wang J, Yang Y, Chen M (2013) The prognostic value of E-cadherin in gastric cancer: a meta-analysis. Int J Cancer 132:2589-2596.
4. Till JE, Yoon C, Kim BJ, Roby K, Addai P, Jonokuchi E, Tang LH, Yoon SS, Ryeom S (2017) Oncogenic KRAS and p53 Loss Drive Gastric Tumorigenesis in Mice That Can Be Attenuated by E-Cadherin Expression. Cancer Res 77:5349-5359.
5. Ryu HS, Park DJ, Kim HH, Kim WH, Lee HS (2012) Combination of epithelial-mesenchymal transition and cancer stem cell-like phenotypes has independent prognostic value in gastric cancer. Hum Pathol 43:520-528.
6. Park JW, Kim M-S, Voon DC, Kim S-J, Bae J, Mun D-G, Ko S-I, Kim HK, Lee S-W, Kim D-Y (2018) Multi-omics analysis identifies pathways and genes involved in diffuse-type gastric carcinogenesis induced by E-cadherin, p53, and Smad4 loss in mice. Molecular Carcinogenesis 57:947-954.
7. Carvalho S, Catarino TA, Dias AM, Kato M, Almeida A, Hessling B, Figueiredo J, Gartner F, Sanches JM, Ruppert T, Miyoshi E, Pierce M, Carneiro F, Kolarich D, Seruca R, Yamaguchi Y, Taniguchi N, Reis CA, Pinho SS (2016) Preventing E-cadherin aberrant N-glycosylation at Asn-554 improves its critical function in gastric cancer. Oncogene 35:1619-1631.
8. Ma L, Xu X, Zhang M, Zheng S, Zhang B, Zhang W, Wang P (2017) Dynamic contrast-enhanced MRI of gastric cancer: Correlations of the pharmacokinetic parameters with histological type, Lauren classification, and angiogenesis. Magn Reson Imaging 37:27-32.
9. Joo I, Lee JM, Han JK, Yang HK, Lee HJ, Choi BI (2015) Dynamic contrast-enhanced MRI of gastric cancer: Correlation of the perfusion parameters with pathological prognostic factors. J Magn Reson Imaging 41:1608-1614.
10. Setia N, Agoston AT, Han HS, Mullen JT, Duda DG, Clark JW, Deshpande V, Mino-Kenudson M, Srivastava A, Lennerz JK, Hong TS, Kwak EL, Lauwers GY (2016) A protein and mRNA expression-based classification of gastric cancer. Mod Pathol 29:772-784
Figures
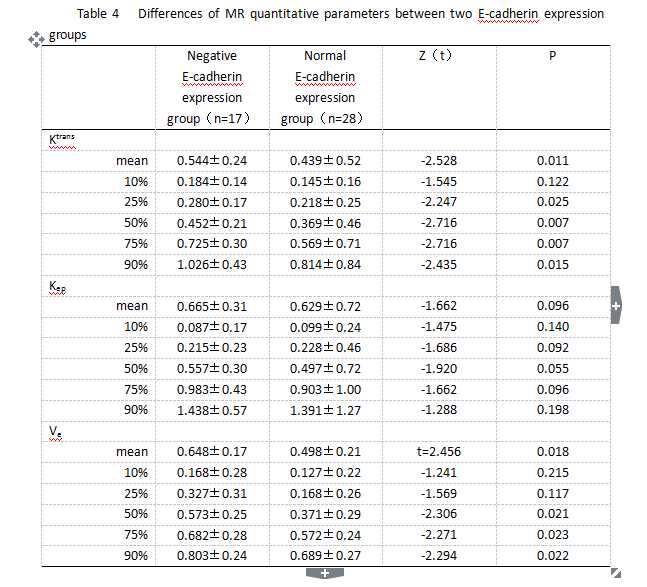
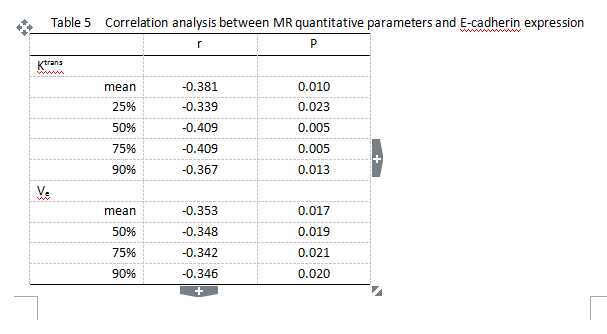

Table 6 Evaluation of the efficacy of E-cadherin expression by MR quantitative parameters
Table 7 Ktrans mean, Ktrans 75%, Ve mean value to evaluate the boundary value of E-cadherin expression in gastric cancer