2575
Comparative analysis of the value of APT and different diffusion models in evaluating the histological features of cervical squamous carcinoma1The First Affiliated Hospital,Xinxiang Medical, Xinxiang, China, 2GE Healthcare, MR Research China, Beijing, China
Synopsis
This study aims to compare the performances of APT, DWI, and DKI in estimating histological grading of cervical squamous carcinoma. We find that the parameter MTRasym of APT and the parameter MK and MD of DKI are helpful for the differentiation diagnosis of cervical squamous cell carcinoma. Compared with DWI and DKI, APT is more effective in identifying the histological grades of cervical squamous carcinoma, and the combination of APT and DWI parameters can greatly improve diagnostic effect.
Introduction
Uterus cervical cancer (UCC) is the fourth most common diagnosed malignancy and the fourth leading cause of malignant-tumor death among women worldwide in 2018.[1] Cervical squamous carcinoma(CSC) is the most common pathological type of UCC. The pathological features of UCC are diagnosed and evaluated clinically by puncture biopsy, but the size of lesions, accuracy of sampling, experience of operators and other factors tend to lead to certain differences between the results and the final pathology, which will affect the choice of patients' treatments and prognosis[2]. Therefore, magnetic resonance (MR) imaging is used as a complementary for CSC grading. Different diffusion models such as Gaussian-distribution based diffusion-weighted imaging (DWI), and Diffusion kurtosis imaging (DKI) based on a probability density function, can non-invasively detect the diffusion motion of water molecules in living tissue, and reflect the microstructure changes of biological. Amide proton transfer imaging (APT) can be used to detect the exchange process between amide protons and water molecules, reflecting the cell metabolism and the pathophysiology. We evaluate and compare the performances of APT, DWI, and DKI in estimating histologic grades of CSC.Materials and Methods
The institutional review board approved this prospective study.From June 2017 to March 2019, 46 patients with CSC confirmed by surgical pathology received MR imaging. They were classified into histologic grades: grade 1 (n = 13), grade 2 (n = 21), and grade 3 (n = 12). The MTRasym, MK, MD, ADC of these three grades were calculated and compared. A Bland-Altman plot was used to evaluate the consistency of the results calculated by 2 experienced radiologists. The Kolmogorov-Smirnov test was used to evaluate whether the measurements were normally distributed. The obtained parameters were compared by one-way analysis of variance with Tukey honest significant difference post-hoc test. ROC curve analysis was used to evaluate the diagnostic performance of these obtained parameters. Spearman correlation analysis was performed to analyze the correlation between these parameters and the grade differentiation of CSC. P<0.05 was considered statistically significant.Results
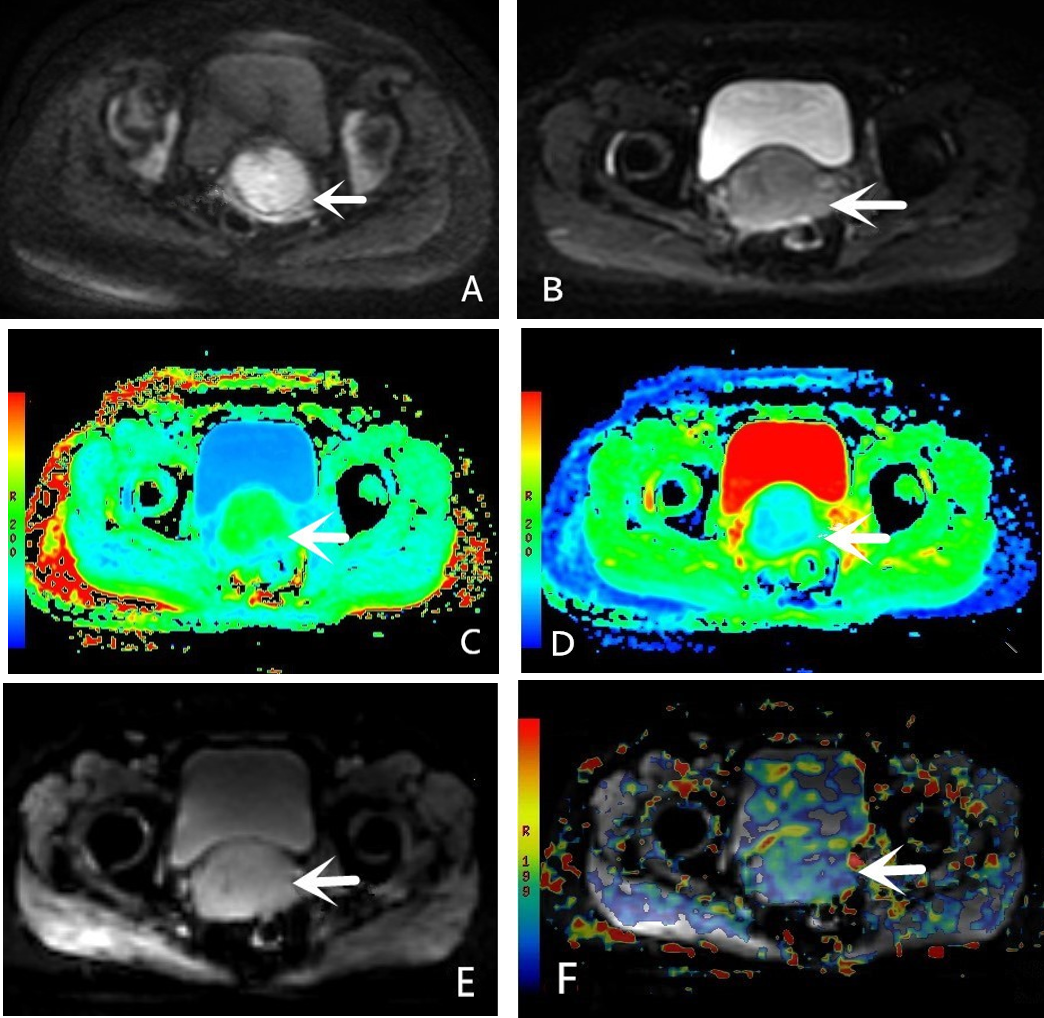
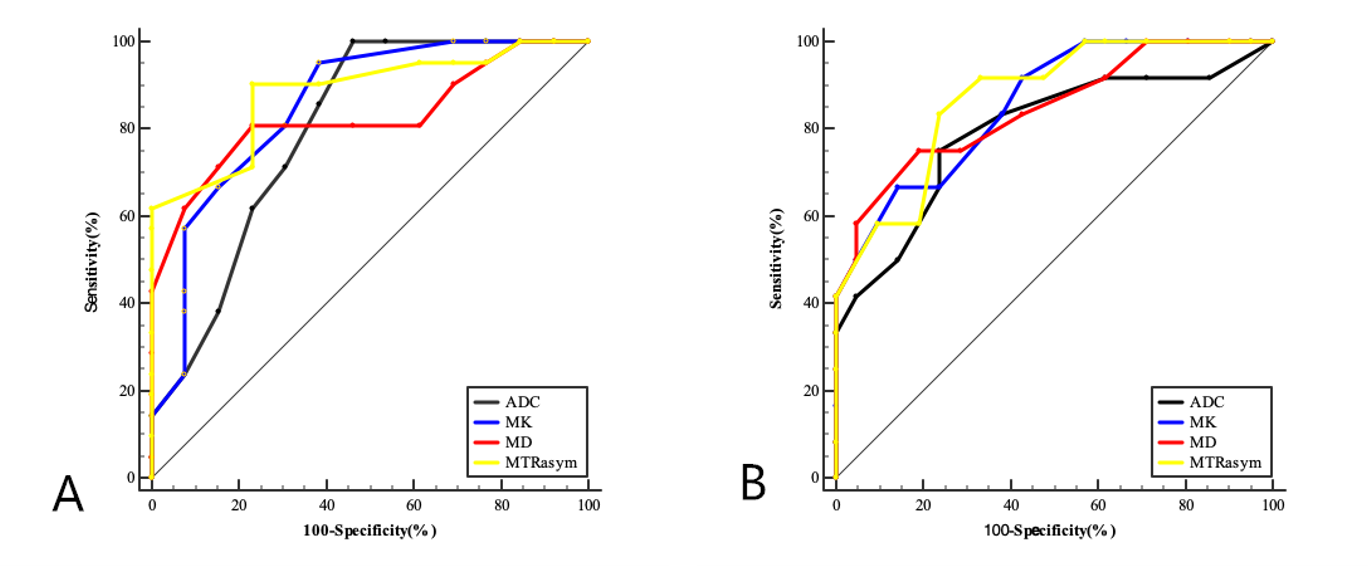
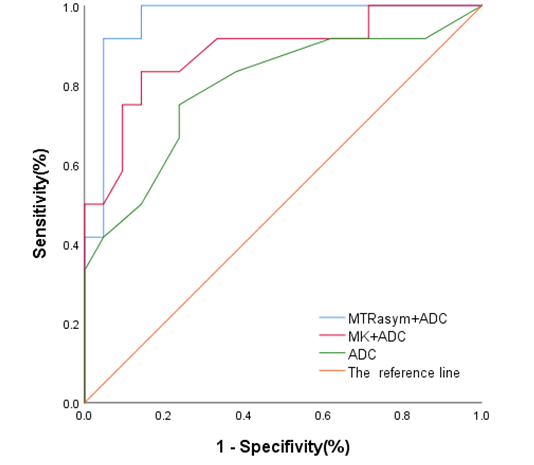
Bland-Altman analysis exhibited that the MK, MD, and ADC values have good inter- observer consistency. The original images generated by the APT,DKI and DWI sequences and pseudo color maps of each parameter are shown in Fig. 1. The MTRasym and MK values for the grade 1, grade 2 and grade 3 groups gradually increased, while the MD and ADC values gradually decreased. The ROC curves of MTRasym,MK, MD, and ADC for identifying different grade groups are shown in Fig. 2. The ROC curves of ADC, the combination of ADC and MTRasym ,the combination of ADC and MTRasym for identifying different grade groups are shown in Fig. 3.The MTRasym values had the highest diagnostic accuracy in differentiating grade 1 and grade 2, and grade 2 and grade 3 (AUC = 0.883, 0.871, P < 0.05), respectively. The AUC of the combination of ADC and MTRasym values was 0.964, higher than the AUC of ADC value (0.794), and the difference between the grade 2 and the grade 3 was statistically significant (P< 0.05). The MK and MTRasym value were positively correlated with pathological grade, while the MD and ADC value were negatively correlated with pathological grade. The MTRasym had the greatest correlation with histological grade, followed by MK, MD and ADC (r=0.789, 0.743, -0.732,-0.644,P<0.01).Discussion and Conclusion
In conslusion, the MTRasym, MK, and MD values of APT and DKI parameters are helpful for the differentiation diagnosis of cervical squamous cell carcinoma. Compared with DWI and DKI, APT is more effective in identifying the histological grading of cervical squamous carcinoma, and the combination of APT and DWI parameters can greatly improve diagnostic effect.Acknowledgements
We acknowledge financial support by the Henan Science and Technology Office of China.References
[1] Bray F, Ferlay J, Soerjomataram I, Siegel RL, Torre LA, Jemal A. Global cancer statistics 2018:GLOBOCAN estimates of incidence and mortality worldwide for 36 cancers in 185 countries. CA Cancer J Clin. 2018. 68(6): 394-424.
[2] Matsuo K, AUID- Oho, Mandelbaum RS, et al. Association of tumor differentiation grade and survival of women with squamous cell carcinoma of the uterine cervix. J Gynecol Oncol. 2018. 29(6): e91.
[3] Kalliala I, Anttila A, Nieminen P, Halttunen M, Dyba T. Pregnancy incidence and outcome before and after cervical intraepithelial neoplasia: a retrospective cohort study. Cancer Med. 2014. 3(6): 1512-6.
Figures