2573
MR Assessment of Blood Flow Rate in Umbilical Vein and Its Correlation with Ultrasound1Department of Radiology, University of Pennsylvania, Philadelphia, PA, United States, 2Department of Bioengineering, University of Pennsylvania, Philadelphia, PA, United States, 3Maternal Child Health Research Center, Perelman School of Medicine, Philadelphia, PA, United States
Synopsis
Intrauterine growth restriction (IUGR) and preeclampsia (PEC) have been associated with increased perinatal morbidity and mortality. Umbilical vein (UV) blood flow reflects the efficiency of fetoplacental circulation. The hypothesis that UV blood flow rate (BFR) is lower in abnormal pregnancies (e.g. IUGR, PEC) was investigated. The results show 1) a high correlation in UV BFR between MR and ultrasound confirms the utility of PC-MRI, and 2) a lower MR-based UV BFR, found in the adverse composite birth outcome group as compared to normal subjects, suggests that UV flow may be a significant clinical indicator of adverse pregnancy outcomes.
INTRODUCTION
Intrauterine growth restriction (IUGR) and preeclampsia (PEC) are two major complications of pregnancy which account for a significant proportion of perinatal mortality and long-term morbidities.1-3 These complications are believed to result from placental dysfunction.4 The umbilical vein supplies the fetus with oxygenated and nutrient-enriched blood.5 A reduction in blood flow rate in the UV could therefore represent an early event in the pathogenesis of IUGR and PEC.6 Phase-contrast magnetic resonance imaging (PC-MRI), as a non-invasive alternative, has been widely applied to reliably obtain blood flow. Although MRI is costlier and not portable like a bedside ultrasound, good soft-tissue contrast and high-resolution detection make MRI feasible for examining potential metabolic abnormalities in pregnancy in vivo. In this study, we 1) report the utility of applying PC-MRI to measure UV blood flow, 2) compare the blood flow rate quantifications with those obtained by US doppler velocimetry, and 3) investigate the hypothesis that UV BFR is lower in pregnancies destined to develop IUGR or PEC compared to their normal counterparts.METHODS
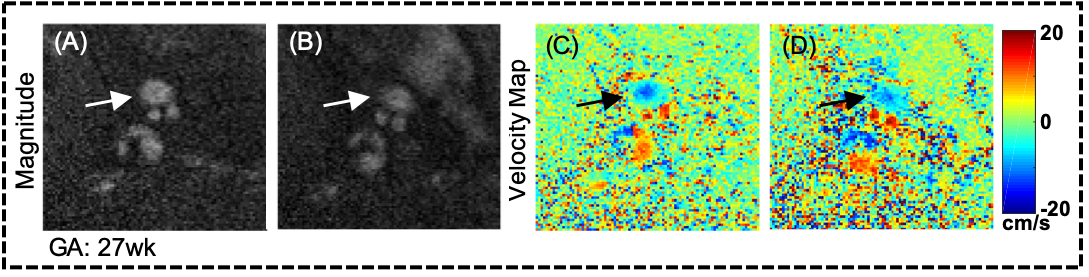
Forty-eight women with singleton pregnancies, gestational age (GA) from 18 to 38 weeks, were recruited in this study. Four subjects were excluded due to no birth outcome, providing 44 subjects in total for group comparisons.A non-gated PC-MRI was performed twice at 1.5T field strength (Siemens Avantofit) using two body matrixes combined with spine coils. Imaging parameters were: 0.625×0.625×5 mm3 voxel size, 25° flip angle, TR/TE= 22.5/7.2 ms, BW= 260 Hz/px, and velocity encoding (VENC)=20/30 cm/s. The lumen areas of the UV in the velocity maps were manually segmented and mean velocities were determined by two ROI-averaged values (Fig. 1). All ultrasound scans were performed by a single operator (NS) using Voluson E10 ultrasound system (GE Healthcare). The inner diameter of a UV was determined as an average of three measurements with the vessels perpendicular to the beam to maximize lateral resolution. The Doppler velocity waveforms were obtained from the center of a straight portion of the UV with the vessel at zero angle to the US beam. Blood peak velocity was measured during fetal quiescence for 2 to 4s. Parabolic flow profile was assumed hence the mean velocity was defined as one-half of the measured peak velocity. The cross-sectional area (CSA) was assumed circular so CSA was calculated as π(diameter/2)2.
Blood flow rate (BFR) in the UV was calculated as the product of mean velocity and CSA. Analysis of covariance (ANCOVA) modelled by BFR, GA and known birth outcome was used to investigate the change in BFR between normal and adverse composite (COMP) groups, with BFR and GA as dependent variable and covariate. Spearman’s correlation and Bland and Altman analysis were computed for parameter association and comparison between PC-MRI and US measurements. Statistics were performed by JMP and an in-house MATLAB script. A P-value < 0.05 was considered as the criterion for statistical significance.
RESULTS
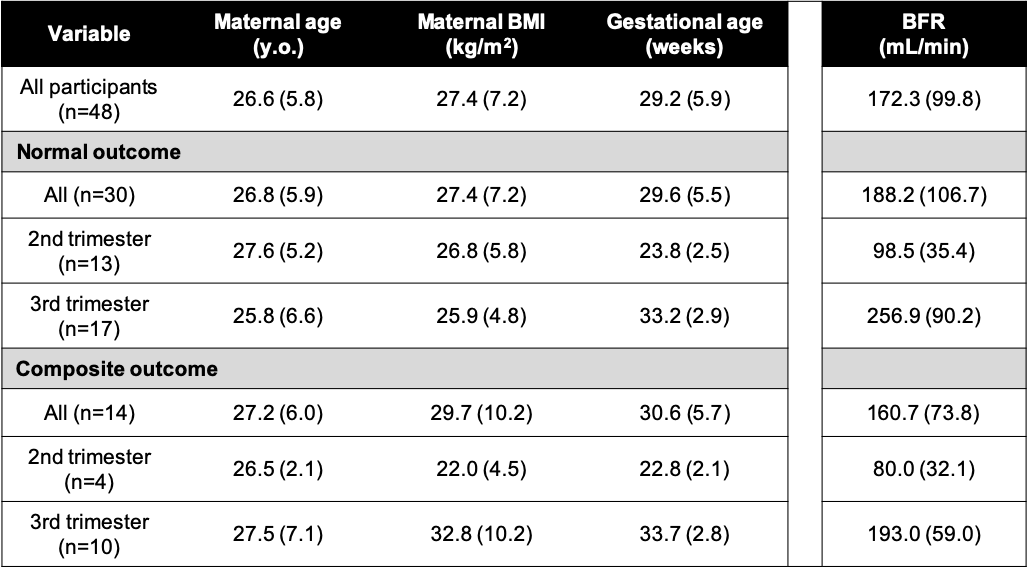
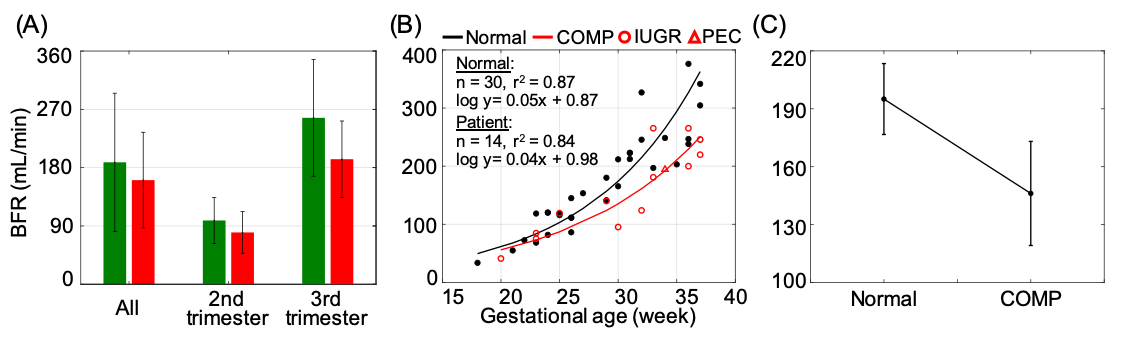
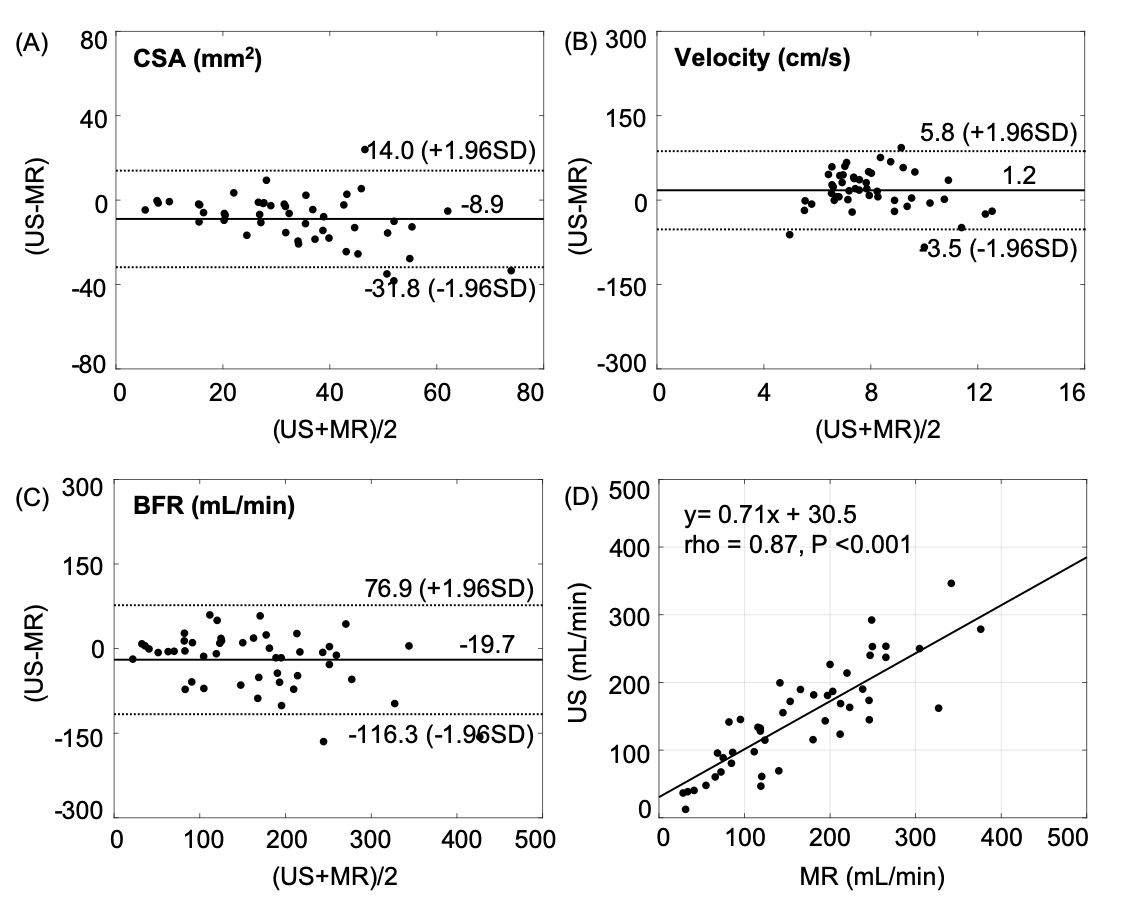
The demographics and BFR in the UV of subjects are summarized in Table 1 (mean±SD: maternal age =26.6±5.8 years, BMI = 27.4±7.2 kg/m2, GA = 29.2±5.9 weeks). Composite outcome was present in 14 (31.8%, with IUGR: 13 (29.5%), PE: 6 (13.6%) PE, both: 5 (11.4%)) subjects. Mean BFR was reduced in the COMP group (normal vs. COMP: 188.2±106.7 vs. 160.7±73.8 mL/min) as it was in the 2nd and 3rd trimester subgroups compared to the normal counterparts (Fig. 2A, Table 1). Further, BFR exponentially increased with GA, with similar GA relationships seen in both normal and COMP groups (normal vs. COMP: logy=0.05x+0.87, rho=0.94 vs. logy=0.04x+0.98, rho=0.88, Fig. 2B). Figure 2C illustrates least-square means with consideration of GA as a confounding factor for BFR, yielding significantly lower BFR in the COMP group compared to the normal outcome group (adjusted means in normal vs. COMP: 195 vs. 146 mL/min, with 95% confidence limit of 18.4 and 27.0 mL/min, respectively; P = 0.004). On the other hand, MR and US (n=48) demonstrated good correlation in CSA measurements although mean values were lower via US compared with MRI (CSA-US: 29.2±13.5 mm2, CSA-MRI: 38.1±18.3 mm2; rho=0.80, P<0.001, Fig. 3A). Correlation was weaker for velocity measurements, with mean velocities being higher using US (velocity-US: 8.6±1.9 cm/s, velocity-MRI: 7.4±2.2 cm/s; rho=0.31, P=0.035, Fig. 3B). Nevertheless, there was an extremely high correlation in UV BFR between US and MRI, with 19.7 mL/min difference (BFR-US: 152.6 ± 81.2 ml/min, BFR-MRI: 172.3 ±99.8 ml/min; rho=0.87, P<0.001, Fig. 3C and 3D).CONCLUSIONS
The results demonstrate the utility of quantifying UV-BFR with PC-MRI, which is less user-dependent than ultrasound and not confounded by the angle of insonation. Although the correlation of CSA and velocity measures between US and MRI were modest, the actual calculated BFR was highly correlated with a similar exponential increase observed with GA using either modality (US data not shown). Further, the study confirms the hypothesis that UV BFR is lower in pregnancies destined to develop IUGR or PEC. Attention to UV flow may yield impactful clinical tools to aid in the prediction of adverse pregnancy outcomes and the management of at-risk pregnancies. In conclusion, PC-MRI not only provides better morphological information with good soft-tissue contrast but also practical surveillance of UV blood flow rate for fetoplacental circulation.Acknowledgements
This work was supported by the National Institutes of Health (U01 HD087180).References
1. Sibai, B., G. Dekker, and M. Kupferminc, Pre-eclampsia.Lancet, 2005. 365(9461): p. 785-99.
2. Berends, A.L., et al., Shared constitutional risks for maternal vascular-related pregnancy complications and future cardiovascular disease.Hypertension, 2008. 51(4): p. 1034-41.
3. Arcangeli, T., et al., Neurodevelopmental delay in small babies at term: a systematic review.Ultrasound Obstet Gynecol, 2012.40(3): p. 267-75.
4. Longtine, M.S. and D.M. Nelson, Placental dysfunction and fetal programming: the importance of placental size, shape, histopathology, and molecular composition.Semin Reprod Med, 2011. 29(3): p. 187-96.
5. Salavati, N., et al., The relationship between human placental morphometry and ultrasonic measurements of utero-placental blood flow and fetal growth.Placenta, 2016. 38: p. 41-8.
6. Di Naro, E., et al., Longitudinal umbilical vein blood flow changes in normal and growth-retarded fetuses.Acta Obstet Gynecol Scand, 2002. 81(6): p. 527-33.
Figures