2572
Longitudinal Study of T2*-based BOLD Placental MRI in Obese Pregnant Human Subjects1Biomedical Engineering, University of Wisconsin-Madison, Madison, WI, United States, 2Radiology, University of Wisconsin-Madison, Madison, WI, United States, 3Integrative Biology, University of Wisconsin-Madison, Madison, WI, United States, 4Medical Physics, University of Wisconsin-Madison, Madison, WI, United States, 5Emergency Medicine, University of Wisconsin-Madison, Madison, WI, United States, 6Medicine, University of Wisconsin-Madison, Madison, WI, United States, 7Obstetrics and Gynecology, University of Wisconsin-Madison, Madison, WI, United States, 8Electrical and Computer Engineering, University of Wisconsin-Madison, Madison, WI, United States
Synopsis
Maternal obesity is associated with increased risk of gestational hypertension, preeclampsia and fetal growth restriction, complications related to reduced uteroplacental blood flow and placental vascularity malformation. T2* measurements of blood oxygen level-dependent effects have promise for assessing placental function. Here, we measured placental T2* in non-obese and obese pregnant women at 14 and 20 weeks of gestation. Our study showed that the range of placental T2* is similar between the two populations at both gestation ages. Trends of decreased and increased placental T2* with gestation were observed in different subjects, suggesting longitudinal changes in placental T2* may vary among subjects.
INTRODUCTION
Placental function depends on adequate uteroplacental and fetoplacental blood flow and oxygen extraction across the placental tissue. Maternal obesity is associated with increased risk for hypertension and preeclampsia with resulting vascular malformation and reduced placental blood flow, leading to fetal growth restriction1. Thus, in-vivo assessment of placental function, particularly in early gestation, is of great research and clinical interest. T2* mapping-based measurements of blood oxygen level-dependent (BOLD) effects have shown promise for assessing placental health and predicting pregnancy outcomes2,3,4. The purpose of this work was to assess longitudinal changes in placental T2* in non-obese and obese pregnant women.METHODS
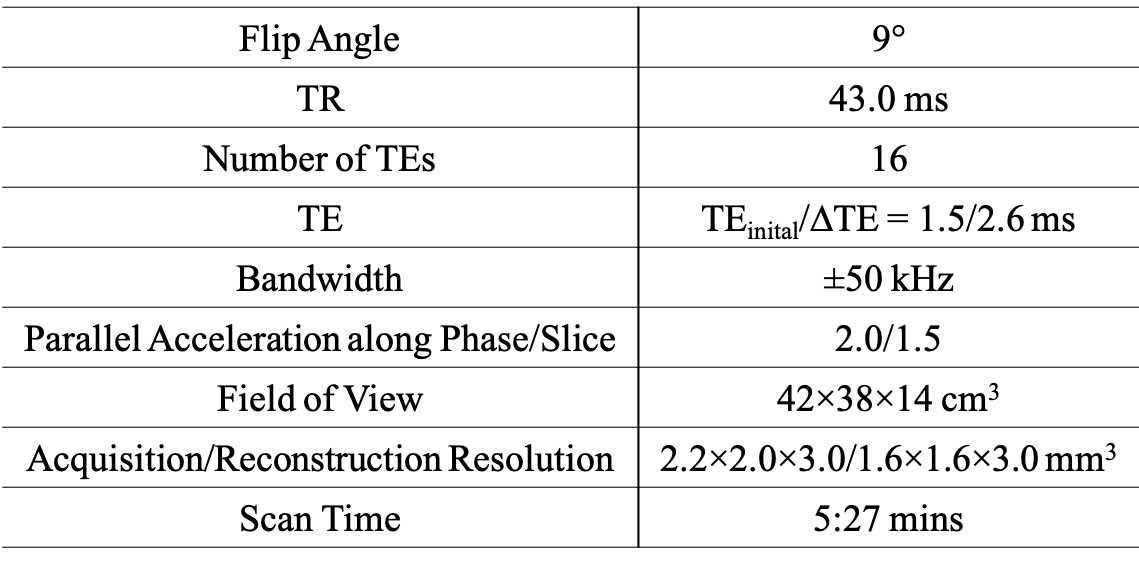
Subjects: In this IRB-approved study, pregnant women with singleton pregnancies were recruited and scheduled for MRI at 14 and 20 weeks of gestation. Subjects with a body mass index (BMI) above 30kg/m2 were considered as obese.MRI Acquisition: MRI scans were performed on a wide-bore 1.5T MRI system (Optima MR 450w, GE Healthcare) using a 48-channel phased-array coil (GEM Suite) with subjects in the supine position. A respiratory-gated 3D multi-echo spoiled gradient-echo acquisition (Table 2) covering the entire uterus cavity was obtained for T2* mapping.
Data Reconstruction and Analysis: T1-weighted anatomic images and T2* maps of each dataset were reconstructed by using monoexponential fit of complex echo images. Image quality and diagnostic acceptability were evaluated using a 5-point Likert scale. Scores 1 to 2 were considered as non-diagnostic image quality and excluded from the quantitative analysis. Scores 3 to 5 were considered as diagnostically acceptable. Images were evaluated in OsiriX (Pixmeo SARL, Switzerland) by a radiologist with 9 years of experience in clinical MRI. 3D placental contouring was performed on the T1-weighted anatomic image using ITK-SNAP5. Additionally, a ~3cm2 circular region-of-interest was drawn in the gluteal muscles to measure and track the longitudinal muscle T2*.
RESULTS
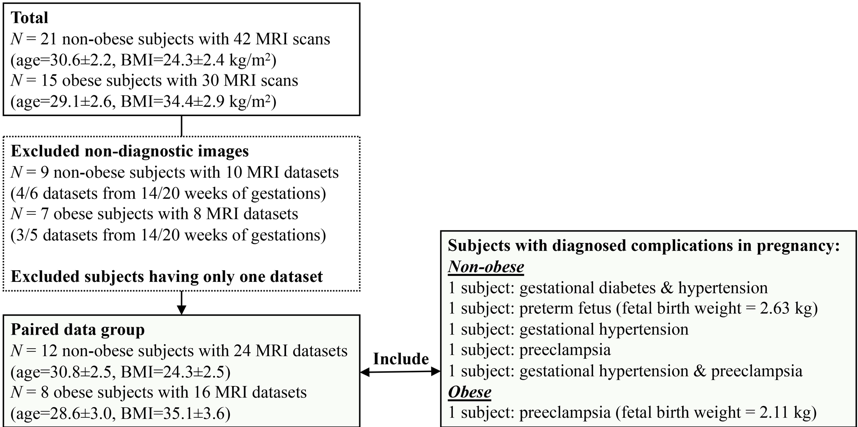
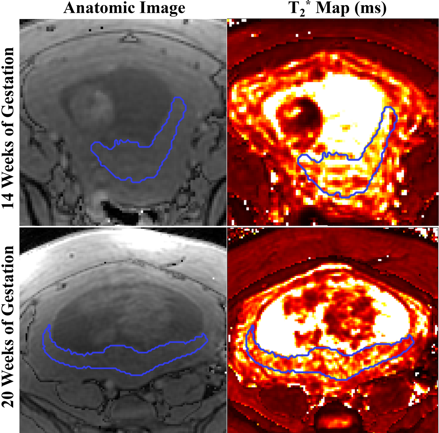
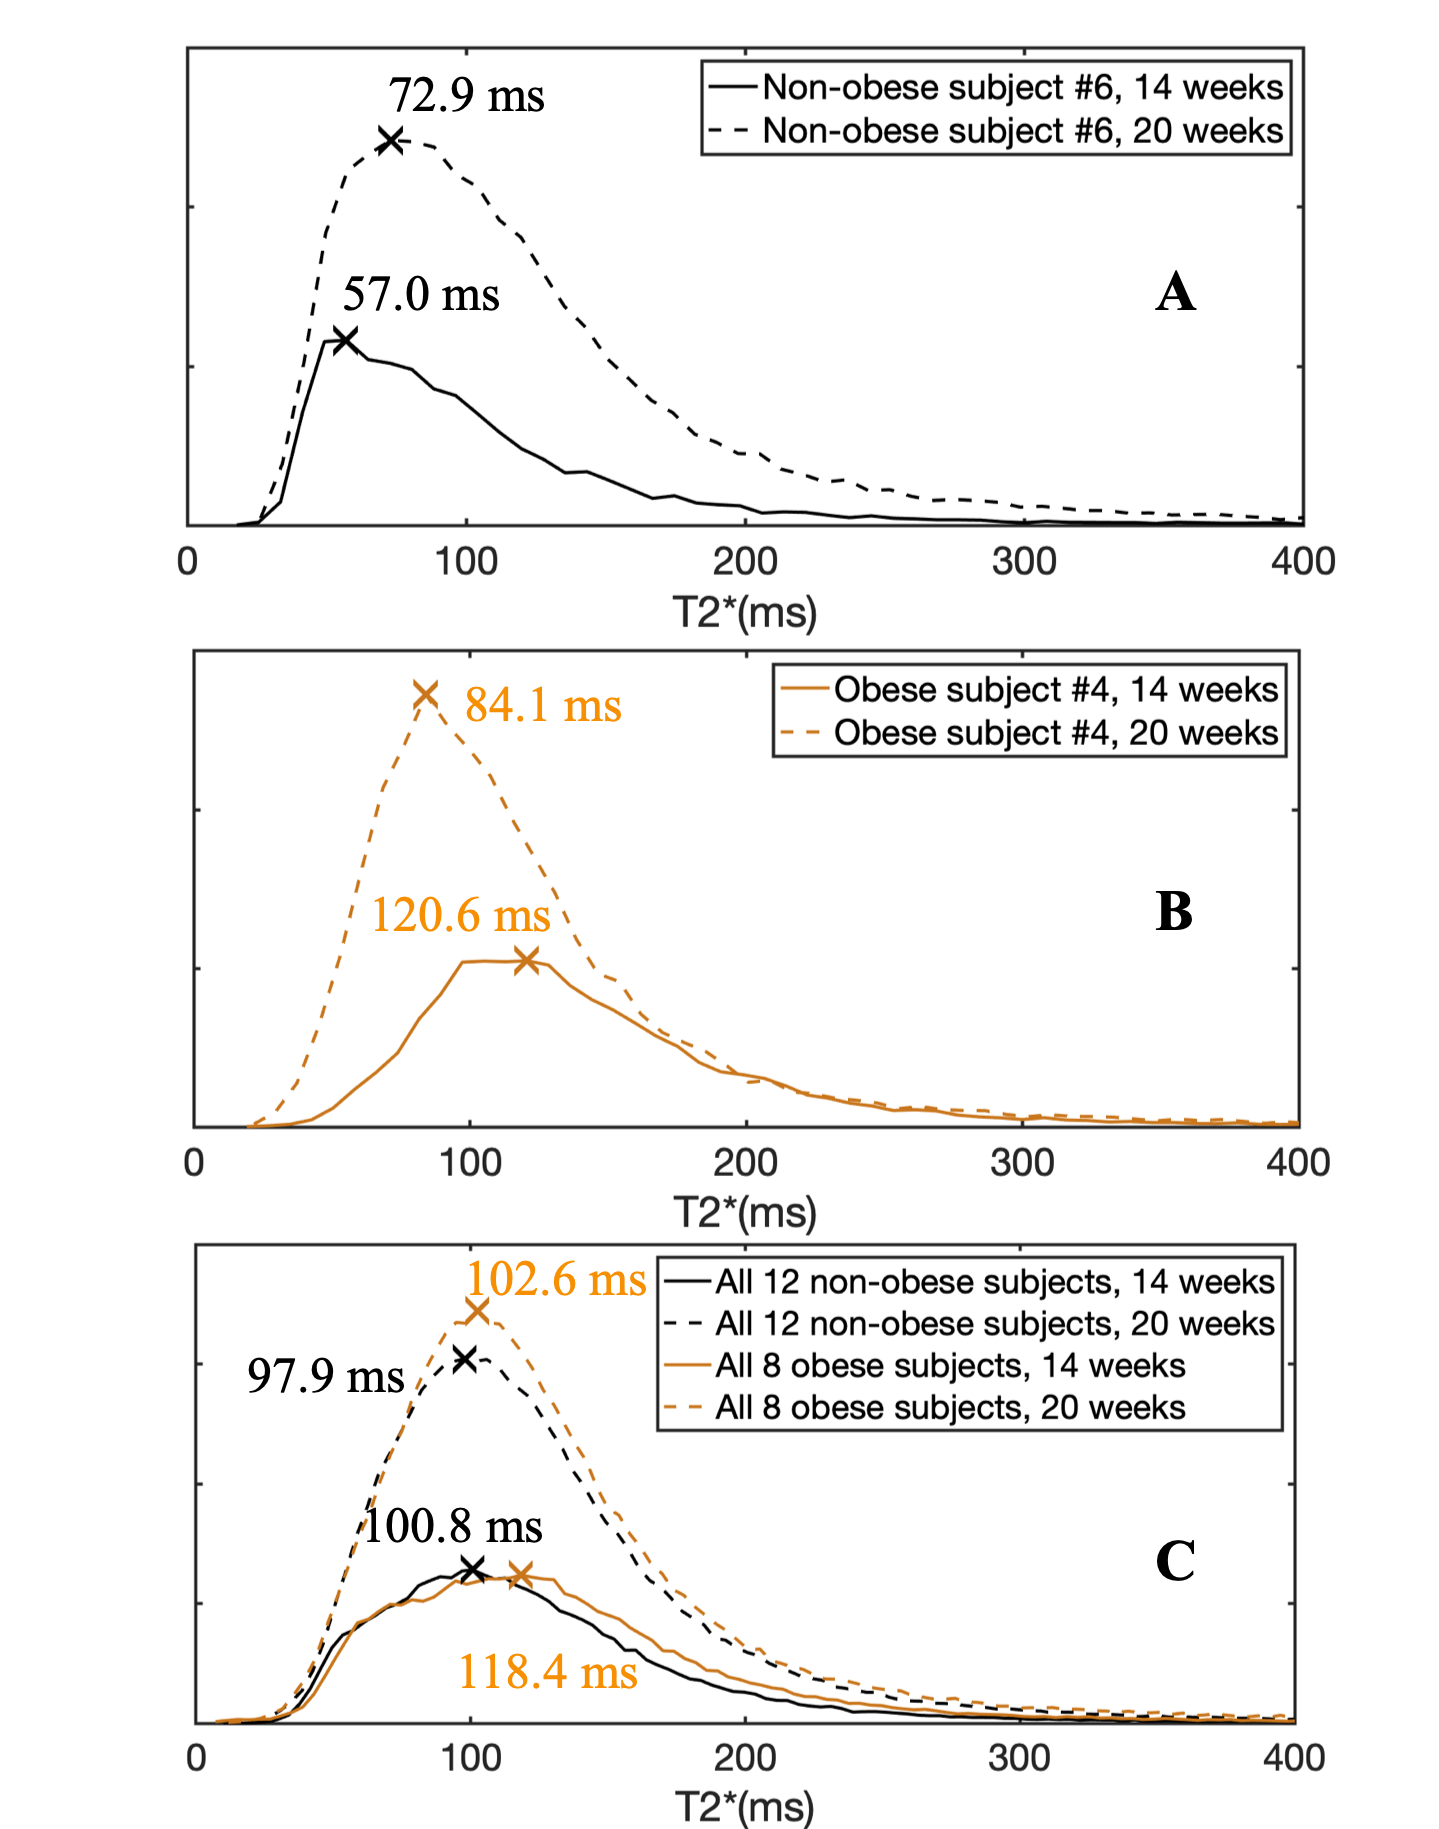
A total of 36 pregnant women, 21 non-obese subjects (mean BMI=24.3kg/m2) and 15 obese subjects (mean BMI=34.4kg/m2), were recruited and imaged at the two time points. 18 MRI datasets were non-diagnostic due to motion artifacts and thus excluded, leaving 12 non-obese and 8 obese subjects with datasets for both time points. 5 non-obese subjects and 1 obese subject had diagnosed complications in pregnancy. Figure 1 shows the inclusion and exclusion of subjects in the study and subjects’ information.Example anatomical images and T2* maps of one obese subject at 14/20 weeks of gestation are shown in Figure 2. The segmented placental discs are contoured with blue lines. Figure 3 shows the histogram of placental T2* of one non-obese subject (A), one obese subject (B), and all analyzed non-obese (black)/obese(orange) subjects (C). While the placenta of the non-obese subject has a trend of increased T2* with gestation (mode T2*: 57.0ms to 72.9ms), it has a trend of decreased T2* in the obese subject (mode T2*: 120.6ms to 84.1ms).
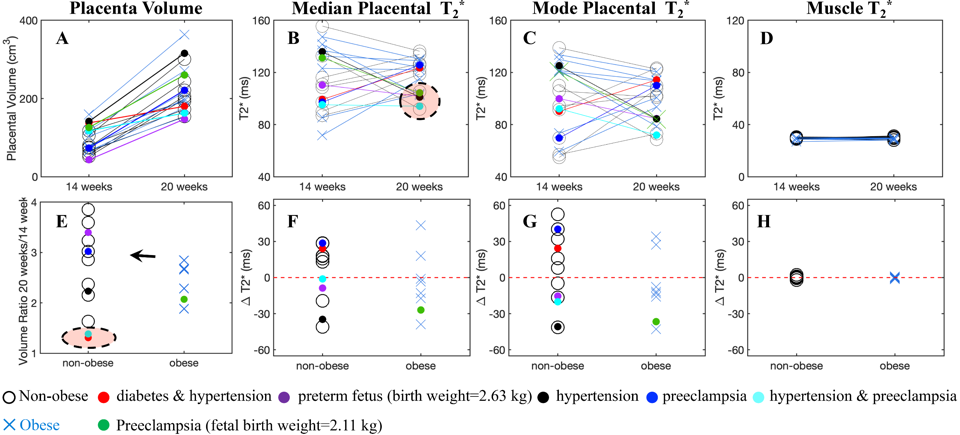
The placenta volume, median placental T2*, mode placental T2* and muscle T2* of each subject measured at two time points, and the volume ratio and the change of median/mode placental T2* and muscle T2* between the two gestation ages are shown in Figure 4. The placental T2* in the obese subjects is in similar range compared to the non-obese subjects, at both gestation ages (14 weeks: 54~155ms; 20 weeks: 72~136ms). In 6 non-obese subjects and 6 obese subjects, placental T2* has an increasing trend over gestational age (Figures 4F and 4G). The muscle T2* measurement of all subjects is stable over gestational ages, i.e., 33.9±0.8ms and 34.0±1.2ms at 14 and 20 weeks of gestation, respectively.
Substantial increase in placental volume is observed between the two gestational ages, but two subjects with pregnancy complications (diabetes and hypertension, hypertension and preeclampsia) have a much smaller increase (Figures 4A and 4E). Four subjects with pregnancy complications (preterm fetus, hypertension, hypertension and preeclampsia, preeclampsia) have a relatively low placental T2* at 20 weeks of gestation (Figures 4B).
DISCUSSION AND CONCLUSION
This study reported placental T2* of non-obese and obese subjects at 14 and 20 weeks of gestation at 1.5T. The range of placental T2* is similar between the two subject populations at both gestational ages, respectively. In 6 non-obese subjects, a non-significant trend of increased placental T2* between the two gestational ages was observed. Previous studies reported on a negative correlation of placental T2* and gestation age (GA)4,6 while other studies reported no significant correlation of placental T2* and gestation age (GA: range 21-38 weeks at 1.5T and 14-23 weeks at 3.0T)7,8. This suggests changes in placental oxygenation may be subject-specific at the early gestational window (14-20 weeks). This complicated process can be affected by many factors including the net result of evolving flow, perfusion, placental oxygen extraction efficiency and relative volume of intervillous blood volume and fetal villous tissue. In addition, stable muscle T2* measurements at the two scan times indicate that T2* measurements are reproducible across scan days. The reproducibility of placental T2* measurements, which may be affected by potential motion artifacts, needs further study. Moreover, small placental volume increases between 14 and 20 weeks of gestations and relatively low placental T2* values were observed in subjects with pregnancy complications. Joint analysis of the placental oxygenation and clinical indicators will be performed in future work.Acknowledgements
The authors acknowledge support from the NIH (grants U01-HD087216, R01-DK117354, R01-DK100651, K24-DK102595 and P51-OD011106) as well as GE Healthcare and Bracco Diagnostics who provides research support to the University of Wisconsin-Madison. Finally, Dr. Reeder is a Romnes Faculty Fellow, and has received an award provided by the University of Wisconsin-Madison Office of the Vice Chancellor for Research and Graduate Education with funding from the Wisconsin Alumni Research Foundation.References
1. Howell KR, Powell TL. Effects of maternal obesity on placental function and fetal development. Reproduction. 2017;153(3):R97.2.
2. Hutter J, Slator PJ, Jackson L, et al. Multi-modal functional MRI to explore placental function over gestation. Magn Reson Med. 2019;81(2):1191-1204.
3. Slator PJ, Hutter J, Palombo M, et al. Combined diffusion-relaxometry MRI to identify dysfunction in the human placenta. Magn Reson Med. 2019;82(1):95-106.
4. Schabel MC, Roberts VHJ, Rincon M, et al. A longitudinal multisite study of endogenous BOLD MRI in human pregnancies. In: Proc 27th Annual Meeting ISMRM. 2019:1075.5.
5. Yushkevich PA, Piven J, Hazlett HC, et al. User-guided 3D active contour segmentation of anatomical structures: Significantly improved efficiency and reliability. Neuroimage. 2006;31(3):1116-1128.
6. Sørensen A, Hutter J, Seed M, Grant PE, Gowland P. T2* weighted placental MRI: basic research tool or an emerging clinical test of placental dysfunction? Ultrasound Obstet Gynecol. 2019;0(ja).
7. Ingram E, Morris D, Naish J, Myers J, Johnstone E. MR Imaging Measurements of Altered Placental Oxygenation in Pregnancies Complicated by Fetal Growth Restriction. Radiology. 2017;285(3):953-960.
8. Armstrong T, Liu D, Martin T, et al. 3D Mapping of the Placenta During Early Gestation Using Free-Breathing Multiecho Stack-of-Radial MRI at 3T. J Magn Reson Imaging. 0(0).
Figures