2570
Quantification of T2* relaxation times of human liver in the midtrimester fetus at 1.5T1Radiology, University of Wisconsin-Madison, Madison, WI, United States, 2Biomedical Engineering, University of Wisconsin-Madison, Madison, WI, United States, 3Medical Physics, University of Wisconsin-Madison, Madison, WI, United States, 4Electrical and Computer Engineering, University of Wisconsin-Madison, Madison, WI, United States, 5Obstetrics and Gynecology, University of Wisconsin-Madison, Madison, WI, United States, 6Emergency Medicine, University of Wisconsin-Madison, Madison, WI, United States, 7Medicine, University of Wisconsin-Madison, Madison, WI, United States
Synopsis
In preeclampsia, the erythropoetin level in the fetus has been reported to be moderately elevated and the number of erythroid cells in the fetal liver reduced. Assessment of fetal liver health and function over gestation, including hepatic hematopoiesis, is of great interest. T2* relaxometry is an emerging quantitative biomarker of liver iron content. In this study, we assessed fetal liver T2* in the midtrimester pregnancy. A fetal liver T2* of 22ms and 25ms at 14 and 20 weeks of gestation, respectively, was observed at 1.5T. T2* values are significantly correlated with gestational age but not with obesity or mothers’ age.
INTRODUCTION
Ischemic placental disease (IPD) is a severe clinical condition which may result in preeclampsia, intrauterine growth restriction (IUGR) and placental abruption1,2,3. In expecting mothers suffering preeclampsia, the erythropoetin level in the fetus is moderately elevated and the number of erythroid cells in the fetal liver is significantly reduced in the late second and early third trimester of pregnancy4. Concomitantly, the level of Interleukin 3 is increased. It is unknown whether the fetal liver development may be impeded by IPD4. Thus, the non-invasive assessment of fetal liver development, including hepatic hematopoesis, is of interest. T2* relaxometry has emerged as a quantitative biomarker of iron content in pediatrics and adults. Therefore, the purpose of this study was to quantify T2* of the human fetal liver.METHODS
Subjects: This study was HIPPA compliant and was approved by the local Institutional Review Board. Pregnant women with singleton pregnancy, including non-obese and obese subjects, were recruited. Each subject was scheduled for imaging at 14 and 20 weeks of gestation. Subjects with a body mass index (BMI) above 30 kg/m2 were considered obese.Imaging: MRI scans were performed on a wide-bore 1.5T MRI system (Optima MR 450w, GE Healthcare) using a 48-channel phased array torso coil (Neocoil, Pewaukee, WI) with subjects in supine position. An axial 3D multi-echo spoiled gradient-echo (SGRE) acquisition of the maternal pelvis covering the uterine cavity was obtained, using gated maternal respiratory bellow signals. Imaging parameters were: 6 echoes, TEinit/ΔTEms=1.2/2.0 ms, TR=13.9 ms, flip angle=9°, field of view=42×38 cm2, 76 slices, slice thickness=3 mm, acquisition/reconstruction matrix size=144×130/256×256, acquisition bandwidth=±83.3 kHz, parallel imaging acceleration along phase/slice direction=2.0/1.5, scan time=1:48 minutes.
Data analysis: T1-weighted anatomic images and T2* maps for each subject at each visit were generated using a chemical shift-encoded reconstruction5 on the 3D SGRE images. An oval ROI was drawn in the T1-weighted water image with a relatively large continuous area of fetal liver tissues in one slice and copied to the T2* map. A linear mixed-effects model was used to analyze the variation of fetal liver T2* across the gestation age, obesity and the mother’s age. A two-sided Student’s t-test was used for testing the difference of T2* values over gestation ages. P≤0.05 was defined as statistically significant.
RESULTS
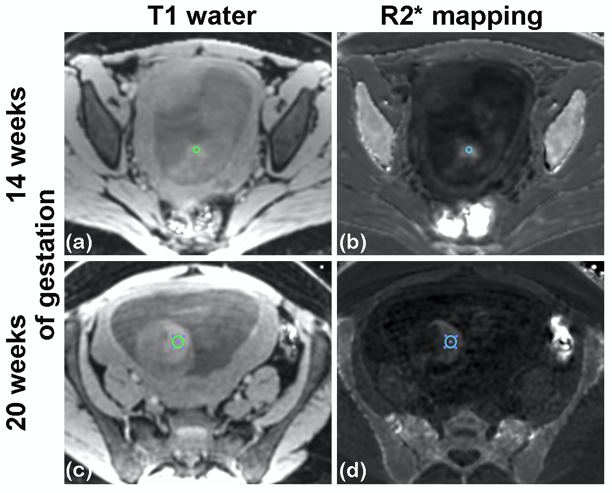
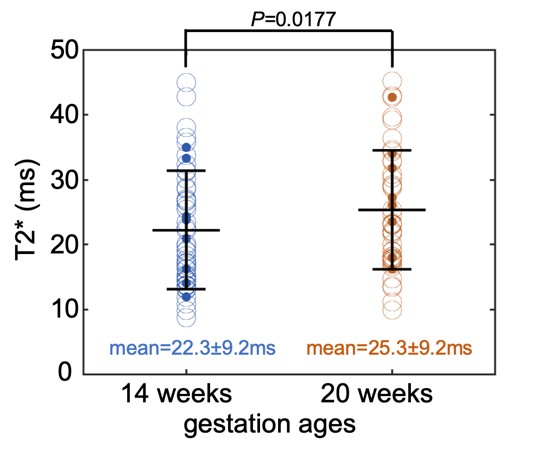
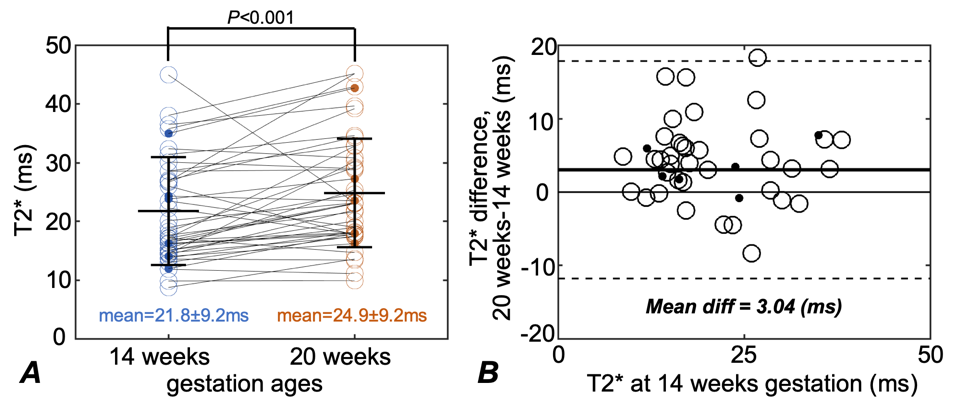
80 subjects (age=29.6±3.5 years, 15 obese subjects) were recruited and datasets of 155 scans were successfully acquired. 42 scans were excluded because of non-diagnostic imaging quality mostly due to motion artifacts, leaving 68 subjects (age=29.7±3.3 years, 11 obese subjects) with a total of 113 studies included for analysis. Among these subjects, 45 subjects (age=30.5±2.8 years, 6 obese subjects) had datasets for both time points, which were indicated as “paired group”.Example T1-weighted anatomic and R2* (=1/T2*) maps of a subject at 14 weeks of gestation and 20 weeks of gestation are shown in Fig. 1. The mean T2* of the fetal liver at 14 and 20 weeks of gestation was 22.3±9.2 ms and 25.3±9.2 ms for the unpaired group (Fig. 2), and 21.8±9.2 ms and 24.9±9.2 ms for the paired group, respectively (Fig. 3). In 34 of the 45 cases in the paired group, the fetal liver T2* increased from 14 to 20 weeks of gestation. The mean value of T2* increase over this time period was 3.0 ms (Fig. 3).
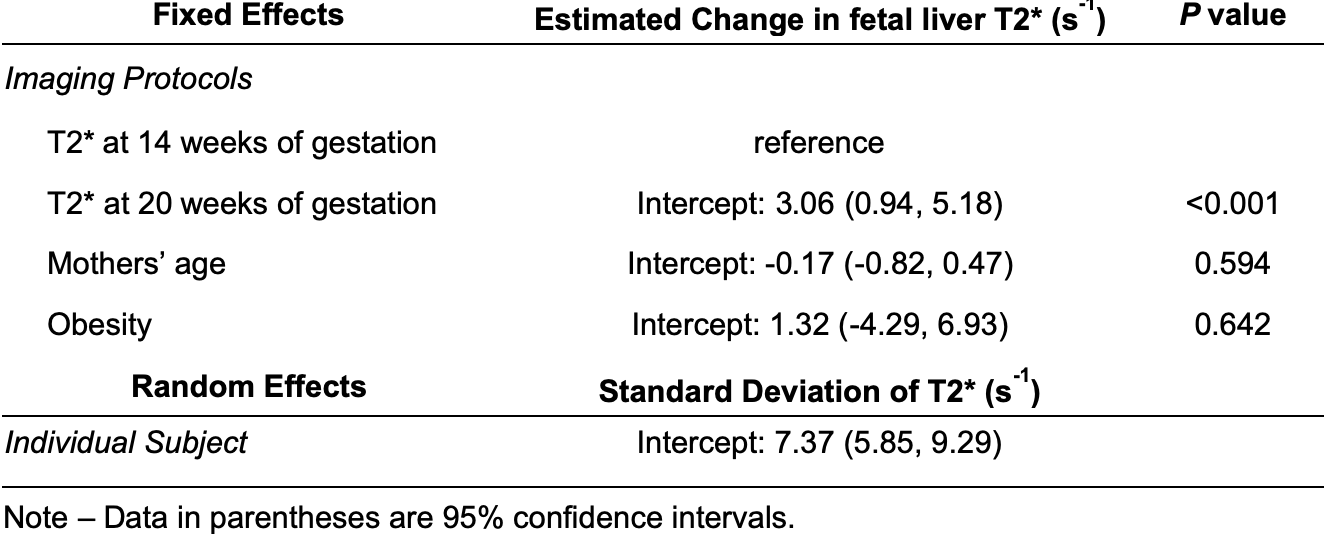
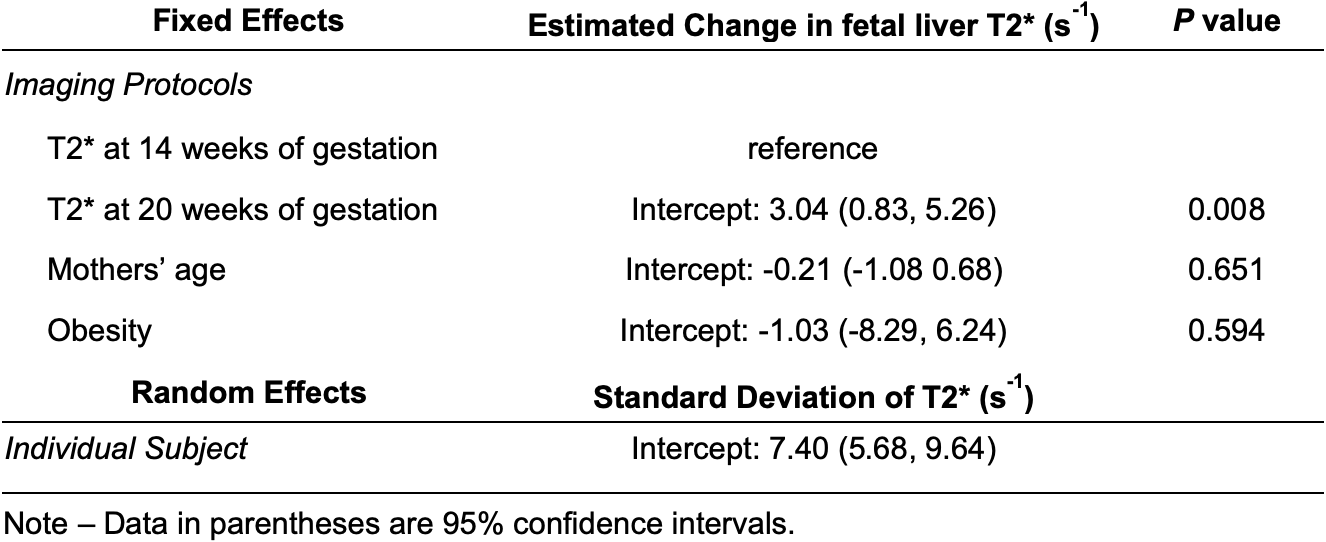
The fetal liver T2* showed a statistically significant correlation with gestation ages in both the unpaired (P< 0.001, Table 1) and paired (P=0.008, Table 2) groups in the linear mixed-effects model analysis. The fetal liver T2* did not correlate with the mother’s age or obesity. The variability of T2* across subjects, shown as the standard deviation in mixed-effects model analysis, is large (Tables 1 and 2). This analysis indicates relatively large impact of measurements from individual subjects.
DISCUSSION
Our results complement the sparse data available on fetal liver T2* measurements in the literature. Previous studies reported a decrease of the T2* values from 38~49 ms at 29 weeks to 23~29 ms at 38 weeks of gestation6,7. We observed an increase in fetal liver T2* from 14 to 20 weeks of gestation. This indicates that the trajectory of fetal liver iron concentration over gestational age is complicated. The increase of liver T2* values in early gestation suggests other contributing factors besides the amount of hepatic hematopoiesis in the developing fetal liver.This study has some limitations. We measured fetal liver T2* in ROIs instead of segmenting the whole liver. In most cases a reliable segmentation especially at early gestation is not possible due to the small liver size and the conjunct partial volume effects. Furthermore, the small T2* increase of 3.0 ms over the two gestation ages, though it is statistically significant, may be affected by motion artifacts. Assessment of the accuracy of fetal liver T2* including the repeatability and reproducibility studies at different gestation ages is ongoing.
CONCLUSION
This study establishes normal T2* values for the human fetal liver at 14 and 20 weeks of gestation. These data may help to understand the fetal liver physiology, including its role in hematopoesis in normal pregnancy and distinguishing it from deviations that indicate pathological conditions.Acknowledgements
The authors acknowledge support from the NIH (grants U01-HD087216, R01-DK117354, R01-DK100651, K24-DK102595 and P51-OD011106) as well as GE Healthcare and Bracco Diagnostics who provides research support to the University of Wisconsin-Madison. Finally, Dr. Reeder is a Romnes Faculty Fellow, and has received an award provided by the University of Wisconsin-Madison Office of the Vice Chancellor for Research and Graduate Education with funding from the Wisconsin Alumni Research Foundation.References
1. Ananth C V. Ischemic placental disease: A unifying concept for preeclampsia, intrauterine growth restriction, and placental abruption. Semin Perinatol. 2014;38(3):131-132.
2. Vintzileos AM, Ananth C V. First trimester prediction of ischemic placental disease. In: Seminars in Perinatology. Vol 38. Elsevier; 2014:159-166.3.
3. Ness RB, Roberts JM. Heterogeneous causes constituting the single syndrome of preeclampsia: a hypothesis and its implications. Am J Obstet Gynecol. 1996;175(5):1365-1370.4.
4. Stallmach T, Karolyi L, Lichtlen P, et al. Fetuses from preeclamptic mothers show reduced hepatic erythropoiesis. Pediatr Res. 1998;43(3):349.5.
5. Yu H, Shimakawa A, McKenzie CA, Brodsky E, Brittain JH, Reeder SB. Multiecho water-fat separation and simultaneous R2* estimation with multifrequency fat spectrum modeling. Magn Reson Med. 2008;60(5):1122-1134.
6. Morris DM, Ross JAS, McVicar A, et al. Changes in foetal liver T2* measurements by MRI in response to maternal oxygen breathing: application to diagnosing foetal growth restriction. Physiol Meas. 2010;31(9):1137.7.
7. Goitein O, Eshet Y, Hoffmann C, et al. Fetal liver T2* values: Defining a standardized scale. J Magn Reson Imaging. 2013;38(6):1342-1345.
Figures