2569
Relationship between Placenta T2* and Gestational Age at 3.0 T1Department of Radiology, Wayne State University School of Medicine, Detroit, MI, United States, 2Department of Obstetrics and Gynecology, Wayne State University School of Medicine, Detroit, MI, United States, 3Perinatology Research Branch, NICHD/NIH/DHHS, Detroit, MI, United States, 4Department of Radiology, Children Hospital of Michgan, Detroit, MI, United States, 5Department of Obstetrics and Gynecology, University of Michigan, Ann Arbor, MI, United States, 6Department of Epidemiology and Biostatistics, Michigan State University, East Lansing, MI, United States, 7Department of Biomedical Engineering, College of Engineering, Wayne State University, Detroit, MI, United States, 8The MRI Institute for Biomedical Research, Bingham Farms, MI, United States
Synopsis
Healthy growth and function of the placenta are important to support normal fetal development throughout the second and third trimester. T2* values affected by the tissue oxygenation could be a valuable tool to detect the placenta function. In this work, we collected T2* map for both health pregnancy and the pregnancy complicated by IUGR at different GA at 3.0 T and also investigated the relationship between them.
Introduction
Healthy growth and function of the placenta are important to support normal fetal development throughout the second and third trimester.1 It is known that both placental vascular density and oxygenation can indicate placenta health.2, 3 Blood oxygen level-dependent (BOLD) MRI can estimate the changes in oxygenation indicated by the signal decay. This decay is caused by local field inhomogeneities introduced by the presence of deoxyhemoglobin. However, the signal intensity does not directly reflect a physiologic quantity. Instead, T2* values affected by the tissue oxygenation could be a valuable tool to detect the placenta function. There were several studies reported the placenta T2* values at different gestational ages (GA) at 1.5 T.4-6 Some of them found that there was a strong relationship between T2* value and GA, and the T2* value decreased with GA.6 It was also found that for pregnant women with intrauterine growth restriction (IUGR), the T2* value was lower.6 3.0 T MRI provides higher resolution T2* map, and the scan time is shorter which can reduce the motion artifacts effects. However, there are only a few placenta T2* map studies performed at 3.0 T, and none of them found a relationship between placenta T2* value and GA in IUGR subjects.7-8 In this work, we collected T2* map for both health pregnancy and the pregnancy complicated by IUGR at different GA at 3.0 T and also investigated the relationship between them.Methods
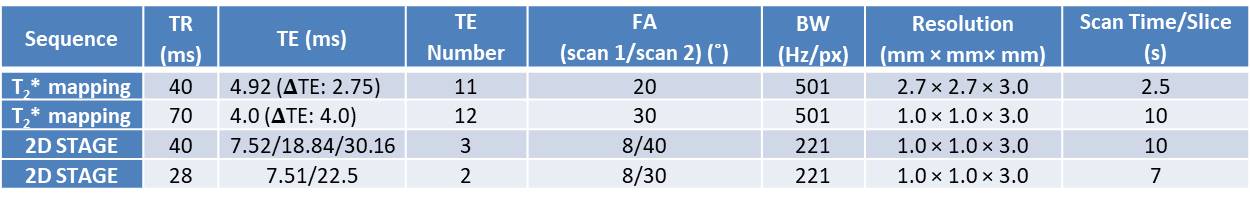
The experiments were performed at 3.0 T Siemens Verio MRI system with a 6-channel flex coil and a 4-channel spine coil. Ten normal healthy pregnant subjects (GA range: 23 + 4/7 weeks to 36 + 2/7 weeks) and five pregnant subjects complicated by IUGR (GA range: 24 + 2/7 weeks to 35 + 3/7 weeks) who was diagnosed by ultrasound test were recruited in the study. One normal subject and one IUGR subject were screened twice (Normal: the first visit: 24 weeks, the second visit: 31 + 1/7 weeks; IUGR: the first visit: 24 + 2/7 weeks, the second visit: 31 + 2/7 weeks). T2* map was collected by either conventional T2* mapping sequence or 2D multi-echo Strategically Acquired Gradient Echo (STAGE) sequence (Table 1) covering the entire placenta. All the analyses were performed by custom-written software in MATLABTM. The data analysis only included all the voxels with a goodness of fit for the T2* exponential fitting higher than 0.85 and the T2* value lower than 200 ms. Both Pearson’s correlation coefficients (ρ) and t-test values (P) between placenta T2* and GA were calculated. For the subjects with two visits, the histograms for placenta T2* values were generated with 40 equally spaced bins within 0 to 200 ms.Results
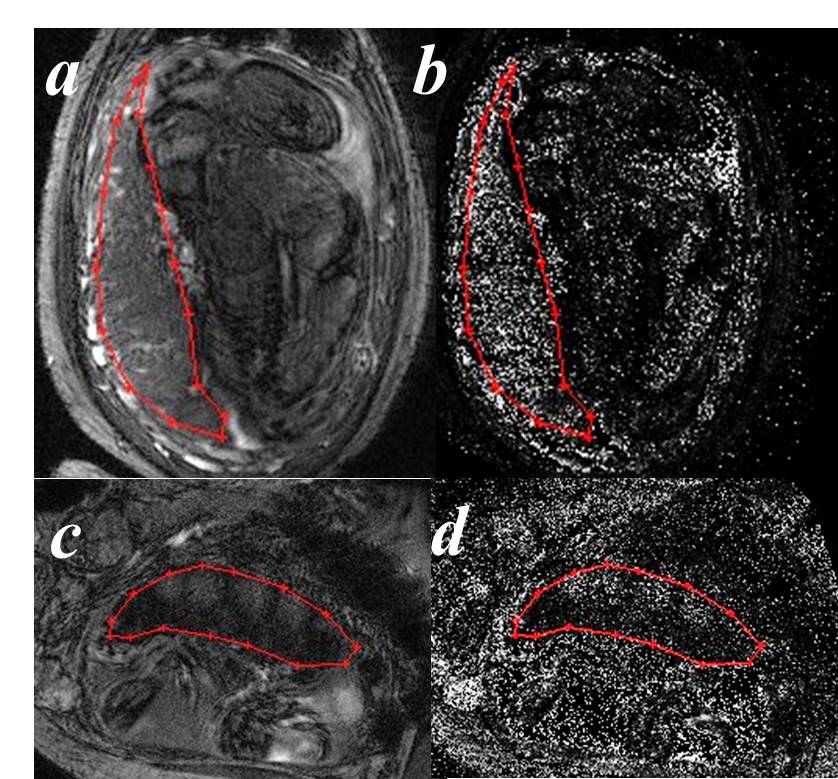
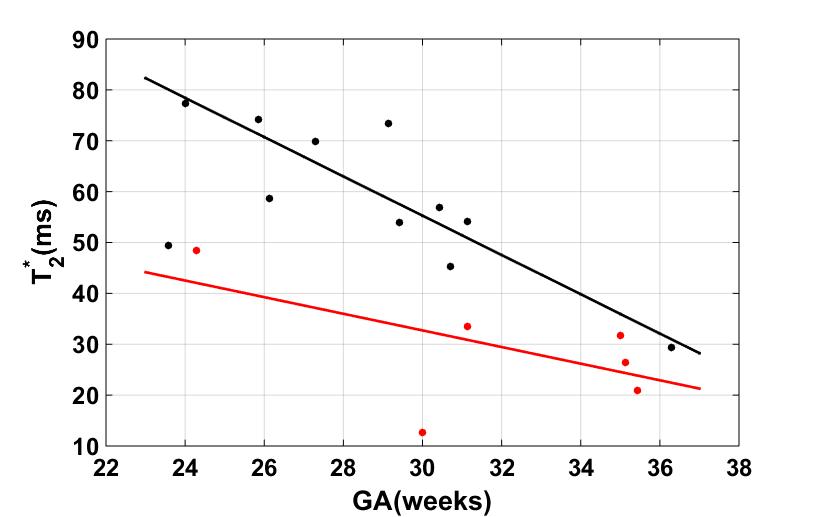
The placenta T2* weighted images and maps for one normal subject and one IUGR were shown in Figure 1. The two cases were screened by the same protocols. The placenta T2* values for all the subjects were plotted in Figure 2. It is clear that for both normal cases (black dots) and IUGR cases (red dots), the T2* values decreased with GA. The variation was statistically significant for the normal cases (P < 0.05), but not for the IUGR cases (P = 0.247). The linear correlations between T2* values and GA are given by the following formulas (is the goodness of fit statistic):$$$T_2normal^{*}=-3.861\times GA +171.1 (gof_R2 = 0.615, \rho = -0.675) [1]$$$
$$$T_2IUGR^{*}=-1.634\times GA +81.74 (gof_R2 = 0.210, \rho = -0.561) [2]$$$
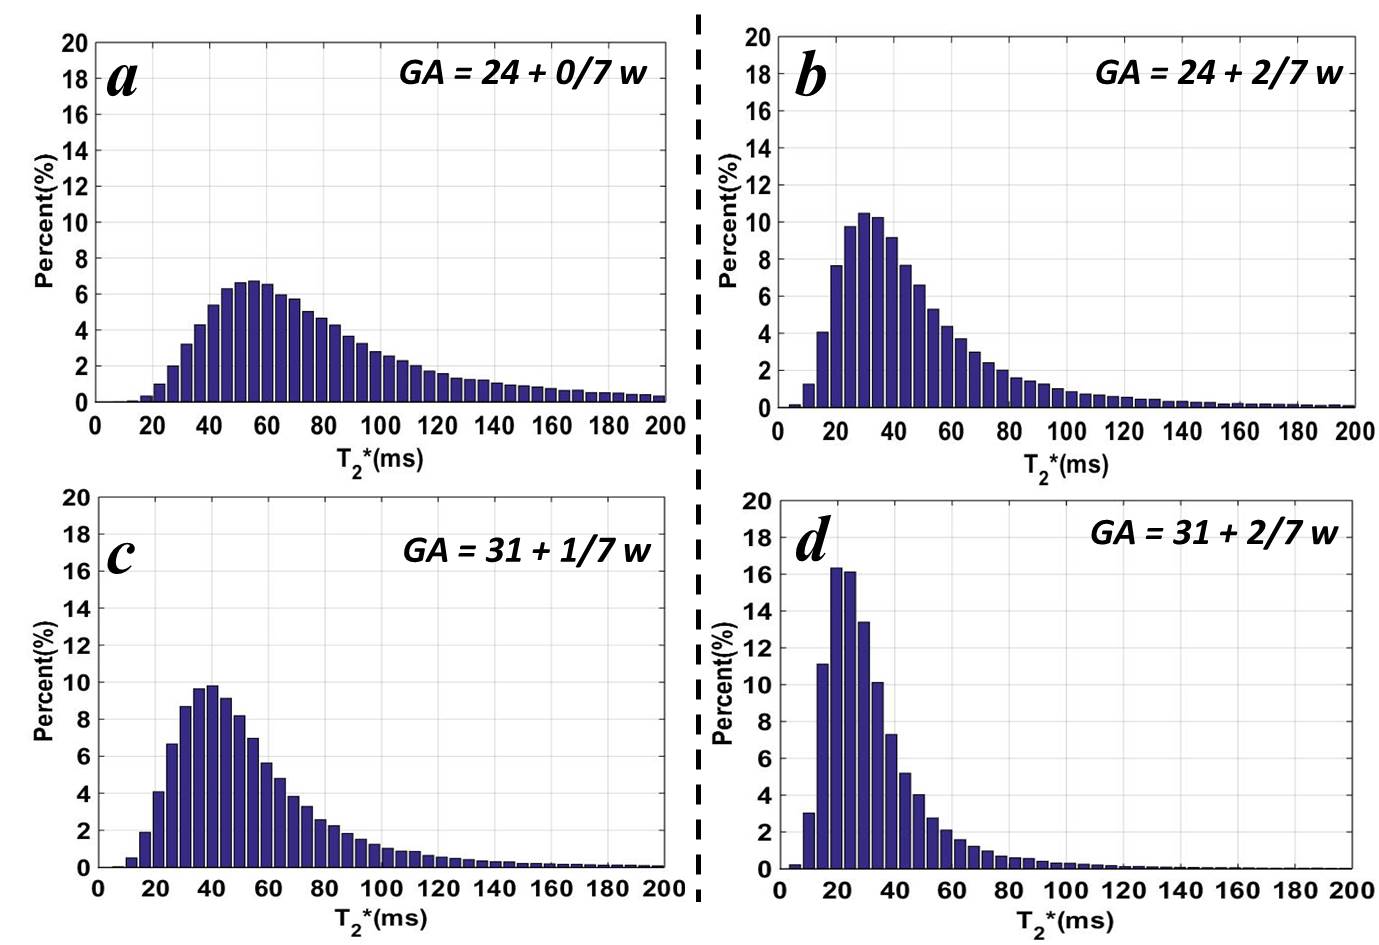
For the cases with two visits, the placenta T2* decreased from 77.3 ± 37.0 ms to 54.1 ± 28.9 ms for the normal case and from 48.5 ± 30.4 ms to 33.4 ± 21.1 ms for the IUGR case. The T2* histograms were shown in Figure 3. The peak values shifted from 55 ms to 40 ms for the normal case and from 30 ms to 20 ms for the IUGR case.
Discussions
In this study, we measured the placenta T2* value for normal pregnant subjects and complicated pregnant subjects with IUGR. In Figure 1, the images for the IUGR case had lower SNR, and the bright pockets near maternal sides in the placenta (Figure 1.c) may be related to the cotyledons. The T2* values were higher in the normal cases than the IUGR cases with a similar GA as expected (Figure 2).6 We also found that T2* value decreased with GA, and there was a strong negative correlation between T2* value and GA (Figure 2). These results were consistent with the published work.6, 7 Two subjects were recruited twice with the first visit in 24 weeks and the second one in 31 weeks. The reduction for the average T2* value of the entire placenta was much larger in normal cases, and the distribution of the T2* value also show more decrease in the normal cases. The decrease of the T2* value may be caused by the placental morphological changes. The larger reduction might indicate the tissue structure has more changes through the GA in healthy placenta.Conclusions
Placenta T2* value decreased with GA. The decreased rate was faster in normal pregnancy in comparison with IUGR pregnancy.Acknowledgements
The authors would also like to thank Karthikeyan Subramanian, Kiarash Ghassaban and the research staff at PRB for their help in volunteer recruitment.References
1. Brosens I, Pijnenborg R, Vercruysse L, et al. The “Great Obstetrical Syndromes” are associated with disorders of deep placentation. American journal of obstetrics and gynecology.2011;204(3):193-201.
2. Yampolsky M, Salafia CM, Shlakhter O, et al. Centrality of the umbilical cord insertion in a human placenta influences the placental efficiency. Placenta.2009;30(12):1058-1064.
3. Meschia G, Creasy RK, Resnik R, Iams JD, et al. Placental respiratory gas exchange and fetal oxygenation.1994:181-191.
4. Huen, Isaac, David M. Morris, Caroline Wright, et al. R1 and R2* changes in the human placenta in response to maternal oxygen challenge. Magnetic resonance in medicine. 2013;70(5):1427-1433.
5. Ingram Emma, David Morris, Josephine Naish, et al. MR imaging measurements of altered placental oxygenation in pregnancies complicated by fetal growth restriction. Radiology. 2017;285(3):953-960.
6. Sinding Marianne, David Alberg Peters, Jens Brøndum Frøkjær, et al. Placental magnetic resonance imaging T2* measurements in normal pregnancies and in those complicated by fetal growth restriction. Ultrasound in Obstetrics & Gynecology. 2016;47(6):748-754.
7. Hutter Jana, Paddy J. Slator, Laurence Jackson, et al. Multi‐modal functional MRI to explore placental function over gestation. Magnetic resonance in medicine. 2019;81(2):1191-1204. 8. Armstrong Tess, Dapeng Liu, Thomas Martin, et al. 3D mapping of the placenta during early gestation using free‐breathing multiecho stack‐of‐radial MRI at 3T. Journal of Magnetic Resonance Imaging. 2019;49(1): 291-303.
Figures