2568
First in vivo demonstration of venous return in the human placenta
George Hutchinson1, Neele Dellschaft1, Simon Shah2, Nia Jones3, Lopa Leach4, and Penny Gowland1
1SPMIC, The University of Nottingham, Nottingham, United Kingdom, 2Kings College London, London, United Kingdom, 3Queens Medical Centre, The University of Nottingham, Nottingham, United Kingdom, 4School of Life Sciences, The University of Nottingham, Nottingham, United Kingdom
1SPMIC, The University of Nottingham, Nottingham, United Kingdom, 2Kings College London, London, United Kingdom, 3Queens Medical Centre, The University of Nottingham, Nottingham, United Kingdom, 4School of Life Sciences, The University of Nottingham, Nottingham, United Kingdom
Synopsis
Little is known about maternal venous return from the placenta, despite the fact this good venous drainage is critical for adequate flow into, and percolation through the placenta. In this abstract we aim to identify and characterise venous return by identifying regions of blood flowing across the placental wall, and we find similar velocities of blood flow entering and leaving the placenta.
Introduction
Placental perfusion is fundamental to fetal growth and development. It is well known that in early gestation the spiral arteries in the uterine wall are transformed to ensure low pressure, low velocity, high volume flow of maternal blood through the placenta, which is essential for fetal and maternal health. Venous drainage is thought to occur at the boundaries of each placental cotyledon and the marginal sinus1. However very little is known about the venous return from the placenta, despite the fact that unimpeded venous return is critical in ensuring high flow of maternal blood into the placenta and percolation of maternal blood throughout the entire placenta to ensure rapid exchange to the fetus. Here we aim to identify and characterise venous return in the healthy placenta using phase contrast quantitative flow measurements.Methods
10 healthy pregnant women (age 31±6 years, gestational age 31±3 weeks) were recruited with local ethics approval and scanned on a Philips 3T Ingenia, in the normal controlled mode, lying tilted onto their left hand side. 3D velocity data was acquired using respiratory-gated pulsed gradient spin echo (PGSE) EPI sequence. Unwrapped phase data was inspected and any slices corrupted due to fetal or maternal motion were discarded.The basal plate (margin between placenta and uterine wall) was masked by hand, the mask was approximated to a series of 2D lines and only placental voxels within 4 voxels of this mask were considered further (i.e. the materno-placental boundary).
First the relationship between velocity and direction of flow with respect to the mask was investigated. The number of voxels showing flow at increasing angles of acceptance around the normal to the mask were calculated. This was done for flow into the placenta (arterial inflow, away from the basal plate) and also out of the placenta (venous outflow towards the basal plate). The average flow velocity within those angles of acceptance was also plotted for inflow and outflow (Fig 1,2).
Next we clustered voxels showing clear inflow from or outflow towards the basal plate (ie travelling within θ = ±60° of the normal of the mask; Fig 1). These voxels were clustered by first identifying voxels flowing within θ = ±45° of normal to the mask, and then finding neighbouring voxels with flow in the same direction (within 1 voxel and θ = ±60° of normal, or within 2 voxels and θ = ±45° of normal). When no new voxels could be added to this cluster, a new search began at the next voxel with flow towards or away from the basal plate (θ = ±45° of normal).
Results
Fig 2a shows that the number of voxels showing flow towards or away from the basal plate, increased with acceptance angle around the normal to the basal plate (figure 1) as expected. Figure 2b shows that the average speed of blood flow decreased with increased angle of acceptance. Approximating a linear model for figure 2b, the average intercept for inflow (corresponding to the velocity for flow directed most directly away from the wall) was 0.04±0.02 cms-1; the average intercept for outflow was 0.05±0.02 cms-1. The average gradient for inflow was -0.01 ± 0.01 mms-1 per degree and for outflow was -0.02 ± 0.01 mms-1 per degree.Fig 3a is a single slice through the placenta, where Fig 3b shows the velocities of the inflow and outflow voxels for this slice and Fig 3c shows clusters identified. Fig 4 shows the sizes of the clusters and mean flow velocities in the clusters for inflow and outflow.
Discussion
The mean velocity of flow, towards or away from the basal plate at the edge of the placenta, decreased with increasing the acceptance angle in all subjects (Fig 2b). This indicates that at the edge of the placenta the highest velocities are directed perpendicular rather than parallel to the uterine wall. This suggests that blood flows into across the basal plate at a higher velocity than random percolation sideways through the placenta, and therefore that we are observing arterial input and venous return across the basal plate.From (Fig 4 a,b) we see that inflow and outflow clusters are relatively large and have similar average velocities, sizes and prevalence, suggesting that we are capturing similar amounts of blood entering and leaving the placenta. The large clusters indicate that we are seeing net flows across the wall and not simply turbulent blood ‘bouncing’ off the basal plate. The fact that average velocity for outflow clusters are similar that for inflow clusters suggests that the areas of arterial and venous openings must be similar.
Conclusion
Blood flowing into the placenta must clearly also flow out, but such flows have never before been observed in utero. We have observed fast flow consistent with flow converging on the point of venous drainage out of the placenta. Additionally we found that the velocity of venous return was similar to the velocity of arterial input.Acknowledgements
This work was funded by the National Institute of Health and the EPSRC/MRC Oxford Nottingham Biomedical Imaging CDT.References
1. KURT BENIRSCHKE, PETER KAUFMANN,REBECCA N BAERGEN. Pathology of the human placenta. 5th ed. Springer, 2006.Figures
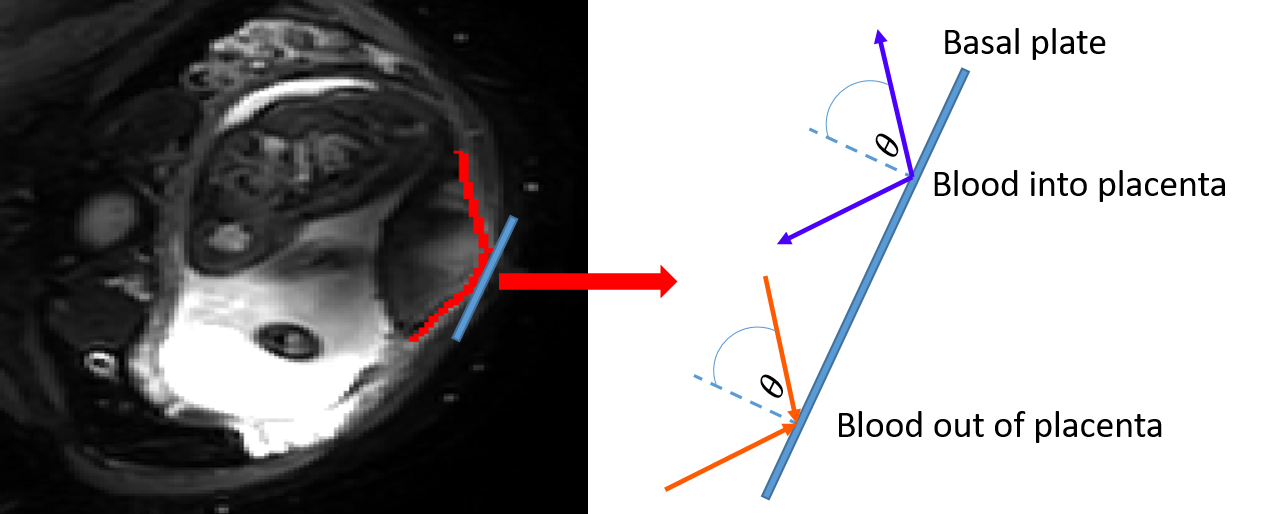
Figure 1 Single slice of PGSE EPI sequence on a healthy
participant. Basal plate is masked in red, and an example 2D line segment is
added as a blue line. On the right this line segment is expanded, and
inflow/outflow lines are shown and are defined.
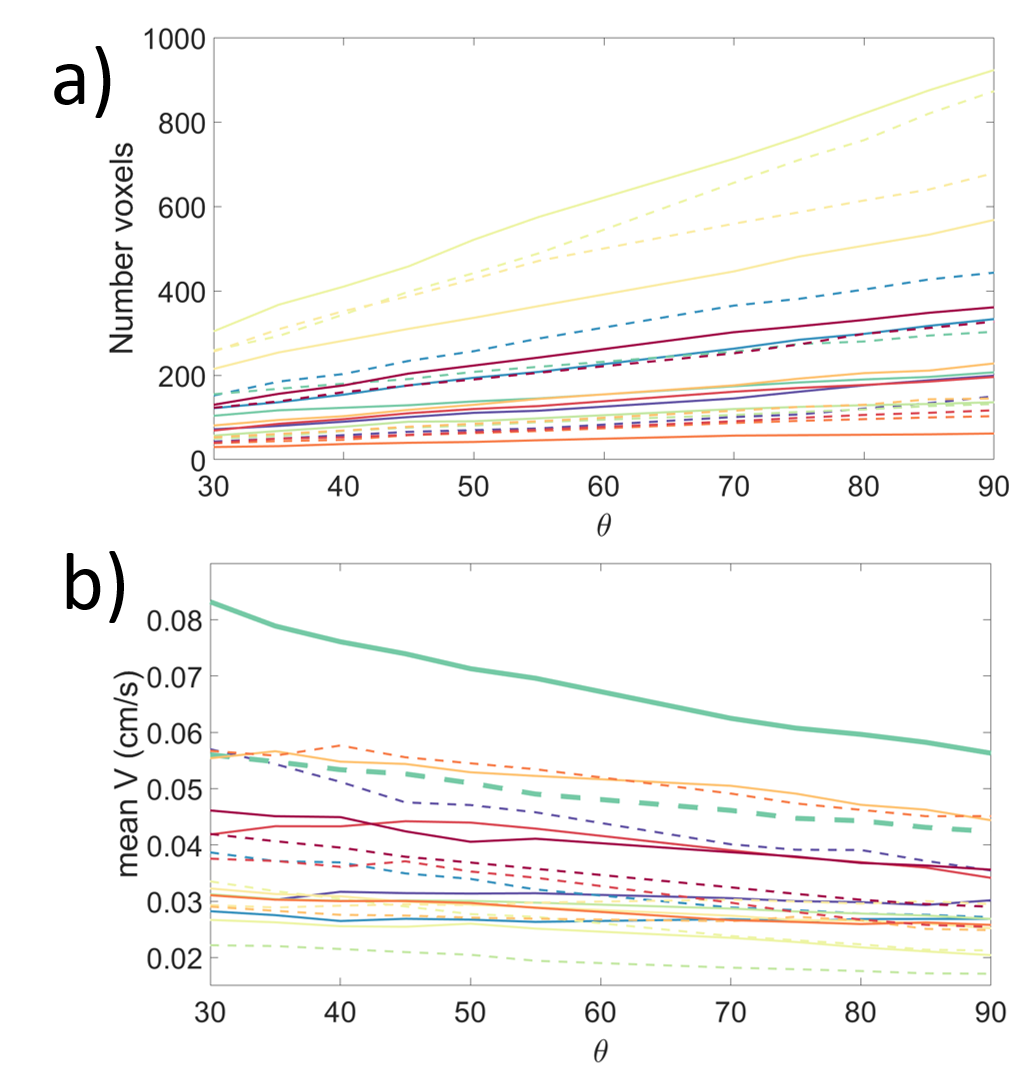
Figure 2 a) Plot of the number of voxels accepted for cumulative angle of acceptance b) Plot of the mean velocity vs cumulative acceptance angle
for all subjects. Solid lines are inflow and dashed lines are outflow, each
colour represents a different subject. One subject (green) is highlighted.
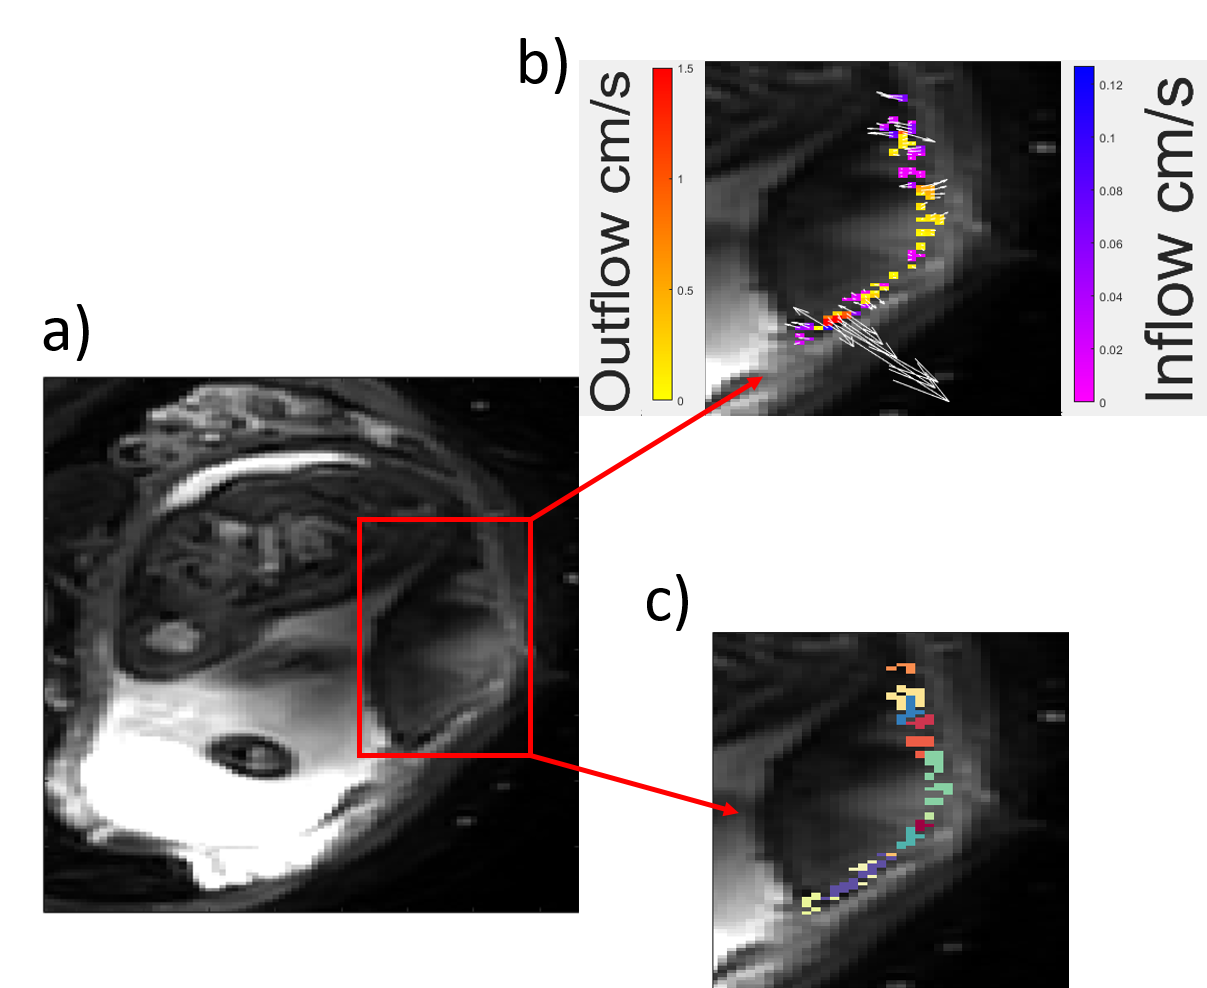
Figure 3 a) Single slice of PGSE EPI sequence on a healthy
participant. b) Clustered voxels plotted and coloured based on being inflow or
outflow, and their velocities. Arrows plotted to show direction of travel and
are scaled relative to velocity. c) Voxels shown in the same colour belong to
the same cluster.
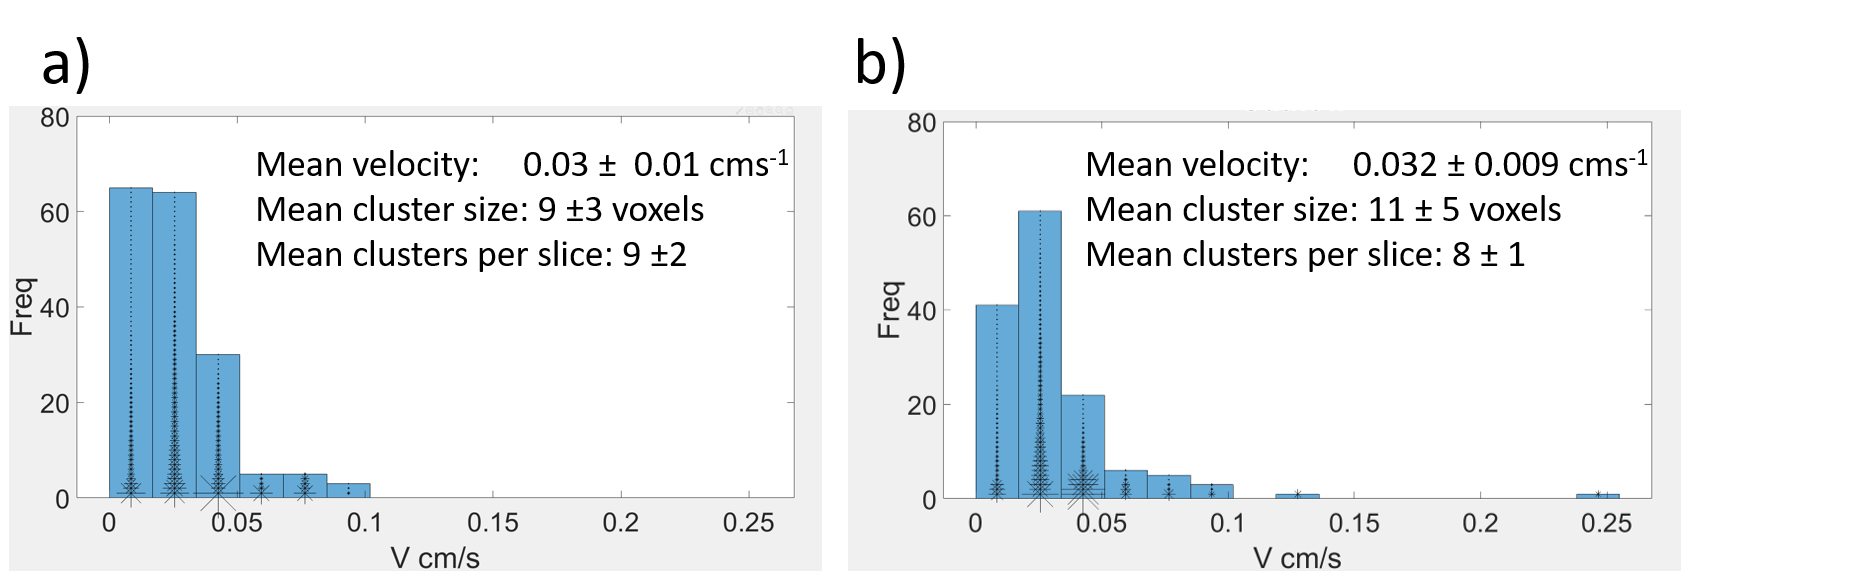
Figure 4 a) Histogram of the mean velocity of inflow clusters. b)
Histogram of the mean velocity of outflow clusters. On both histograms each
cluster is plotted with an asterisk, which is scaled relative to the cluster
size.