2561
Assessments of Blood Flow Curve Characteristics of Type2 Diabetes Using 4D Flow MRI1Department of Radiology, Zhong Da Hospital,Southeast Univ., Nanjing, China, 2Department of Biomedical Engineering, Center for Biomedical Imaging Research,Tsinghua Univ., Beijing, China
Synopsis
The aim of this study is to identify the abdominal blood flow curve characteristics of patients with type2 diabetes using advanced 4D Flow MRI, compared with the healthy subjects. Left and right renal arteries as well as splenic artery were visualized and quantified by dedicated software. The characteristics of flow curves showed significant differences in the skewness and time to peak, which may indicate the variation in renal progression rates and become promising non-invasive biomarkers of the T2DM function assessment.
Introduction
4D Flow MRI allows non-invasive and comprehensive 3D coverage and quantification of time-resolved 3D blood flow in one cardiac cycle. [1] General assessment of type2 diabetes (T2DM) blood flow is usually conducted by ultrasound. The aim of this study is to identify the abdominal blood flow curve characteristics of patients with T2DM using advanced 4D Flow MRI, compared with the healthy subjects.Methods
Participants:In this institutional research ethics board-approved prospective study, ten patients (7 males and 3 females; age 50.7±3.4 years) with T2DM diagnosed by clinical data were included in the study, and ten healthy subjects (7 males and 3 females; age 47.2±3.29 years) with no history of T2DM were included as a control group of matched age and sex(Baseline characteristics are presented on Table1). To be noted, all the subjects were not demonstrated or diagnosed with primary vascular diseases or malformation.MRI protocol: Both groups underwent a 4D Flow MRI examination centered over the abdominal area to acquire the hemodynamic data in a 3.0T magnetic resonance (MR) scanner (PHILIPS Ingenia, Philips, Best, Netherlands). The scanning time of this 4D Flow sequence is around 6 minutes, accelerated by SENSE parallel imaging. 4D Flow data were acquired by a free-breathing, peripheral pulse-gated, multi-shot turbo field echo sequence, with 3-direction velocity encoding in a 4-point velocity encoding scheme. [2]
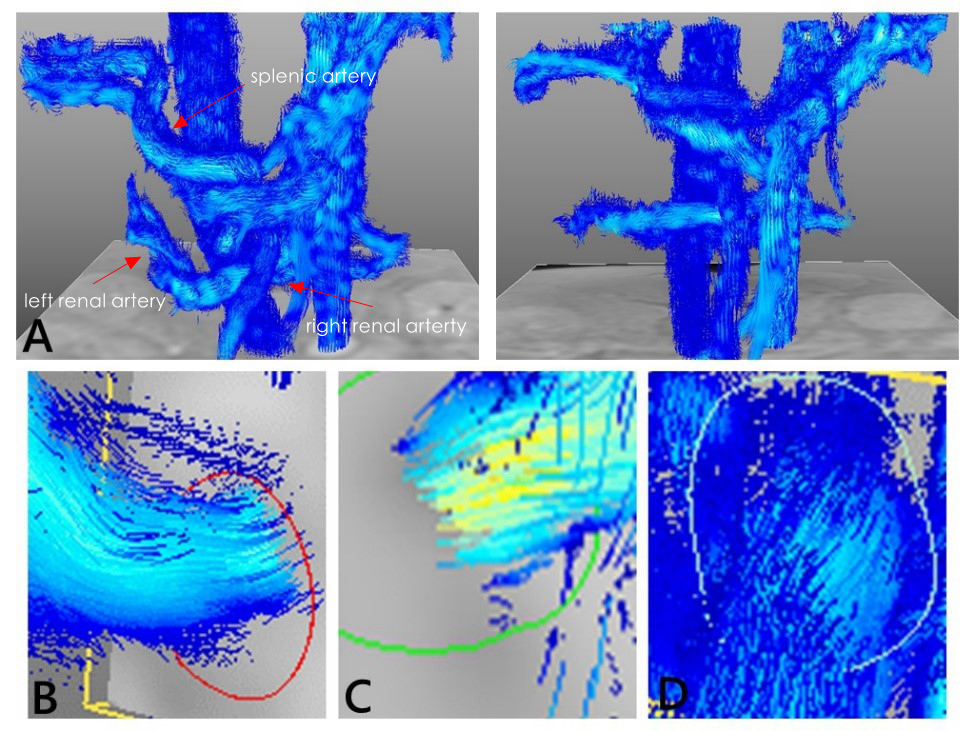
Data analysis: All the preprocessing, visualization, and quantification of 4D-Flow data were performed using GT Flow, version 3.2.5 (GyroTools, Zurich, Switzerland). 3 vessels were included (splenic artery, left and right renal arteries), every contour on each vessel was manually chosen and drawn to quantify the hemodynamic parameters and generate blood flow curves (Figure 1). Average through-plane velocity (Vtp_avg, cm/s), maximum through-plane velocity (Vtp_max, cm/s), average velocity (V_avg, cm/s), maximum velocity (V_max, cm/s), and net blood flow (Net flow, ml/s) were calculated and taken into analysis. The definition of velocities inside the contour are as follows, V(cm/s) is the magnitude of the velocity through the contour and V_tp (cm/s)is the value of the velocity perpendicular to the contour plane. [2]
Statistical analysis: Statistical analysis was conducted by SPSS(v. 22.0; IBM SPSS, Armonk, NY)and Matlab (R2018,Natick, Mass) . All of the 3 selected vessels of each participant were identified and segmented by two experienced independent observers. Intra-observer and inter-observer reproducibility were evaluated in 5 randomly chosen healthy subjects with intra-class correlation coefficients(ICC) and Bland-Altman analysis. [3-4] The skewness and kurtosis as well as time to peak which could describe the distribution characteristics of the statistics were analyzed depending on the 20 phases of flow profiles. Unpaired student t-test was operated to determine the difference of the blood flow curve profile between T2DM patients and controls. The level of statistical significance was set at p < 0.05.
Results
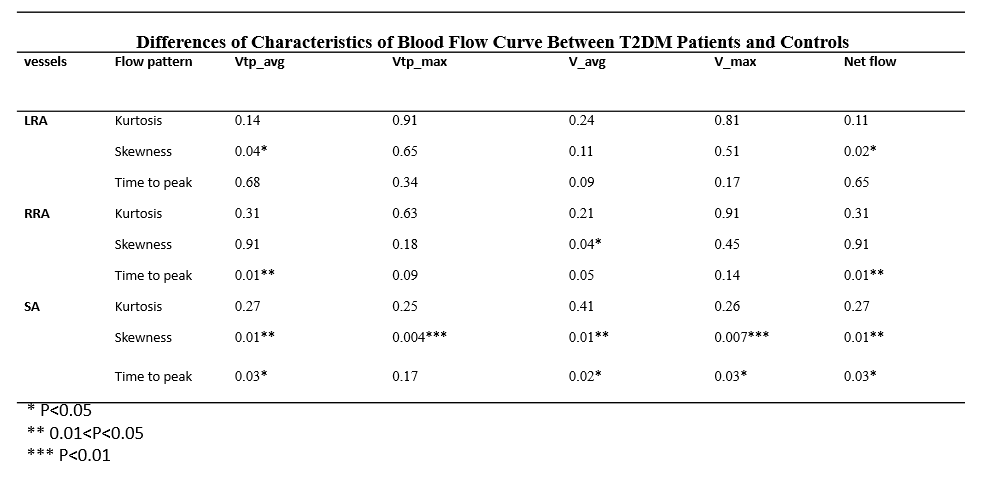
For the assessments of overall flow parameters, both intra-observer and inter-observer reproducibility showed excellent agreements (presented in Abstract No.1260).For the T2DM patients, LRA showed a relatively smaller time to peak (13.3±1.3 heart phase vs 14.6±0.7341, p=0.09) in V_avg curve. In addition, we observed significant differences of skewness in Vtp_avg curve. (p=0.04) and net flow curve (p=0.02) compared with the control group. RRA also showed the smaller time to peak (13.2± 2.400 vs 15.6± 0.8819 heart phase, p=0.014), along with a difference in skewness of V_avg curve (p=0.04). SA performed the most significant differences in skewness in all curves. (p=0.01 in Vtp_avg curve, p=0.004 in Vtp_max curve, p=0.01 in V_avg curve, p<0.01 in V_max curve and p=0.01 in Net flow curve). However, we did not observe significantly different kurtosis in 3 vessels.
Discussion
In our study, we characterized blood flow curves in abdomen by 4D Flow MRI, and identified the difference in the curves between healthy controls and T2DM patients. Patients with T2DM showed a significantly altered flow profile in 3 vessels. With the progression of diabetes, a progressive decline in kidney function is leading towards end-stage renal disease (ESRD). [5] However, it is quite difficult to control and treat T2DM when obvious kidney dysfunction happens. Fortunately, it seems our study found some relatively early stage changes in renal hemodynamic flow including earlier time to peak, which was corresponding to the skewness transformation. This phenomenon may indicate the variation in renal progression rates and become a promising non-invasive biomarker of renal function for T2DM patients. Interestingly and unexpectedly, the hemodynamics in splenic artery altered more evidently than renal arteries, which mechanism needs further research. Due to the limitation of the sample size, it is difficult to determine whether the progression of T2DM will lead to more obvious changes. More detailed classification and different age groups of patients will be included in the future to illuminate our findings.Conclusion
In conclusion, we observed significant blood flow curve changes in 3 vessels in T2DM patients compared to the controls. The SA showed the greatest degree of change. We believe the advanced 4D Flow MRI may provide a promising prospect to assess instant and early hemodynamic changes in T2DM.Acknowledgements
This work was supported by grants from the National Natural Science Foundation of China (81830053); National Natural Science Foundation of China (81525014); Innovative Research Group Project of the National Natural Science Foundation of China (CN) (61821002).References
[1] Dyverfeldt P, Bissell M, Barker AJ, et al. 4D flow cardiovascular magnetic resonance consensus statement. J Cardiovasc Magn Reson 2015;17:72.
[2] Yunduo L , Huijun C , Le H , et al. Hemodynamic assessments of venous pulsatile tinnitus using 4D-flow MRI[J]. Neurology, 2018:10.1212.
[3] Rahman O, Markl M, et al. Reproducibility and Changes in Vena Caval Blood Flow by Using 4D Flow MRI in Pulmonary Emphysema and Chronic Obstructive Pulmonary Disease (COPD): The Multi-Ethnic Study of Atherosclerosis (MESA) COPD Sub-study. Radiology. 2019 Sep;292(3):585-594.
[4] Bane O , Peti S , Wagner M , et al. Hemodynamic measurements with an abdominal 4D flow MRI sequence with spiral sampling and compressed sensing in patients with chronic liver disease[J]. Journal of Magnetic Resonance Imaging, 2018.
[5] Rossing K , Christensen P K , Hovind P, et al. Progression of nephropathy in type 2 diabetic patients[J]. Kidney International, 2004, 66(4):1596-1605.
Figures